- WE'RE JUST RANDOM SPECKS OF DUST IN A TORNADO TO THE MARKETS .......
- CHARTISTS MUST PUT ALL BIAS ASIDE AND LET THE CHARTS DO THE TALKING OR WE'LL SEE ONLY WHAT WE WANT TO SEE
- This blog has a copy of all header posts that I publish anywhere, so that those interested in seeing what my thoughts are on the markets can find them easily.
- I will be answering questions and responding to comments, so feel free to respond to any posts and I will see your comment even if it is not on the most recent post.
- If you're interested in seeing any intraday charts I post, I do that on twitter, and my twitter handle is @shjackcharts.
- The charts in the posts are as large as I can practically make them. if you would like to look at one more closely, click on it, and the link will take you to a larger version at screencast. If you click on that again, you will get a full page version, and can use the resizing function on your browser to enlarge parts of interest further.

Monday 31 October 2022

Testing The Weekly Middle Band

As of Friday's close our Follow The Leader service at theartofchart.net was up 168% year to date with 90% winners so far. This is an autotrading service in partnership with GFF Brokers, official broker for the World Cup Advisor Auto Trade programs.  This is included in our Daily Video Service and if you're interested in that you can find out more about that here, and you can try a 30 day free trial at theartofchart.net here.

We are hoping to hit 200% on this by the end of the year at which point, on the minimum account size of $25k for this, the profits of $50k this year would repay our most expensive membership option, Trader Triple Play Annual membership at $2,490k per year, slightly more than twenty times over, not accounting for taxes of course.

On to the markets.

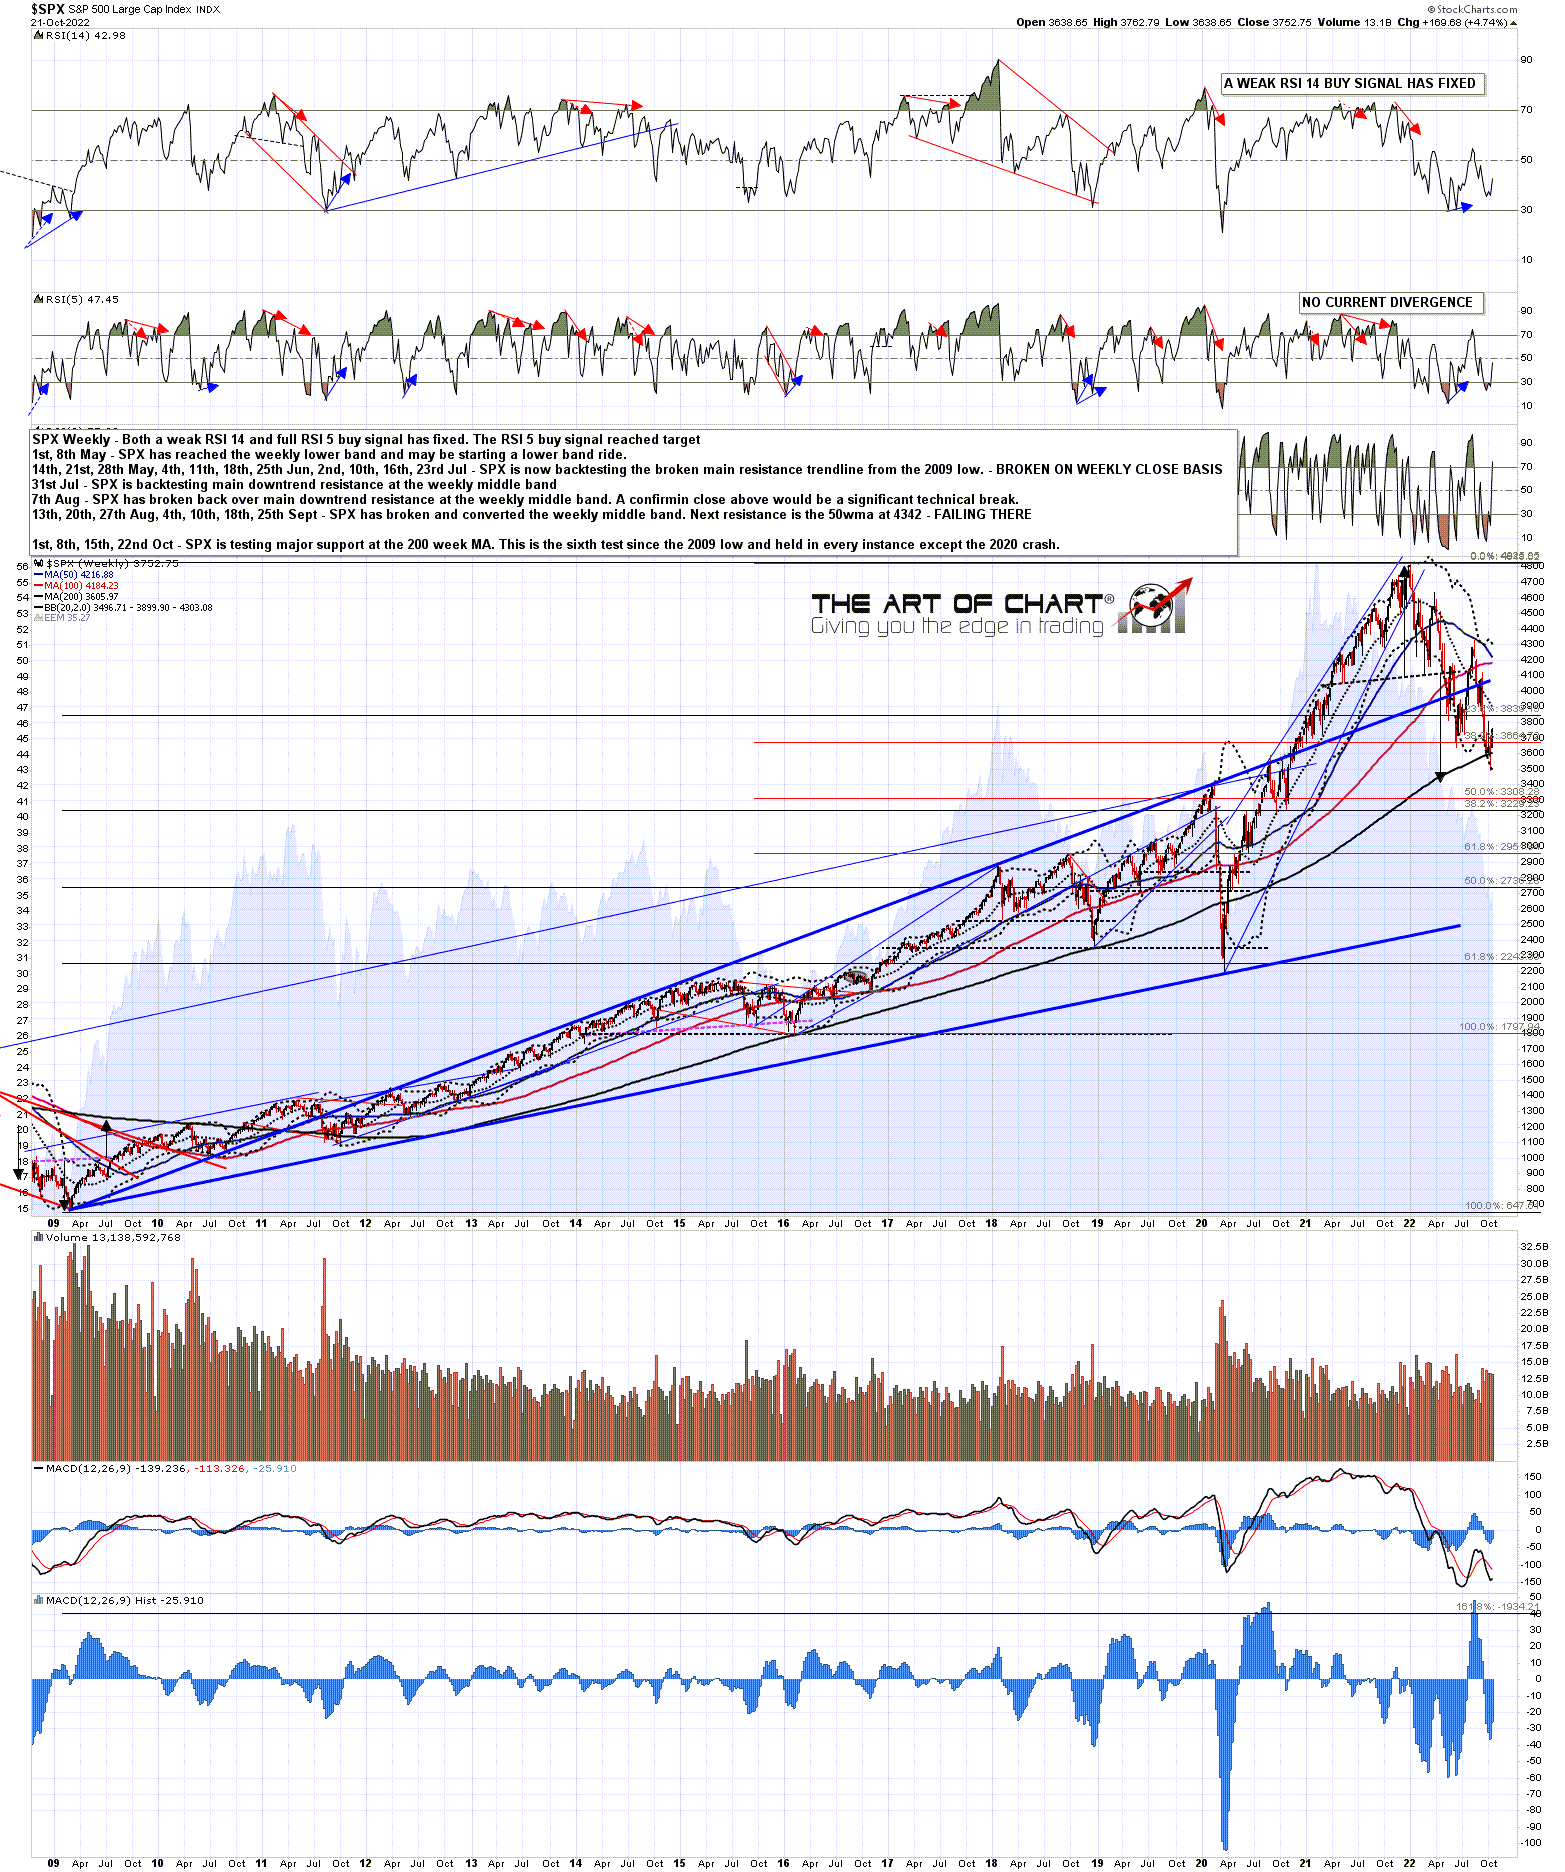
I was saying before the test of 3800 that if it broke then the next big resistance level was in the 3900 area. That is at the weekly middle band of course, and SPX closed at 3901 on Friday, slightly over the weekly middle band which closed at 3899. I wouldn't count that as a break up of course, as it was less than 0.1% above and, for daily middle band breaks I'd be looking for a clear visible break which would be larger.

So SPX is back at major resistance, and this is a significant inflection point for market direction.

If we are to see a fail here, then the usual drill is either that SPX fails directly at the inflection point, so the high is being made now, or we see a clear break above this week that would generally then be rejected with a clear break back below next week.

If we are to see a bullish break up here then we see a clear break above the weekly middle band, which then converts to support and then clears the way to higher targets. I've been reading quite a few calls for a major rally here or even new highs and, if that is on the table, then this is where the bulls demonstrate that to be a possibility by breaking this resistance. Until we see that the likely overall lean here is down.

SPX weekly chart:

When the high at 3886 was made I said that a good way to close out this rally, if of course it is just a rally, would be to retrace enough to deliver a significant decline on the daily RSI 5, then retest the high to deliver a divergent RSI high and both get a possible RSI 5 sell signal brewing and set up a small double top, then SPX would break back down, fixing the daily sell signal and likely ending the rally. So far, that has been forming as expected and, if we are going to see this rally end here, then this is a good setup to do that.

A sustained break back below last week's low at 3803.79 would now look for a target in the 3705-20 area.

SPX daily chart:

SPX hit the daily upper band again on Friday and the middle band closed at 3718. If we do see a reversal back down on SPX then the daily middle band is the next big support level, currently a strong match with that small double top target.

SPX daily BBs chart:

On the hourly chart SPX is still on an RSI 14 sell signal. I also drew in a possible resistance trendline a few days ago that is currently in the 3920 area. That is currently an entirely theoretical potential trendline of course, but if SPX tested it and found resistance there then that would establish a declining channel from the 4325 rally high, with that channel support trendline on course to converge with main falling channel support from the all time highs, currently in the 3350 area, sometime in late November.

This theoretical channel resistance trendline doesn't need to be hit, but would improve the odds of getting down to 3350 if it is hit and establishes the shorter term channel down from the 4325 high.

SPX 60min chart:

Are there any pattern setups here that could be a harbinger of a great bull run to come? Well there is one that looks interesting and that is the setup here on NDX.

NDX has been trailing the other indices this year as some of the main players there have been thoroughly eviscerated, so any serious bull run here would likely require that to reverse, but if it were to do that there is a high quality IHS setup here that on a sustained break above 11685 would look for the 12925 area. There is also a possible larger double bottom here that on a sustained break up over 13721 would look for a retest of the all time highs.

Of course either of these large bullish patterns, on a break up and hard fail, is also a possible bear flag setting up subsequent low retests, but that is one reason they call bull runs a wall of worry. As ever we should take this one inflection point at a time and see how it goes. If the low is in, and a big new bull run is starting, as some are saying here, then this is a pattern setup that I will be watching very closely.

NDX 60min chart:

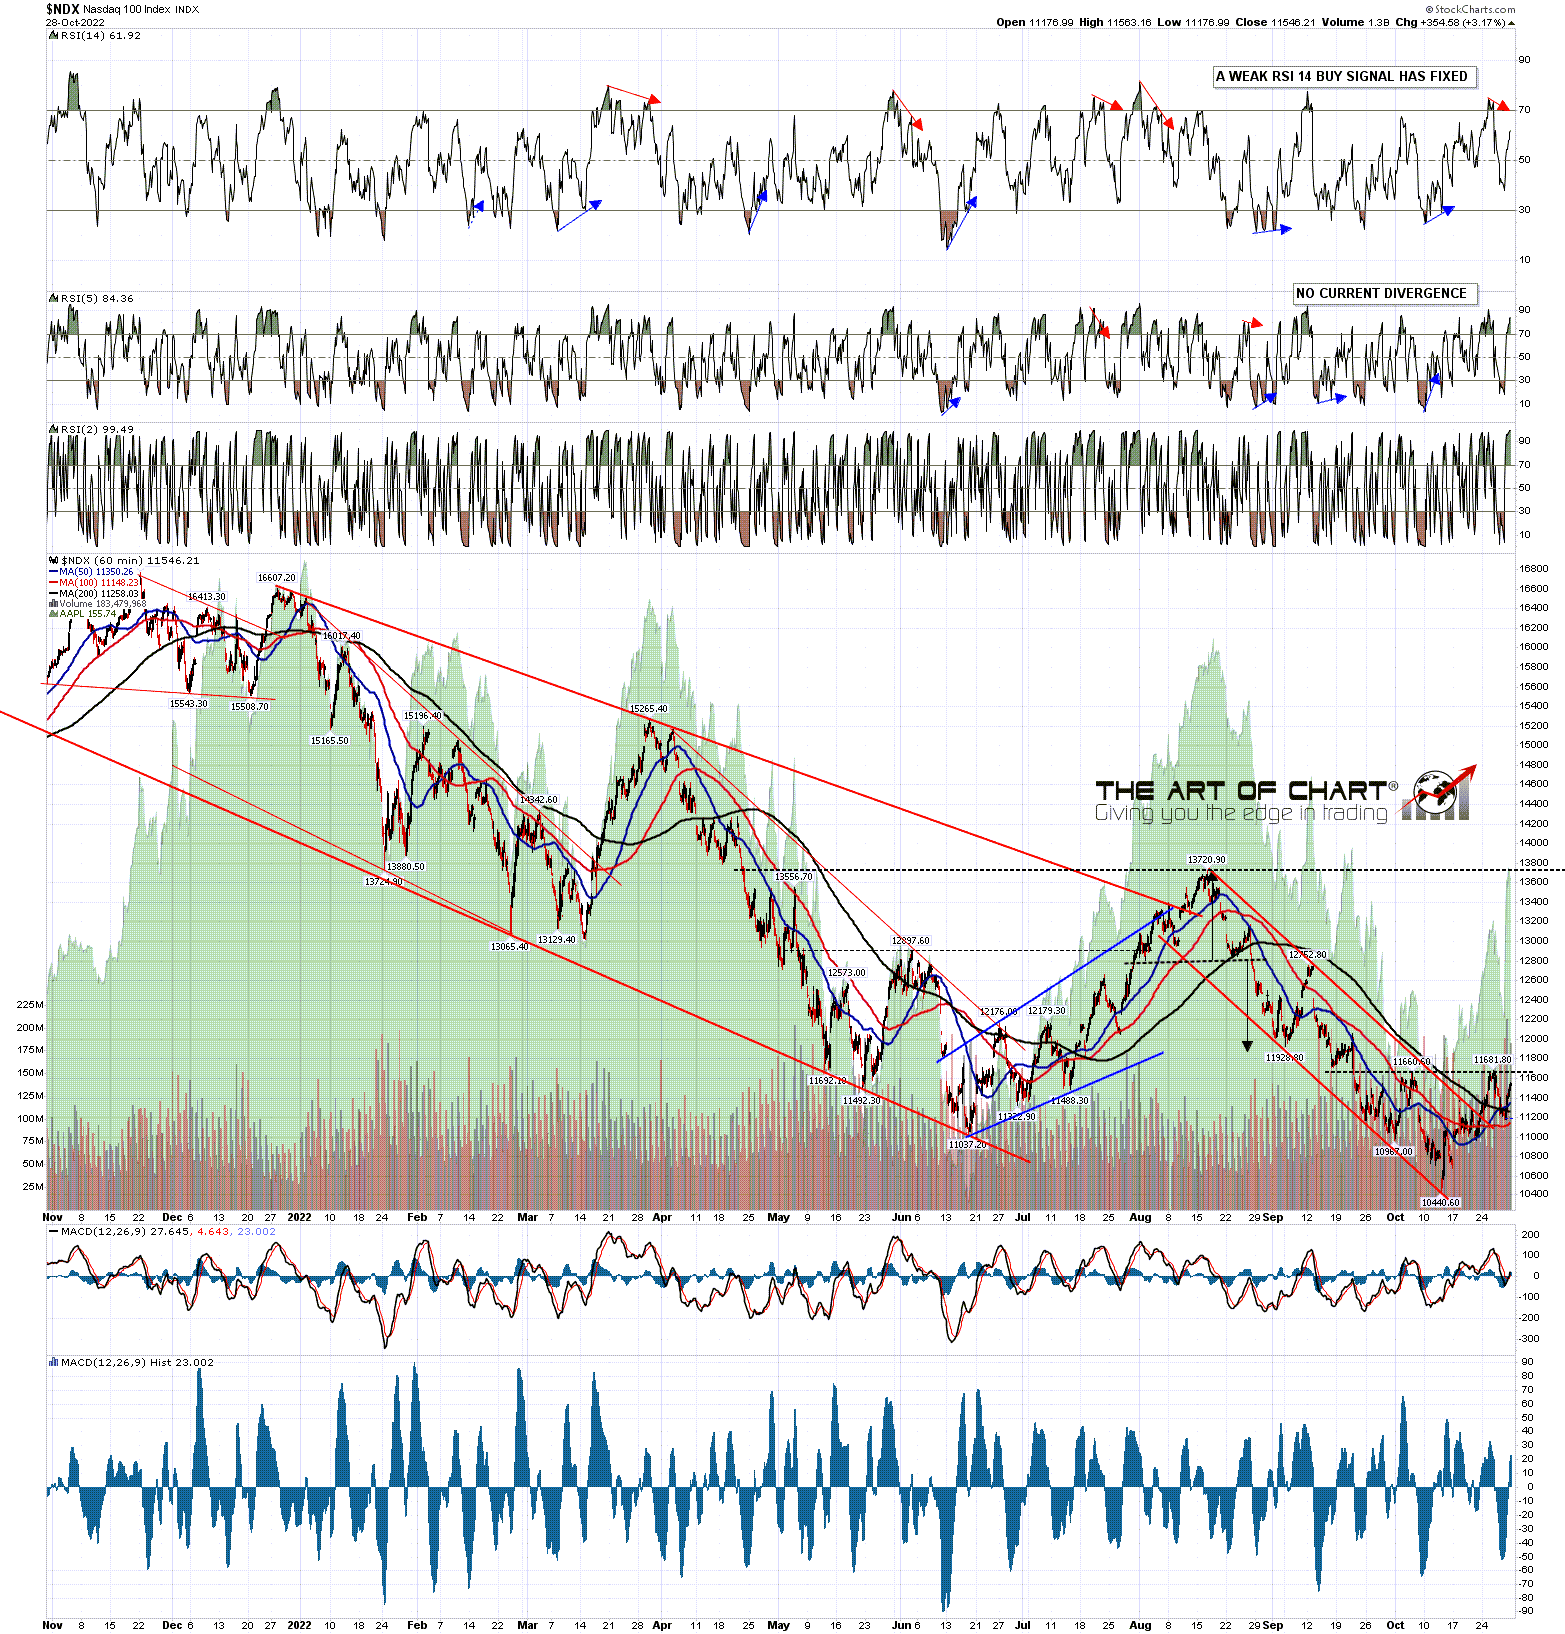
This is a strong topping setup at a major resistance level and I'm favoring the downside. That being the case, the obvious place for this rally to end is at this inflection point. We'll see how that goes.

I'm not yet sure whether we are doing our monthly free public Chart Chat at theartofchart.net on the coming Sunday or the one after so once I know I'll mention it on my twitter.

If today is particularly interesting then I may do another post tomorrow morning. Otherwise my next post should be on Thursday or Friday before the open.

Thursday 27 October 2022

Short Term High .... Perhaps More

I posted the chart below on my personal twitter yesterday morning with the comment that a retracement was likely and that a possible rally high was being made.

I was looking at the perfect hit of the ideal possible rising wedge resistance trendline for this move and the very large amount of negative divergence on the hourly and 15 minute charts.

A higher high was then made that overthrew the wedge slightly and improved the hourly negative divergence further, and since then we have seen a modest retracement which looks likely to go further.

SPX 15min chart (yesterday):

Looking at the same chart now, the obvious next target is a test of rising wedge support from the low, now in the 3740 area.  The retracement yesterday reached a possible H&S neckline, and if we should see either a right shoulder high form here (ideal high 3855 area), or a retest of yesterday's high, then that would set up a reversal pattern that on a sustained break below 3825 would look for a target in the 3765 area.

I would note further that the overthrown rising wedge may be a bear flag from the low, and that the overthrow suggests that the wedge is topping out before it breaks down.

SPX 15min chart:

Obviously the Three Day Rule failed on the break over 3806.91, which was has broken the perfect track record of this stat since the start of 2007. I did mention repeatedly that there is no such thing as a sure thing, and that we would see a fail on this at some point, and so we have. 

What this did resolve though was the oddity I mentioned that if the Three Day Rule did deliver as usual, then the daily RSI 5 buy signal would be unlikely to reach target, which they generally do. On the break over 3806.91 that signal did then make target, and there is now the possibility that if we see a decent retracement here, then a retest of yesterday's high, then we can see a possible daily RSI 5 sell signal start brewing. If SPX is going to head back to the lows next, that would be a good way to set up that decline.

SPX daily chart:

On the hourly chart the higher high yesterday delivered an hourly RSI 14 sell signal that has fixed and not yet made target. These too tend to be reliable signals, with twelve of the last fourteen having reached target. I am expecting this one to make target too.

In terms of retracement targets an obvious target on any decent retracement is the hourly 50 MA, currently at 3756. If a topping pattern forms here along the lines I was looking at above, that would be a decent match with the target.

SPX 60min chart:

If we see a break of the 50 hour MA on this move then the next big level of support would be at the daily middle band, now in the 3695 area.

SPX daily BBs chart:

We are doing our usual monthly public webinar of FAANG stocks and key sector ETFs tonight an hour after the close. It should be interesting. If you'd like to attend you can sign up for that here or on our October Free Webinars page.

If today is particularly interesting then I may do another post tomorrow morning. Otherwise my next post should be on Monday or Tuesday before the open. In that case, everyone have a great weekend. :-)

Monday 24 October 2022

Looking For A Fail

The projection of the larger bull flag that I posted on Thursday morning delivered like a champ, with a perfect touch of the channel support followed by a break up that almost reached the target at a retest of the flag high on Friday afternoon. The full target should be made at the open today. So what now?

SPX 5min chart:


Well the Three Day Rule says that we see a retest of the 3491.58 low before a retest of the 3806.91 high, so unless this is going to fail for the first time in almost sixteen years, further upside is very limited and SPX should fail in this area, starting the move back to 3491.58.

Would I be astounded if the Three Day Rule fails to deliver here? Not really. As I have said, there is no such thing as a perfect stat, so a fail is inevitable at some point, and really I'm amazed that we haven't seen one before. That said, it has delivered the last 150 or so times over almost sixteen years, and there is no particular reason to think that it would fail here and now.

Has SPX come this close to a retest of the Three Day Rule before playing out in the past? Yes, only three or four times I think, but definitely. The odds are that it will deliver again today.

SPX daily 5dma chart:

The daily middle band, now at 3671 is now well established as short term support, and the daily upper band closed Friday at 3799. Unless the Three Day Rule is going to fail here that's about as high as I expect SPX to go today. 

SPX daily BBs chart:

I mentioned that if we do see a fail on the Three Day Rule today then that would open a possible target higher in the 3900 area, and that would be the weekly middle band, which closed Friday at 3899.

SPX weekly chart:

I do now also have an established rising channel on SPX from 3491, and if we see the fail I expect here then that is a likely bear flag. Even if we do see a break up here then this may be a bear flag channel, and I'll be watching channel resistance, now in the 3865 area and rising at about 25 handles per trading day.

SPX 15min chart:

We are doing two public webinars at theartofchart.net this week after the closes on Wednesday and Thursday. On Wednesday we are doing our monthly Trading Commodities webinar, at which we will be designing three options trades. If you'd like to attend you can sign up for that here. On Thursday we will be doing our usual monthly public webinar of FAANG stocks and key sector ETFs. If you'd like to attend you can sign up for that here.

My next post should be on Thursday or Friday before the open.

Thursday 20 October 2022

One More High Needed ........... Probably

Last Friday there was a clear break back below the 5dma, and that was a fix under the Three Day Rule. On this rule SPX should retest the last low at 3491.58 before any retest of the prior high at 3806.91. I haven't counted but there have been nine previous fixes in 2022 and I'd be surprised if this rule hasn't fixed well over 100 times since the start of 2007 and on the current rules for this, after a small tweak in 2019, there has not yet been a failure, although there have been two marginal higher lows when triangles were forming at the lows.

I have mentioned that there is no such thing as a perfect market stat, and that I would therefore expect to see a fail on this stat at some point, but there's no particular reason to think that would be here. I have been asked this week what I would expect to see if it does fail here but, as that hasn't happened before, I have no idea, though it would open the next possible resistance level in the 3900 area.

The chances are that the Three Day Rule will deliver again this time and, if so, upside from here is limited and SPX has likely either turned down already, or is currently topping out for the next move down to retest 3491.58.

SPX daily 5dma chart:

I was thinking that we would likely see SPX fail to convert the middle band to support on this move but SPX gapped back over the daily middle band on Tuesday morning and did the confirming close above it yesterday. Short term support is therefore at the daily middle band, currently at 3666.51. When SPX closes back below it and confirms that close then the next move down should have started.

SPX daily BBs chart:

On the SPX 15min chart a decent quality rising wedge formed from the 2022 low and that broke down yesterday. Now that could be just because SPX is establishing a less steep support trendline but, under the circumstances, I think SPX is topping out and while it may already have topped, there is some reason to think that a retest of the current high at 3762.79 is needed. 

SPX 15min chart:

I posted the chart below on my twitter this morning showing a decent looking bull flag wedge that on a break up would look for a retest of 3762.79. That broke up later on this morning though that high has not been retested because (opportune teaching moment) ........

SPX 5min chart:

....... sometimes the bull flag then evolves into a larger bull flag. This is worth noting as it happens quite a lot. In this instance the initial bull flag wedge has evolved into a larger bull flag channel, marked in the dotted blue lines.

Not all bull flags break up of course, and this one hasn't broken up yet, but if it breaks up and retests the high at 3762.79 that would set up a high quality double top that could deliver most of the move back down to 3491.58.

SPX 5min chart:

I'm leaning towards seeing a retest of the current high at 3762.79 before the likely next leg down to 3491.58 begins.

My next post should be on Monday or Tuesday before the open.  Everyone have a great weekend. :-)

Monday 17 October 2022

No Such Thing As A Sure Thing

On Friday morning I was writing that SPX went back onto my Three Day Rule on the break back over the 5dma at the close on Thursday night. Under that rule, if either of the next two closes delivers a clear break back below the 5dma, then the prior low, in this case 3491.58, will be retested before the prior high, in this case 3806.91. There was a clear close back below the 5dma on Friday, so that is a fix on the rule.

Now this is the most impressive performing market stat that I have ever seen anywhere about anything. There have been nine previous fixes so far in 2022, all of which made target and I'd estimate somewhere in the region of 100 - 200 fixes since the start of 2007, which is as far back as I looked when I first investigated this in 2011/2. With a minor rule fix in 2019 requiring a clear close below the 5dma for a fix, every one of those has made target barring a couple of very near misses when a triangle has been forming at the low.

So, coming to the title, is it a certainty that 3491 is retested before 3806? No. There is no such thing as a sure thing in the market, and a perfect stat is just one where there has been no exception yet. Is that exception likely to be here? No. There is a strong likelihood that 3491 will be retested before 3806 and the closer SPX gets to 3806, the more attractive the short back to 3491 becomes.

SPX 5dma chart:

On the weekly chart there was a close 16 handles below main support at the 200 week MA. That was interesting but not the conviction close needed for a solid break. Apart from the 2020 crash though, it was the first close below it since 2011. I think a stronger break below is likely soon.

SPX weekly chart:

On the SPX daily bands there was a hard rejection at the test of the middle band on Friday, and that is being tested again today. If we see a close above that today I'll be looking for a rejection back below it tomorrow.

SPX daily BBs chart:

We may be looking at an ABC rally here in which case the high for this wave may need to be above Friday's high at 3712. If so that will be a very attractive looking short setup.

SPX 15min chart:

There is a fair amount of positive divergence looking higher here, but on the other hand the Three Day Rule tells us that 3491 should be retested before 3806. No stat can deliver every time, but the history tells us that the market will very likely be turning down again shortly.

My next post should be on Thursday or Friday before the open.

Friday 14 October 2022

Still Testing The SPX 200 Week MA

Apologies for this being my only post this week. I'm moving house in a few weeks and I've been really busy.

In my last post I was looking at the possible hard fail setup on SPX, NDX, IWM and Dow if the inverted H&S patterns that had broken up failed on moves back below the right shoulder lows on those patterns. On that fail there would be targets back at the retests of the 2022 lows and the last of those four low retest targets were hit at the low yesterday.

SPX tested the 200 week moving average for the third time this week and did an impressive pinocchio below it yesterday morning, though SPX recovered back over it quickly. For what it's worth that was the largest pinocchio down through it since the low in 2009, excluding of course the hard break below it in 2020.

If the economic outlook wasn't so dire I'd be looking for a possible serious low here, and I'm still keeping that in mind as a possibility, but the more likely outcome is that this rally here plays out and the 200 week moving average, now at 3600, continues to be tested until it breaks in earnest and converts to resistance.

SPX weekly chart:

It is a rare thing for an SPX daily RSI 5 buy signal not to at least make the possible near miss target in the 65-69 area on the daily RSI 5, and this one hasn't. I think there is a decent chance that it will make that target on this rally, though it might fail too soon, and I have two main initial target areas, the first of which is being tested as I write this. A test of the next resistance area in the 3810 might well get that buy signal to target.

SPX daily chart:

The last rally high was at the daily middle band on SPX, and the low yesterday hit the daily lower band. The first obvious target and serious resistance is back at the daily middle band, now at 3710, and that is being tested today. The rally may well fail there, either directly at resistance, or with a closing break above today that is rejected on Monday.

SPX daily BBs chart:

SPX closed back over the 5dma yesterday, currently at 3617, so SPX is back on the Three Day Rule. If there is a close back below that today or Monday of at least five handles below, then we will very likely see a retest of yesterday's low at 3491.58 before a retest of the last rally high at 3806.91. On the current basis of calculation (after a small tweak in 2019), this rule has fixed and made target well over a hundred times since the start of 2007 without a single fail apart from two very near misses when a triangle was forming at the low.

SPX daily 5dma chart:

If SPX can break and confirm the close back over the daily middle band then the next big target and resistance area would be the possible double bottom resistance at 3806.91 supported by the declining resistance from the 4325 high, now in the 3835-40 area and declining of course. A break and rejection over that would again look for a retest of the lows. A hard break over that level would look for a minimum target in the 4030 area, at which point I would be starting to take the possible swing low scenario here more seriously.

SPX 15min chart:

I'm still keeping an open mind on a break over the daily middle band here, though the initial rejection there this morning isn't encouraging for bulls. We'll see, but if we see a clear break back below the SPX 5dma today or Monday then I'll expect a retest of the lows soon after, and if that retest is seen then SPX may well be on the way down to the next serious trendline support now in the 3350 area.

My next post should be on Monday or Tuesday before the open.  Everyone have a great weekend. :-)

Thursday 6 October 2022

The Ghosts Of Christmas Past

There's been quite a bit of speculation about a possible bear market low having just been made at the last low, and that is technically possible, though I think rather unlikely. More likely is the possibility that SPX is returning to retest the all time highs to make a second high on a huge double top pattern looking for a retest of the 2020 lows, but even that is doubtful in my view. I think that if the high had been going to get a retest then the rally that ended at 4326.28 would likely have continue higher into that then.

What is there to support a low for 2022 low here? Well if this was just a correction or technical bull market then the low SPX just made at the 200 week moving average would definitely be the right place to make that low, with the lows in 2011, 2016 and 2018 all made there, so this is at least definitely the right place to see that.

There is also a theory I've heard a lot over the years that as bonds become less attractive then money flows into equities and bonds are really looking unattractive here. I've seen little evidence in the past though that this theory has any credibility, and with ten year bond yields having more than doubled so far this year, while at the same time SPX is down almost 25% from high to low over the same period, that is a very slender thread of hope to hang a major reversal on.

Everyone remembers the great bull runs that followed the big lows in the last fifteen years, and many would love to see another of those here, but the winds really have changed, and while I'm keeping an open mind, I think this is just a rally before the 200 week moving average breaks.

SPX weekly chart:

On the SPX daily chart SPX is reaching the first real resistance at a backtest of the daily middle band, which closed yesterday at 3816. There is a very possible fail setting up here, but if that breaks and converts to support then that opens up the next level at declining resistance from the rally high at 4325, now in the 3915 area, and backstopped by the next big levels at the weekly middle band, now at 3953, and the psychologically important 4000 level.

If SPX can break and convert 4000 then I will start to take the 3584 low more seriously, though it will only look really impressive on a break over SPX falling channel resistance in the 4220 area. If that breaks then a possible all time high retest will be on the table.

In terms of the open buy signals the daily RSI 5 buy signal has reached the possible near miss target, so that minimum level has also been reached.

SPX daily chart:

There is a potential hard fail setup right here, and that is because across the US indices credible IHS right shoulders formed yesterday and all of those IHS patterns broke up at the close. The one below shown on the SPX 15min chart has broken up with a target in the 4000 area.

Why is this a possible hard fail setup? When a pattern like this breaks up, then then one of two things is very likely to happen. The first is that the pattern makes target, and the second is that the pattern fails, rejecting back into a retest of the prior low. If SPX breaks back below yesterday's IHS right shoulder low at 3722.66 then the IHS will have failed and that will fix a target back at the prior low at 3584.13.

SPX 15min chart:

Dow has been leading this market from a pattern perspective and there is a very decent looking IHS there too that has broken up with a target in the 31950 area.

INDU 15min chart:

There are a couple of things worth noting from the Dow daily chart. The first is that the daily RSI 14 buy signal that just fixed is the first one since the 2020 low, which is at the least encouraging for surviving bulls.

The second is that there is a still a very decent looking potential bull flag from the all time high, though the support trendline isn't quite as perfect as I like. If we were to see a break over flag resistance now in the 33900 area then I would start taking this flag seriously.

INDU daily chart:

I liked the rally setup here and it delivered. That has now reached the minimum level I would expect and may fail here. Will it go higher? Well the market needs to make that decision, but a strong break up would look for a test of the 4000 area.

Our monthly free public Chart Chat at theartofchart.net is at 4pm EDT on Sunday and it should be interesting. If you'd like to see that you can register for that here or on our October Free Webinars page.

My next post should be on tomorrow or Monday before the open.  If I don't post tomorrow then everyone have a great weekend. :-)

Tuesday 4 October 2022

Holding The SPX 200 Week MA ...... So Far

As of last weekend our Follow The Leader service at theartofchart.net was up 159% year to date with 90% winners so far. This is an autotrading service in partnership with GFF Brokers, official broker for the World Cup Advisor Auto Trade programs.  This is included in our Daily Video Service and if you're interested in that you can find out more about that here, and you can try a 30 day free trial at theartofchart.net here.

I was looking at the possibility on Friday on a decent rally from strong support in the 3600 SPX area, and that rally may well have started. On the SPX daily chart both RSI 14 and RSI 5 buy signals have fixed yesterday and there is a clear bottoming pattern here that could take SPX back up into the 3885 area on a sustained break back up over 3736.

SPX daily chart:

For the second time in the last week SPX has delivered a closing break back up over the 5dma, so SPX is back on the Three Day Rule. That means that if we see a clear close back below the 5dma, currently at 3654, either today or tomorrow, then we should see a retest of the recent low at 3584.13 before a retest of the September high at 4119.28.

I didn't mention the Three Day Rule in a post last week because that low retest target was made at the same time the target fixed with the close back below the 5dma, but that is fairly unusual. I haven't marked that on the chart as I just disregard these when they happen.

SPX daily 5dma chart:

Why is this 3600 area support so significant? Well history as ever. Everyone watches the 200dma but the 200 week MA is just as, or even more, significant and that is currently in the 3595 area.

On the weekly chart below you can see the 200 week moving average on SPX over the last fourteen years. After the 2009 low the high in 2010 tested it as resistance, then it was support at the lows in 2011, 2016 and 2018. It was broken hard though briefly in the 2020 crash and now it is being tested again. Apart from the 2011 lows where it was tested and repeatedly pinocchioed over multiple weeks, and the break in 2020 of course, it held almost precisely at the other tests in 2010, 2016 and 2018.

This is likely the most important bigger picture moving average on SPX and while there is good reason to think this might break later in the year, it is a very obvious place to see a strong rally now.

SPX weekly chart:

So where might this rally be headed? Well the first obvious big targets are backtests of the daily or weekly middle bollinger bands on SPX. The lower of those is the daily middle band, now at 3832, and the higher is the weekly middle band now at 3948.

SPX daily BBs chart:

There is also a reversal pattern here of course, and that is an asymmetric double bottom on SPX with double bottom resistance at 3736.74 and alternate targets in either of the 3850 or 3885 areas. That is backed up by an even nicer double bottom on Dow where daily RSI 14 and RSI 5 buy signals both also fixed yesterday.

That reversal pattern on SPX isn't a bad fit with declining resistance from the rally high at 4325.28. That's now in the 3935 area and declining of course. That trendline is just under the weekly middle band and is the most obvious target for this rally if SPX can break and convert double bottom resistance at 3736.74.

SPX 60min chart:

I'm still keeping an open mind on a rally here. The setup is solid but the news is grim and a strong enough trend will run over divergence and reversal setups. The market rarely goes up or down in a straight line though and from a technical perspective this rally setup is really very nice indeed. I like it a lot so we'll see what happens at resistance today.

Our monthly free public Chart Chat at theartofchart.net is at 4pm EDT on Sunday and if you'd like to see that you can register for that here or on our October Free Webinars page.

My next post should be on Thursday or Friday before the open.  :-)