- WE'RE JUST RANDOM SPECKS OF DUST IN A TORNADO TO THE MARKETS .......
- CHARTISTS MUST PUT ALL BIAS ASIDE AND LET THE CHARTS DO THE TALKING OR WE'LL SEE ONLY WHAT WE WANT TO SEE
- This blog has a copy of all header posts that I publish anywhere, so that those interested in seeing what my thoughts are on the markets can find them easily.
- I will be answering questions and responding to comments, so feel free to respond to any posts and I will see your comment even if it is not on the most recent post.
- If you're interested in seeing any intraday charts I post, I do that on twitter, and my twitter handle is @shjackcharts.
- The charts in the posts are as large as I can practically make them. if you would like to look at one more closely, click on it, and the link will take you to a larger version at screencast. If you click on that again, you will get a full page version, and can use the resizing function on your browser to enlarge parts of interest further.

Friday 30 December 2011

Adieu 2011

Well what a wild year this has been. Huge moves but a finish within spitting distance of where SPX began the year. I was looking through my many index charts this morning and found the following chart of the Wilshire 5000 that I probably did in very late June and hadn't looked at since. You can see the arrows marking where I thought the index might go from there. Very spooky. I suspect I did the chart on the morning of 30th June as I posted a similar SPX chart that day which you can see here. This Wilshire chart also underlines the very strong resistance at the level being tested now there and on SPX at the very important 200 day SMA:
It used to be a rarity to have two trend days in opposite directions back to back, but I think the last three trend down days have now all been followed by trend up days. The strong bounce that I was suggesting for EURUSD obviously played out, with a 100+ pip move up from the low. That isn't bullish on the bigger picture yet, though it's possible that EURUSD has now put in a double bottom on positive RSI divergence on the daily chart. If we see an hourly close over declining resistance then I'd move that up to probable. Everything marked on the chart with targets:
On the ES chart we now have a very nice looking IHS almost formed on the 60min chart. The target would be in the 1330 area if this was a reversal IHS, but obviously it isn't, and the target could not be relied upon. I have seen these play out in the past though and a break up over the neckline would look bullish regardless:
SPX was rising with bonds yesterday, and Vix has also had a strong week. These are significant divergences and can't last. Either bonds or equities are going to break downwards shortly and I'm expecting it to be equities. Either way we're unlikely to stay at this level long. Here's the Vix chart where the obvious retracement target at the middle bollinger band or 20 day SMA has not yet been hit:
I've a selection of other charts for you today. The first is the weekly Ichimoku Clouds chart on SPX, which shows the next big resistance and target if we do see a break up here in the 1300 area. A break over the cloud with any confidence would be a strong indication that we are looking at a new bull market, though for various reasons I still think that's unlikely:
Next up is the FTSE daily chart, showing the big resistance here. FTSE will follow SPX here but the obvious next move is down. I haven't shown it on a chart today but the SPX 200 day SMA is still big resistance here and you can also see on the Wilshire 5000 chart at the top that we're up against it there as well:
I was looking at the Shanghai Composite chart this morning and that's in a sorry state. Shanghai never exceeded the high made when it double from the late 2008 low into the end of the 'dash for trash' rally in July 2009. Rising support from that low (and arguably the lower trendline of a triangle with an improbably low target marked on the chart) broke in the summer with a retracement kiss goodbye. A declining channel then formed which is breaking downwards. It seems most unlikely that China stocks will support any big move up on equities here and I read that the outlook in India is even worse:
Last chart of the day is GDX, where the lower trendline of the broadening top was hit yesterday with a strong bounce so far. The positive divergence on the daily RSI looks supportive of at least a decent bounce:
On the last trading day of the year SPX has closed down nine of the last 11 years, and after trend up days following trend down days, 70% have closed down. Both stats from Cobra who has now moved to being a subscription site. We're just under major resistance and unless we see a new high on SPX over 1269, Pug, Alphahorn, Alex Grant's ES Forecast and myself are ALL leaning bearish for next week. If we break the lows this week on a move down next week, I would now have a new double top target in the 1220-3 ES area and if that area were to break we could go a lot lower. I'm thinking that a gap fill today looks likely and a major resistance break today looks unlikely.

I'll be out most of the trading day today with my younger son. Everyone have a fun holiday weekend and a great New Year in 2012.

Thursday 29 December 2011

EURUSD Still Important

There have been quite a few people saying that as EURUSD has kept falling since late November while equities have rallied, then that means that these have decoupled and the relationship is no longer important. As we saw yesterday that simply isn't the case. While it is true that the multi-week trends on them have decoupled for the moment, as is often the case, on the daily timescales a big move down or up on EURUSD will still generally be shadowed by a move on equities.

Short term I'm still using TRAN as my leading index for equities, and the obvious next move there within the ascending triangle is to rising triangle support in the 4900 area. That should roughly equate to a move to the 1225/30 area on ES, and that's where I'm expecting this move to finish as ascending triangles break up 70% of the time:
On ES the little double-top  that was forming as I wrote my post yesterday played out almost exactly to the 1244 target. The 60min RSI reached oversold and it's possible that this retracement is complete, but on balance the odds favor more downside after a bounce I think. On a conviction break of 1244 I have some support at 1232.25 but I'd be mainly watching the big support level at 1223-5 which should match up best with TRAN hitting triangle support. If we reach the 1223-5 area then it's worth noting that there is a potential H&S neckline there:
As I suggested in my EURUSD chart yesterday the break of the support trendline on EURUSD was swiftly followed by a test of the lows and then a new low. I've mixed feelings about EURUSD at this level as there is some decent support in the 1.287 - 1.29 area and there is some positive divergence on the 60min RSI. However falling wedge support is in the 1.274 area at the moment and I posted a chart in early November giving an H&S target  in the 1.27 - 1.275 area. Until demonstrated otherwise I'm expecting EURUSD to fall to that area and find some support there:
I've seen quite a few references to a cup with handle that has formed and broken up on DX / USD, and you might be wondering why I haven't mentioned that. The reason is two-fold. Firstly the cup was a V shape where it needed to be a U shape, and secondly these aren't great at making target in any case. Worth bearing in mind in this case but not to be relied upon in my view. I'm referring to the cup with handle that formed in October to December between 75 and 80. There is a larger one that has taken all year to form but that should be disregarded because it would be a reversal pattern, and a cup with handle is a continuation pattern. What I do have on DX is a decent rising channel for the current move and that's what I'm watching. As 80 is a strong historic support/resistance level I'm also expecting it to become significant support if DX can get much over 82:
Gold had a bad day yesterday and I've updated my main gold chart to show the significant support levels as I see them here. Gold hit one of those yesterday and that is at rising support from the 2008 low in the 1550 area. That is a significant level though this is only the third hit of that trendline. If 1550 breaks then I have stronger support in the 1500 area at a six-hit support trendline from January 2009 that hasn't been hit since July 2010. If gold falls below 1500 then the door is open to a much larger reversal and I'd be watching support areas in the 1300, 1150 and 1000 areas. I'll be watching gold carefully as I'll be backing up the truck as and when I think it is bottoming out. I do not believe that the gold bull market is over:
30yr Treasury futures have broken back well above the support trendline that broke down the other day, so I'm wondering about another run at the highs. I posted the 26 year declining channel in 30yr treasury yields a few months ago and it's worth dusting off here so see where bonds are on the very long view. Still some way off target which would now be under 20 or 2%. The last three months have the look of a bear flag but if we do see a move directly down to the bottom of the channel then that would be the fastest move from channel resistance to support in the long history of this channel. We are trading in a long period of extremes at the moment of course, but history would suggest at least some more consolidation first I think:
Yesterday was a trend day down and I'd expect to see at least some bounce or consolidation today during normal trading hours. Looking at the growing positive divergence on the EURUSD 60min RSI we could see a strong bounce on EURUSD today and that that may well be matched by a strong bounce on equities. It is possible that the retracement yesterday is all that we are going to see but for a number of reasons at least some more downside seems likely.

My plans for the weekend have changed so I'll be doing a post tomorrow.

Wednesday 28 December 2011

Retracement Setup vs Holiday Apathy

ES broke the support trendline from the low at the close last night and if we're going to see a retracement then this is the place. I've not marked it in but the hourly 50 SMA was support last night and an hourly close below that should confirm a retracement here. That's currently at 1257.5. There's a currently promising double-top setup with the target in the 1244 area and a potential H&S neckline, and decent support, in the 1250 area:
On the TRAN chart I posted yesterday TRAN very slightly overshot ascending triangle resistance and the setup here is also promising for retracement. A break above with confidence today would be a significant resistance break and would most likely kill the retracement setup here and on ES. If TRAN were to reverse towards rising support then that would give a potential retrace on SPX of 40-50 points, though that looks very ambitious:
One thing that looks promising on the short side here is the laborious way that EURUSD has been crawling painfully up the support trendline. The move up couldn't really look much less impulsive and suggests that EURUSD will at least retest the lows soon. EURUSD hasn't actually hit declining resistance however, though it is only 25 pips above at the time of writing. The support and resistance trendlines are converging fast so EURUSD will have broken one or the other by this time tomorrow:
A short post today so I'll leave it there for the short term charts. For the last chart today I'd like to thank AllAboutTrends as I started looking hard at the NYA index after seeing a chart of theirs yesterday. NYA is the NYSE composite index, which includes about 2000 stocks listed on the NYSE, excluding ETFs and so on. It is therefore a very broad index and what I found there looks very interesting indeed.

Some of you may recall that I was targeting 1000 - 1020 on SPX in the summer and the reason for that was that my target area was the neckline on a monster H&S that might have been forming. Obviously SPX didn't make it down that far, but NYA did make it, and you can see that, and also the analog monster H&S that formed between 2005 and 2008 for comparison. Will that continue to form? Who knows? If it does though then we could see another one to five months trading in the range of the last three months while the right shoulder completes. What I would add here is that this monster H&S would be a decent match to similar patterns forming on EEM and GBPUSD, among others, so it does bear watching here.

What was also interesting was that the H&S that failed in summer 2010 never actually broke the neckline on NYA. I'll be adding this index to my regular watchlist:
Short term this is a very promising reversal setup on ES but I'm wondering whether this low volume and apathetic tape will allow much of a retracement. We shall see. As I said, an hourly close below the hourly 50 SMA on ES would be a good sign that we should at minumum test 1250, and it that breaks then the retracement could run quite a way further down.

Tuesday 27 December 2011

Follow the Leader

One thing I aways look around for in the event that trendlines aren't lining up that well on SPX is another major index that may have assumed the lead for the time being. That index for the moment is the Transports index, and I say that because the last low there was a perfect hit of the rising support trendline from the October low. On the transports index I'm seeing what looks like a 70% bullish ascending triangle, which just needs (ideally) another reversal from the upper resistance trendline to confirm it. That resistance level is now 2% above and 'll be seeing that as strong resistance this week:
It does look like we might see a sharp reversal soon. ES is making higher highs on increasing negative 60min RSI divergence and is inching up through a strong resistance zone. There is a clearly defined support trendline that should signal when a retracement begins. On the SPX the daily 200 SMA has now been penetrated and the last close above this in October reversed after a day or so:
So where are equities on the bigger picture? On thing I'm watching for is a bullish cross on the SPX weekly 13 & 34 EMAs. The 13 week EMA is now only 6 points below the 34 week EMA and a break over the 34 with confidence has been a very reliable bull signal in the past:
On the SPX daily chart a (golden) cross of the 50 & 200 daily SMAs is still some distance away. I've marked those crosses up on this 6 year chart but I've also added the a review of the reversal H&S patterns (four made target, one failed) that formed on all of the last five big reversals on SPX. There is no sign of one here, as the several week IHS that many are looking at doesn't qualify as a reversal IHS. You don't have to have one of these form of course, but I'd be more comfortable with the idea that a big new bull trend has started if there was one:
What else do we normally see on a big new bull wave up in equities? Positive divergence from copper and other commodities, and negative divergence from USD and bonds. You don't need to see all of those, but at the moment we aren't seeing any of them. For that reason, if we see a big move up on equities over the next few weeks, and I think we might, I'll be looking for failure in the 1320-1400 area and will throw out again the possibility that we might see a double-top, with the October low on SPX as the pattern neckline.

Over the next few weeks, and regardless of the sharp retracement that I'm expecting to see this week, I'm leaning bullish now, and would see that sharp retracement as a buying opportunity. SPX has broken declining resistance from the July highs, and for me the next obvious target is declining resistance from the high in the 1310-20 area. 30yr Treasuries have broken rising support from the October lows which opens up more downside there:
A bounce on EURUSD would help a strong bounce on equities a lot, and EURUSD is still trickling up towards declining resistance. I think EURUSD may well be in a short term bottoming process but the pinocchio through short term rising support on Friday has me leaning towards a test of the lows before any more substantial bounce. Rising support will meet declining resistance on EURUSD within a day or two so it will have to break one way or the other soon:
The other reason I'm leaning towards seeing a sharp retracement this week is that we are now testing the limits of what can be expected on a Santa Rally. If we see a move up straight into 1300 resistance by the end of the week then that would put this Santa Rally on a par with the previous strongest example in the 80 years since the idex was founded. That would be a very rare event and rare events are by definition rather unlikely. The current move up is showing signs of exhaustion and I'm expecting reversal shortly. After that reversal I'm expecting to see more upside into mid-January.

I'm not going to be trading much this week and will be away for some of it. I should get a full post out tomorrow, a short post out on Thursday and possibly no post at all on Friday.

Friday 23 December 2011

Holiday Resistance

Today is the last trading day before Xmas of course, volume will be low and we might not see a lot happen. I'll take this opportunity to add some longer term charts to the mix today to reflect on what trend, if any, might be emerging from this long road to nowhere this year. SPX reached 1255 yesterday, just under the 1257 break-even level for the year. It looks like it might open a little higher but whatever happens in the five remaining trading days this year, this won't have been a year where equities in the US will have moved much overall.

In the short term on ES we have now reached the double-bottom target at 1255 that I gave on Tuesday. ES has formed a decent rising channel since the low, with channel support now at the 1250 level.  As SPX has now reached the important 1257-1260 level it will be interesting to see whether it is that level or ES rising channel support, or possibly both, that breaks today:
The SX 15min chart is showing some weakness, with rising support from the low broken yesterday afternoon:
The triple-test for SPX today is at the break-even level for SPX in 2011 at 1257.64, and the 200 DMA and declining resistance from July in the 1259/60 area. How significant would a break up be? Not that significant as long as the break doesn't hold long enough for the broken resistance to become broken support. I've done a longer term SPX chart today to give the five year picture on SPX as I see it here. That includes the declining resistance trendline from the 2007 top that would be the next real big test if we do see a break up with confidence here, as well as the rising channel from the 2009 low that the bears have to break if we are to see real downside in 2012:
What else would we need to see to get a forceful break up on equities here? Well EURUSD will need to get up off the mat and break declining resistance from the October high. You can see a little broadening ascending wedge has formed since the recent low but what I have also marked on the chart is the possible lower channel trendline that is in play if EURUSD cannot break decklining resistance and breaks downwards instead. That would have a lower target in the 1.20 area and is worth bearing in mind as that would be a retest of the 2010 lows:
The other thing I'd be looking for is a break down on 30yr treasury futures through the rising support trendline from the October low. That's still holding so far though it is being tested as I write this:
Vix is hugging the lower bollinger band as I've mentioned before. That's not immediately bearish but it is a big warning flag:
I was looking through some of my longer term charts this morning to consider the longer term trend here. If this was the early stages of a strong new bull trend there are a number of things that I'd be looking for as encouraging directional pointers, and those would be positive divergence on emerging markets (EEM), copper, EURUSD and Nasdaq. Currently those are all showing negative divergence to SPX, which makes me doubtful about a strong bull move here. On EEM you can see the very weak relative performance this year on the comparitive daily charts and the middle of the three charts is the EEM:SPX relative trendline which looks very weak:
No need to show the Nasdaq chart here for relative performance. With ES almost testing the December highs NQ is still almost 80 points below. On EURUSD I used it as the background for my longer term SPX daily chart, which is worth a close look. The comparison with with 2008/9 and 2010 is interesting but either way no strong new uptrend took hold either time without a decent bottom being made on EURUSD, and there's currently no sign of that having happened as yet. On the copper chart the rising channel from the 2008 low broke down in the summer and copper made a very nice double-top this year that then just overshot the pattern target and has since been forming a triangle under the double-top neckline. That might break up of course, but the weakness relative to SPX is still very striking:
Overall I take the view that we are still in a bear market until demonstrated otherwise. As for the short term, unless we see a strong break up supported by EURUSD particularly, then I'm expecting a short term high to be made within two or three trading days. The seasonality favors the bulls here of course but against that we have already seen a strong move up from the lows. There are some very interesting stats on Santa rallies here from the excellent (and free) Trading The Odds blog, and you can see that historically we are already pushing the limits of what can be expected from Xmas moves up. Just to hold at the current level into New Year would make this the strongest Santa Rally since 1991, and on a par with the next best result down in 2000. Those two were the only Santa Rallies since 1940 to exceed 4%.

My posting schedule will be slightly more erratic next week, but I should get a post out on Tuesday with a shorter post on Wednesday and possibly no post at all on Thursday.  Everyone have a great holiday!

Thursday 22 December 2011

Seeking Alphahorn

I called the retest of 1225 ES as the retest target yesterday morning and the low was at 1223. Pretty close. The SPX low was 1229 which was called as the likely target by both of my EW analyst friends Pug and 
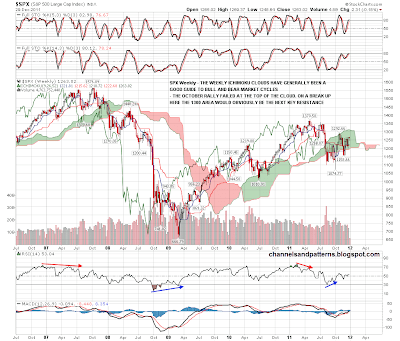
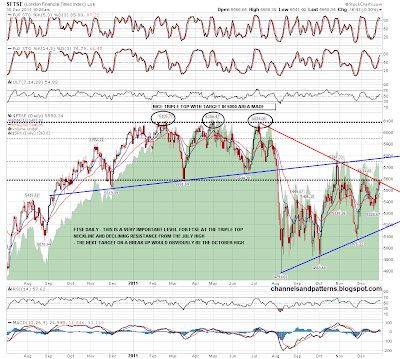
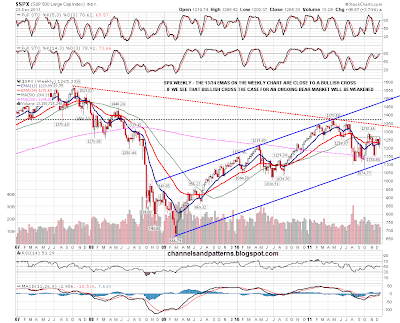
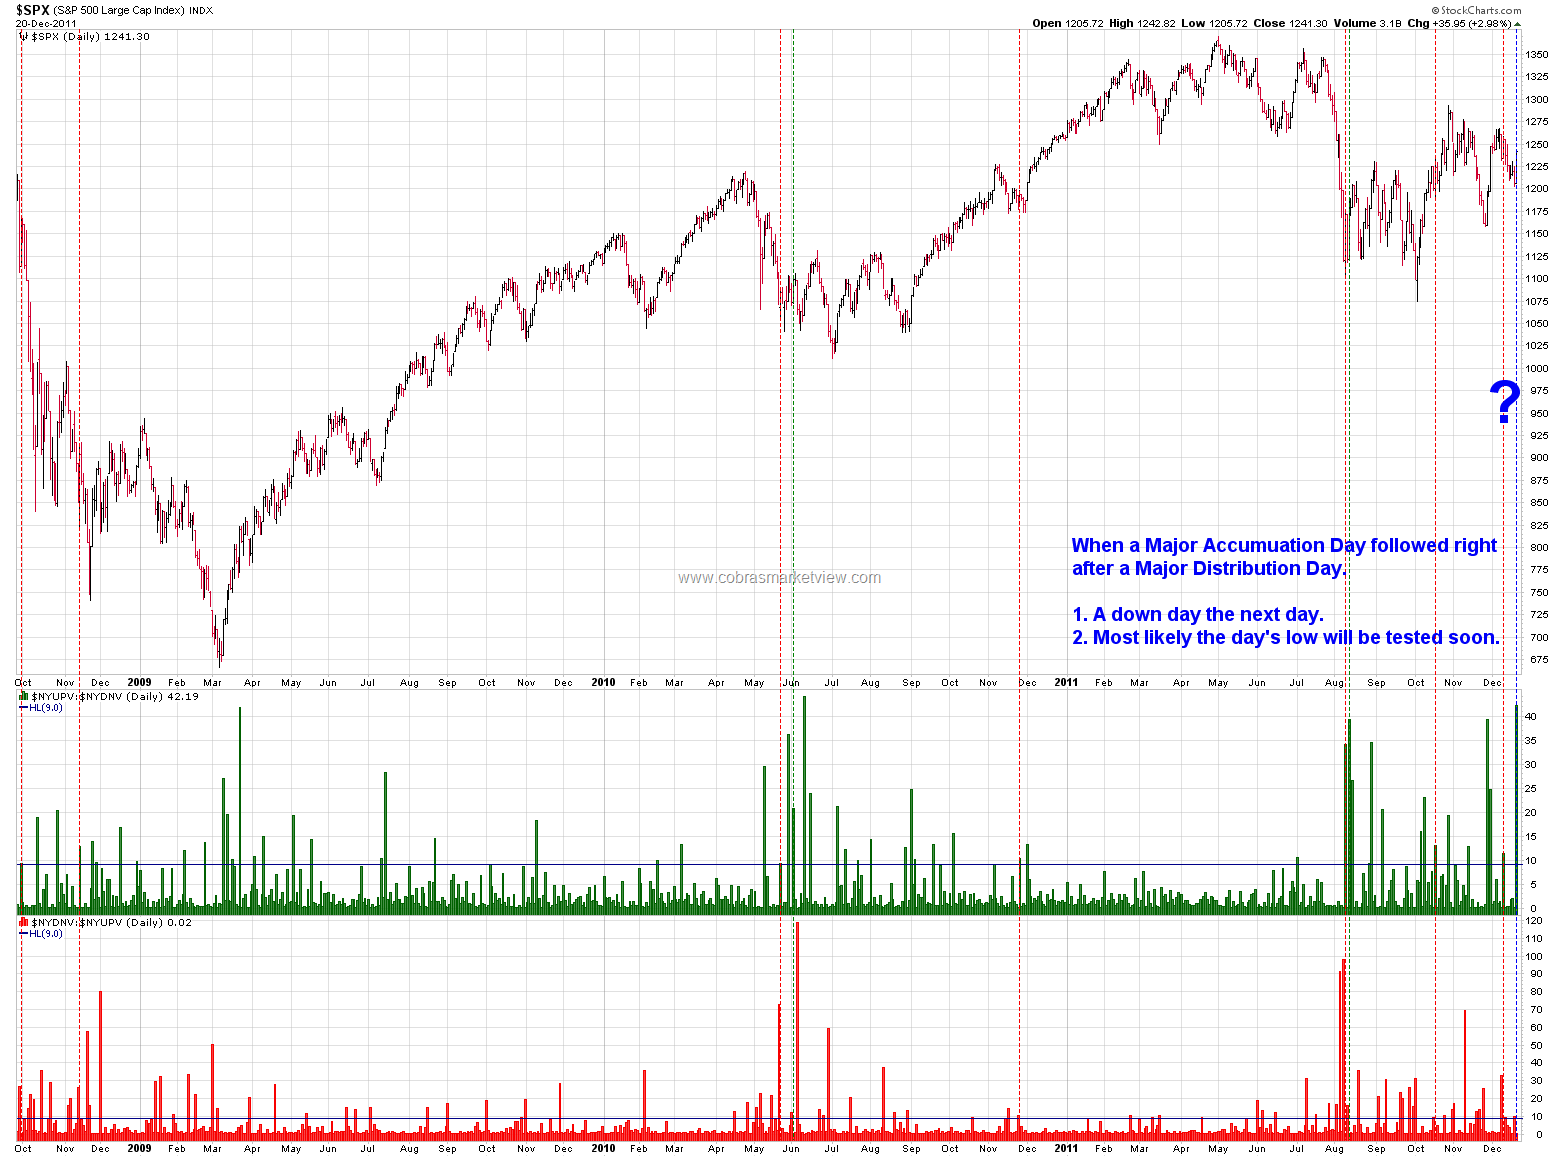
Alphahorn. Both of them are seeing the 1257 level as the next really important resistance level, and that fits with the 1257-60 SPX level that I've been talking about. I have done another SPX daily chart showing the importance of this area, with the breakeven level on SPX for 2011 at 1257, and declining resistance from July and the daily 200 SMA in the 1259/60 area. The daily 200 SMA is a very important bull/bear market dividing line of course, and both attempts to recover above it in October and November were very short-lived:
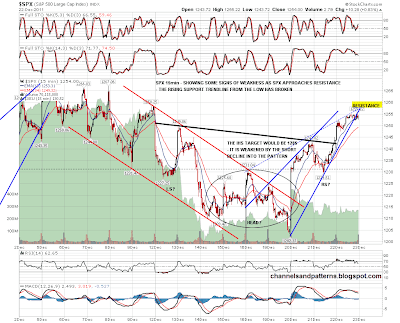
On the SPX 15min chart the move up from the low has the look of a rising wedge so far and that is suggesting that 1257/60 resistance will be a tough nut to crack this week. I've also added a possible IHS to the chart, though I don't like it particularly as the decline into it is short:
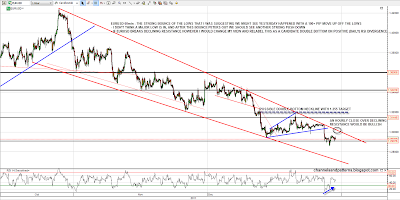
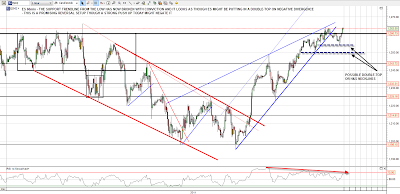
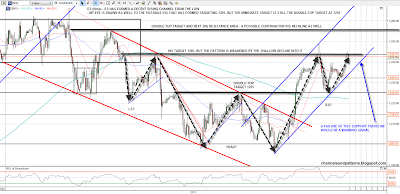
On the ES chart the move has been within a perfect rising channel. I've also added the stronger looking IHS there, though the decline into it is obviously still short, and the double-top target at 1255, which is very slightly above my 1257-60 SPX resistance zone. This chart is worth looking at closely as there's a lot of information on it:
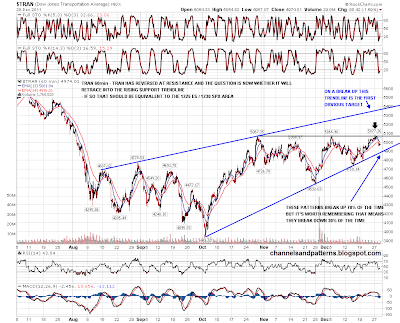
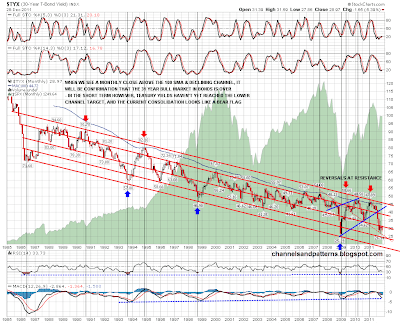
The support trendline from October that I was looking at on ZN (10yr treasury futures) has now broken down, which looks bearish for bonds and bullish for equities. On ZB however (30yr treasury futures) that trendline is still intact and may get tested today at the intersection with the strong support level at 142'25. One to watch:
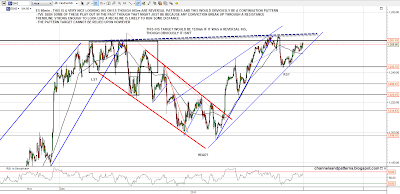
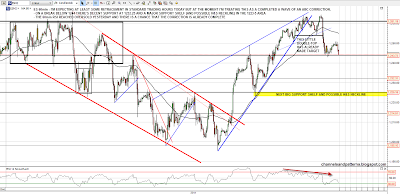
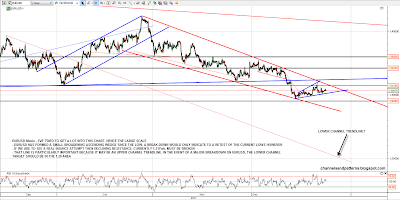
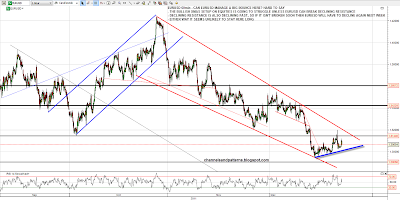
The other important trendline to watch is declining resistance on EURUSD, which was conspicuously weak yesterday. There is obviously a potentially very bullish setup brewing here on equities but it's hard to see that happening without EURUSD breaking up. We'll see. Declining resistance is declining fast, so either way EURUSD can't stay at this level into next week without breaking declining resistance:
If EURUSD can bounce here, the beautifully classical reversal setup on GBPUSD should then play out. I'll be watching that carefully:
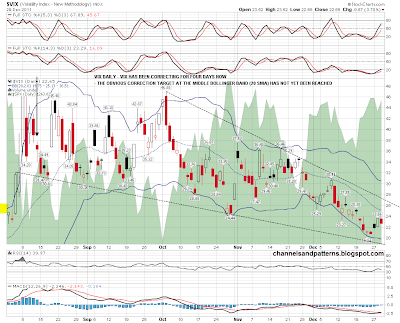
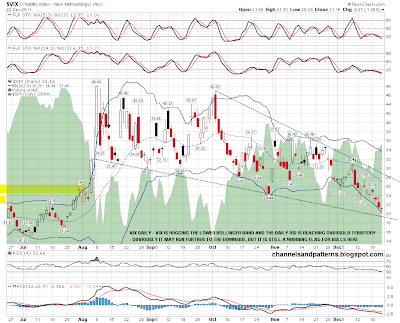
There are a number of reasons to think however that even if resistance in the 1257-60 SPX area breaks, that we may see a sharp pullback next week in any case. One key reason is the Vix, which touched the lower bollinger band yesterday, reaching a level not seen since August. This is a very high level of complacency that suggests that the next interim top will arrive soon. It is a strong reason to be a nervous long here:
There is something I wanted to mention today as a possibility to consider, and that is the potential implications  of the European LTRO program. This program is pumping 489bn Euros of freshly minted digital money from the ECB into European banks for 3 years at a rate of 1% per annum, with the intention that much of that money will be used to buy EU sovereign debt for a sort of carry trade. As EU sovereign debt is (laughably) considered risk-free on the balance sheets of European banks, this will allow European banks a capital and provision-free carry trade return on EU sovereign debt over this period, at the obvious risk that they will be exposed to potentially huge capital losses in the event that those sovereigns later default.

If this program succeeds in its intention, then it might have an effect comparable to QE2 in Europe, and might even create a situation where the Euro falls while equities rise, as QE1 and QE2 did for USD, with those programs effectively having effectively devalued USD with a wave of new money. Something to watch.

I'm a member of several subscription sites, which I use to broaden my view of the market and give me other perspectives as well as potential trades. One of those subscription sites is that of my friend Alphahorn, who has been a blogger friend of mine since early 2009. Alphahorn uses EW and a number of his own custom charts and indicators to call market direction, and has been calling the turns very well indeed this year. He started a portfolio on 4/1/2011, publicly recording his trades, with the stated intention of making a return of 70% by the end of the year, and it is up 73% since then at the moment. That is a simply amazing return and he is one of the canniest chartist traders that I have ever come across. I know a lot of people don't believe in joining subscription sites but I'm just sayin'.

For today I'd expect to see the channel support trendline on ES hold and would be concerned if it doesn't. As long as it holds then I'll be expecting a test of the 1257-60 SPX area today or tomorrow. Whether that level holds or folds we'll probably still see a sharp reversal shortly after that. If that reversal comes after an hourly close much above 1260, then I'd expect more upside after the reversal.

Wednesday 21 December 2011

Big Trendlines

Well that was a face-ripper rally yesterday, and it isn't that often that you see a major distribution day followed by a major accumulation day. We do see that often enough however to compile statistics on performance afterwards, and as my friend Cobra points out, the chances of a down day today are very high. Here's Cobra's chart on this from last night below, and you can see his full post here:
There is an obvious target for this move down on ES, and that target is 1225, for a retest of the double-bottom base / neckline that broke yesterday and a hit of rising support from the low. That prediction looked bolder as I capped the chart earlier, but as I write this I see that ES is now at 1230.5, so 1225 isn't far away now. After today I'm expecting ES to make, or at least get close to, the double-bottom target at 1255 ES that I gave yesterday:
I'm qualifying that target slightly because the obvious first big upside resistance here on SPX is slightly lower than that ES target. That upside resistance is the zone between 1257 SPX, which is the break-even level for SPX in 2011, and the 1260 area, which is strong declining resistance from the July high on SPX. If that breaks, which I think it might, then the next resistance area is at main declining resistance from the 2011 high in the 1310-15 area. This chart has a lot of information on it so it's worth having a closer look. I have also mentioned the big sloping IHS that a lot of analysts have been talking about. I've been watching it too, but it would not be a reversal IHS, so the upside target (new highs) isn't high probability:
That SPX trendline is the first big trendline to look at today. The second is rising wedge support on UUP, the dollar bullish ETF, which was tested yesterday and would look very significant on a break down:
If we saw that break down on UUP then a break up through declining resistance on EURUSD shouldn't be far behind. That wasn't quite reached overnight:
Supporting those breaks would be the beautifully classical double-bottom I posted on GBPUSD yesterday. That hasn't broken the pattern base or neckline yet, but would target a big move back to 1.613 if it does:
I post charts on ZB, 30yr Treasury futures very regularly here, but I don't often post charts for ZB's little brother ZN, 10yr Treasury futures. I posted one of those on twitter yesterday after a trading buddy of mine, George Cavaligos of www.nakedtrader.com suggested I have a look at it. Here is that chart I posted yesterday:
Here is the updated chart, and you can see that the rising wedge has broken, and that main rising support has been pinocchioed overnight. I think that rising support from the October low is going to break in the next few days and I have put the downside targets after that break on the chart. If I'm right then that should support a move on SPX back up into the 1300-20 area over the next two or three weeks:
So far, so bullish, but there is a potential fly in the ointment here for the bulls and that is the Vix chart. I was commenting yesterday that the Vix setup was one that I would associate with an equities high rather than an equities low. That is even more the case today and if we see equities move up much further, then we may see Vix close below the daily bollinger bands. That would be a huge red flag warning of a very significant high then or shortly afterwards:
Overall I'm expecting to see some retracement today followed by a powerful move up for the rest of the week as this belated Santa Rally shows us what it can do.

Tuesday 20 December 2011

Distant Sleigh Bells

No post yesterday as my futures and forex charting package was down. The question today is whether Santa is going to show up for a rally this year, as we're running out of time now. There is definitely some reason to think that we might have made a significant low yesterday, as ES put in a slightly lower low, on positive divergence, and we now have a very nice double or W bottom setup there which would target 1255 ES on a break over 1225:
There is a similar setup on GBPUSD, though that's a bit bigger:
EURUSD looks weaker, as you'd expect really, but there's definitely room for more bounce within the greater move down:
My concern is that there is an obvious downside target on SPX here, and we haven't reached it yet. That target is rising support from the October low in the 1190-5 area, and a touch and reversal there would confirm that a triangle is forming on the SPX daily chart:
On the SPX 15min chart we have a clear declining channel, with channel resistance in the 1218 area at the moment:
There's a similar declining channel on RUT, with channel resistance in the 726 area at the moment:
For direction today I'm watching the short term trendlines on the ES 15min chart. A break above declining resistance from 1225 would look bullish, and a break below rising support from yesterday's low, currently at 1206, would suggest another move down:
Is there room for another big move down here? Well there certainly is on the Vix, which is the strangest chart that I am watching at the moment. Here it is on the daily chart with bollinger bands, showing a setup I'd normally associate with topping out after a move up on equities. In effect the inverse correlation between Vix and equities seems to have reversed at the moment, which is strange indeed:
What I'd like to see here is a break of resistance on equities that should then be followed by a modest Santa rally. That would set up what should be some very nice short opportunities in the New Year. That looks promising at the moment but equities need a boost into the open. I'll be watching that ES 15min chart for direction.