- WE'RE JUST RANDOM SPECKS OF DUST IN A TORNADO TO THE MARKETS .......
- CHARTISTS MUST PUT ALL BIAS ASIDE AND LET THE CHARTS DO THE TALKING OR WE'LL SEE ONLY WHAT WE WANT TO SEE
- This blog has a copy of all header posts that I publish anywhere, so that those interested in seeing what my thoughts are on the markets can find them easily.
- I will be answering questions and responding to comments, so feel free to respond to any posts and I will see your comment even if it is not on the most recent post.
- If you're interested in seeing any intraday charts I post, I do that on twitter, and my twitter handle is @shjackcharts.
- The charts in the posts are as large as I can practically make them. if you would like to look at one more closely, click on it, and the link will take you to a larger version at screencast. If you click on that again, you will get a full page version, and can use the resizing function on your browser to enlarge parts of interest further.

Friday 30 September 2022

Testing The 2022 Low

Last week I was looking for a new low on SPX for 2022 and we've seen that week. I was also wondering about a possible rally after that and SPX has been setting up nicely for that rally, even with news this week that has mainly been grim. Nonetheless it is a decent looking setup for a rally here, so I'll have a look both at that and the obvious next target below in the event that this rally setup fails.

On the rally prospects side the new low and retest of that low has created a very decent quality potential double bottom setup that using the lows at the time of writing would look for the 3850 area on a sustained break over 3736.74. The retest has also set up positive divergence on the daily RSI 14 and RSI 5. Given that there is similar divergence on NDX and still an open hourly RSI 14 buy signal fixed, that is a lot of potential and actual support for a rally here.

On the downside, if SPX breaks and converts 3600 next then the next obvious target would be falling channel support, currently in the 3390 area. If seen, I'd be looking for a strong rally there.

SPX daily chart:

SPX hasn't touched the daily lower band for three days, though each daily low hasn't been far away so far. The daily lower band ride may well be ending and, if so, the obvious rally target would be the daily middle band. That is currently at 3847, currently a strong match with the possible double bottom setup here. The daily lower band is now at 3560, with the 3sd lower band now at 3417, so if we see a break down here, there is a now a lot of room to the downside.

SPX daily BBs chart:

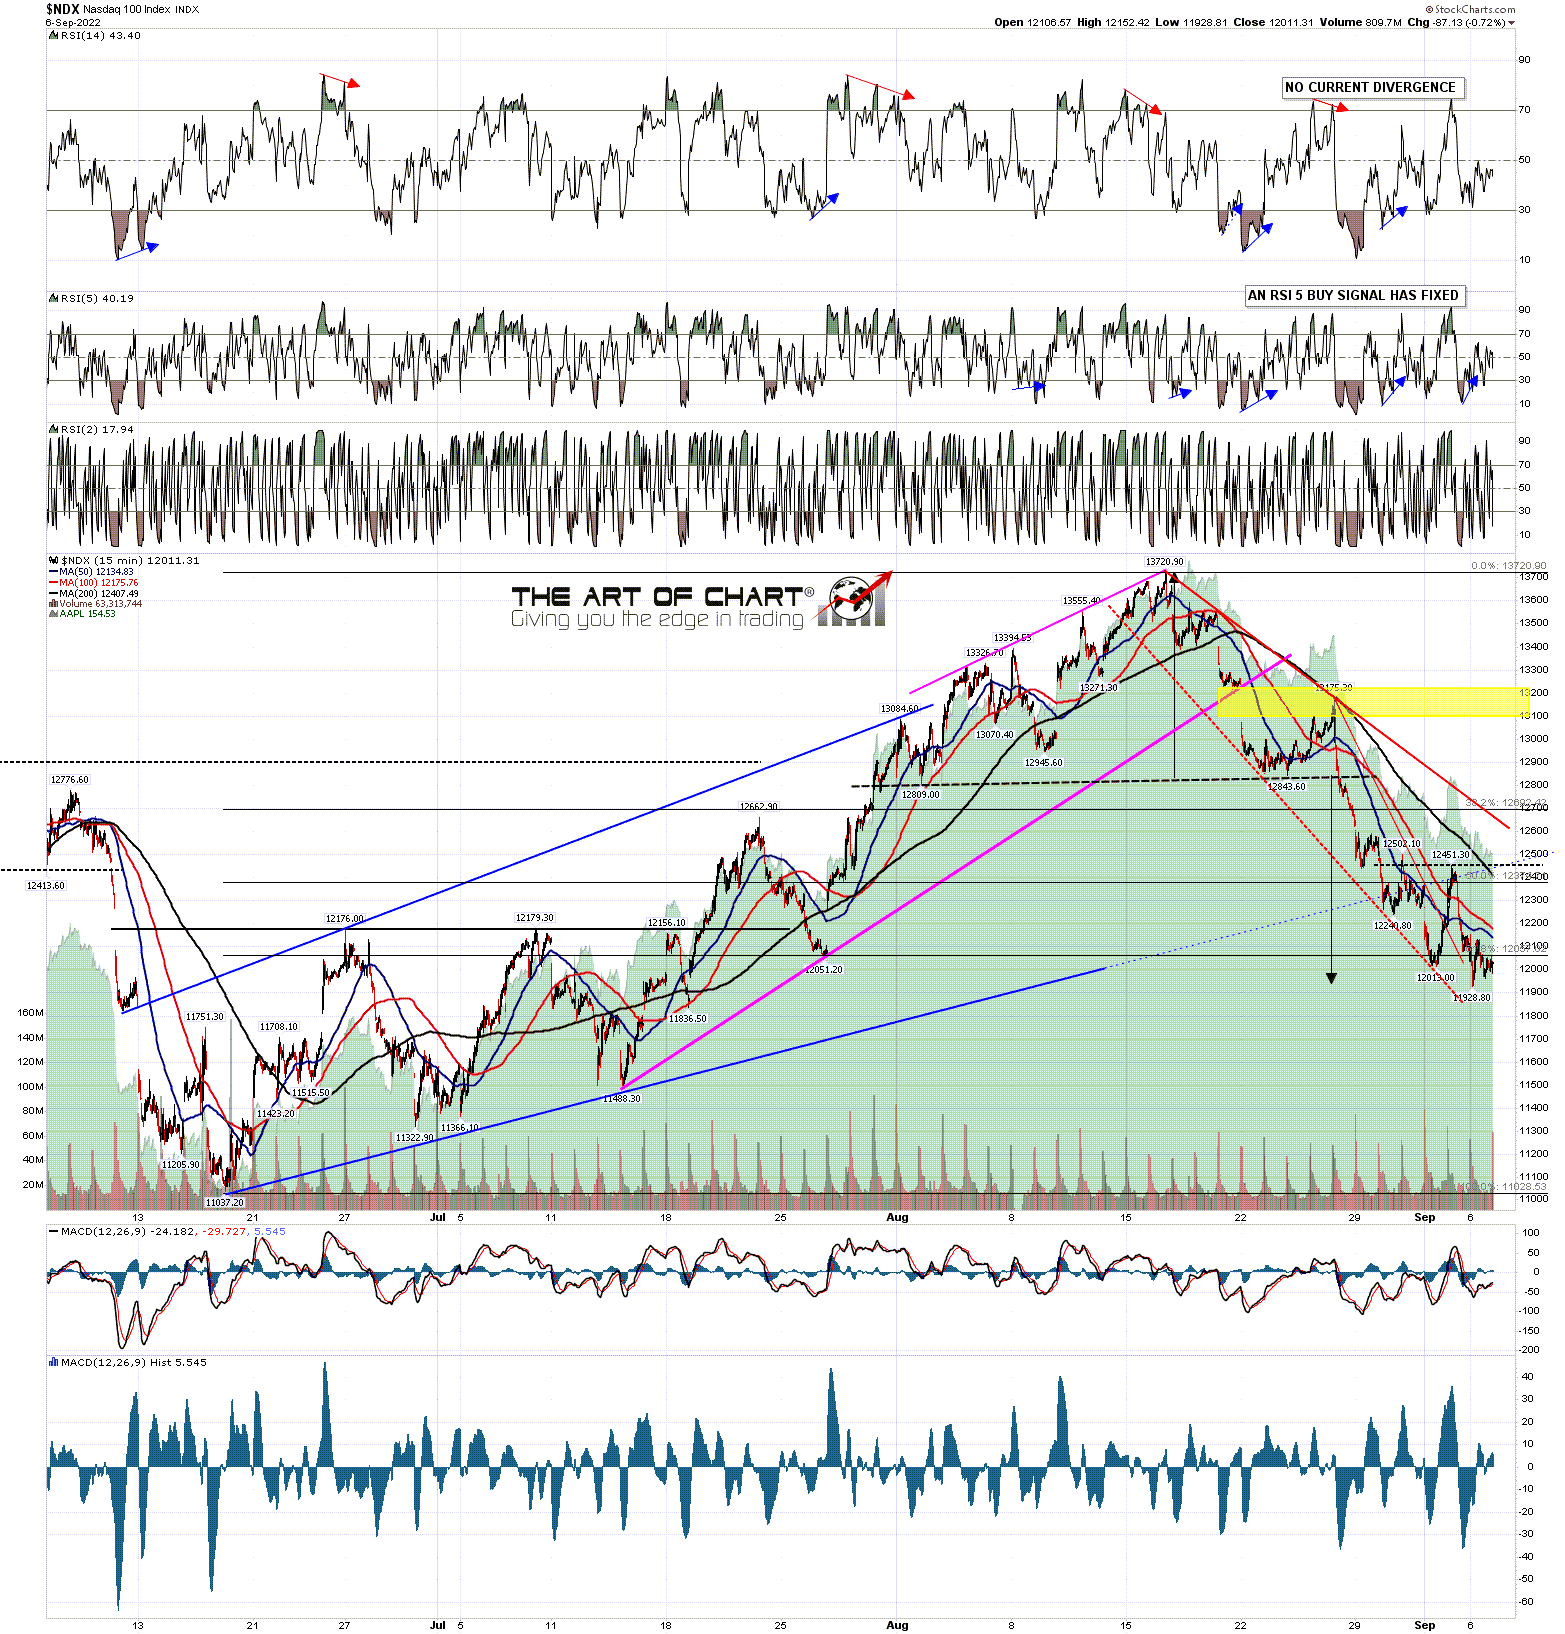
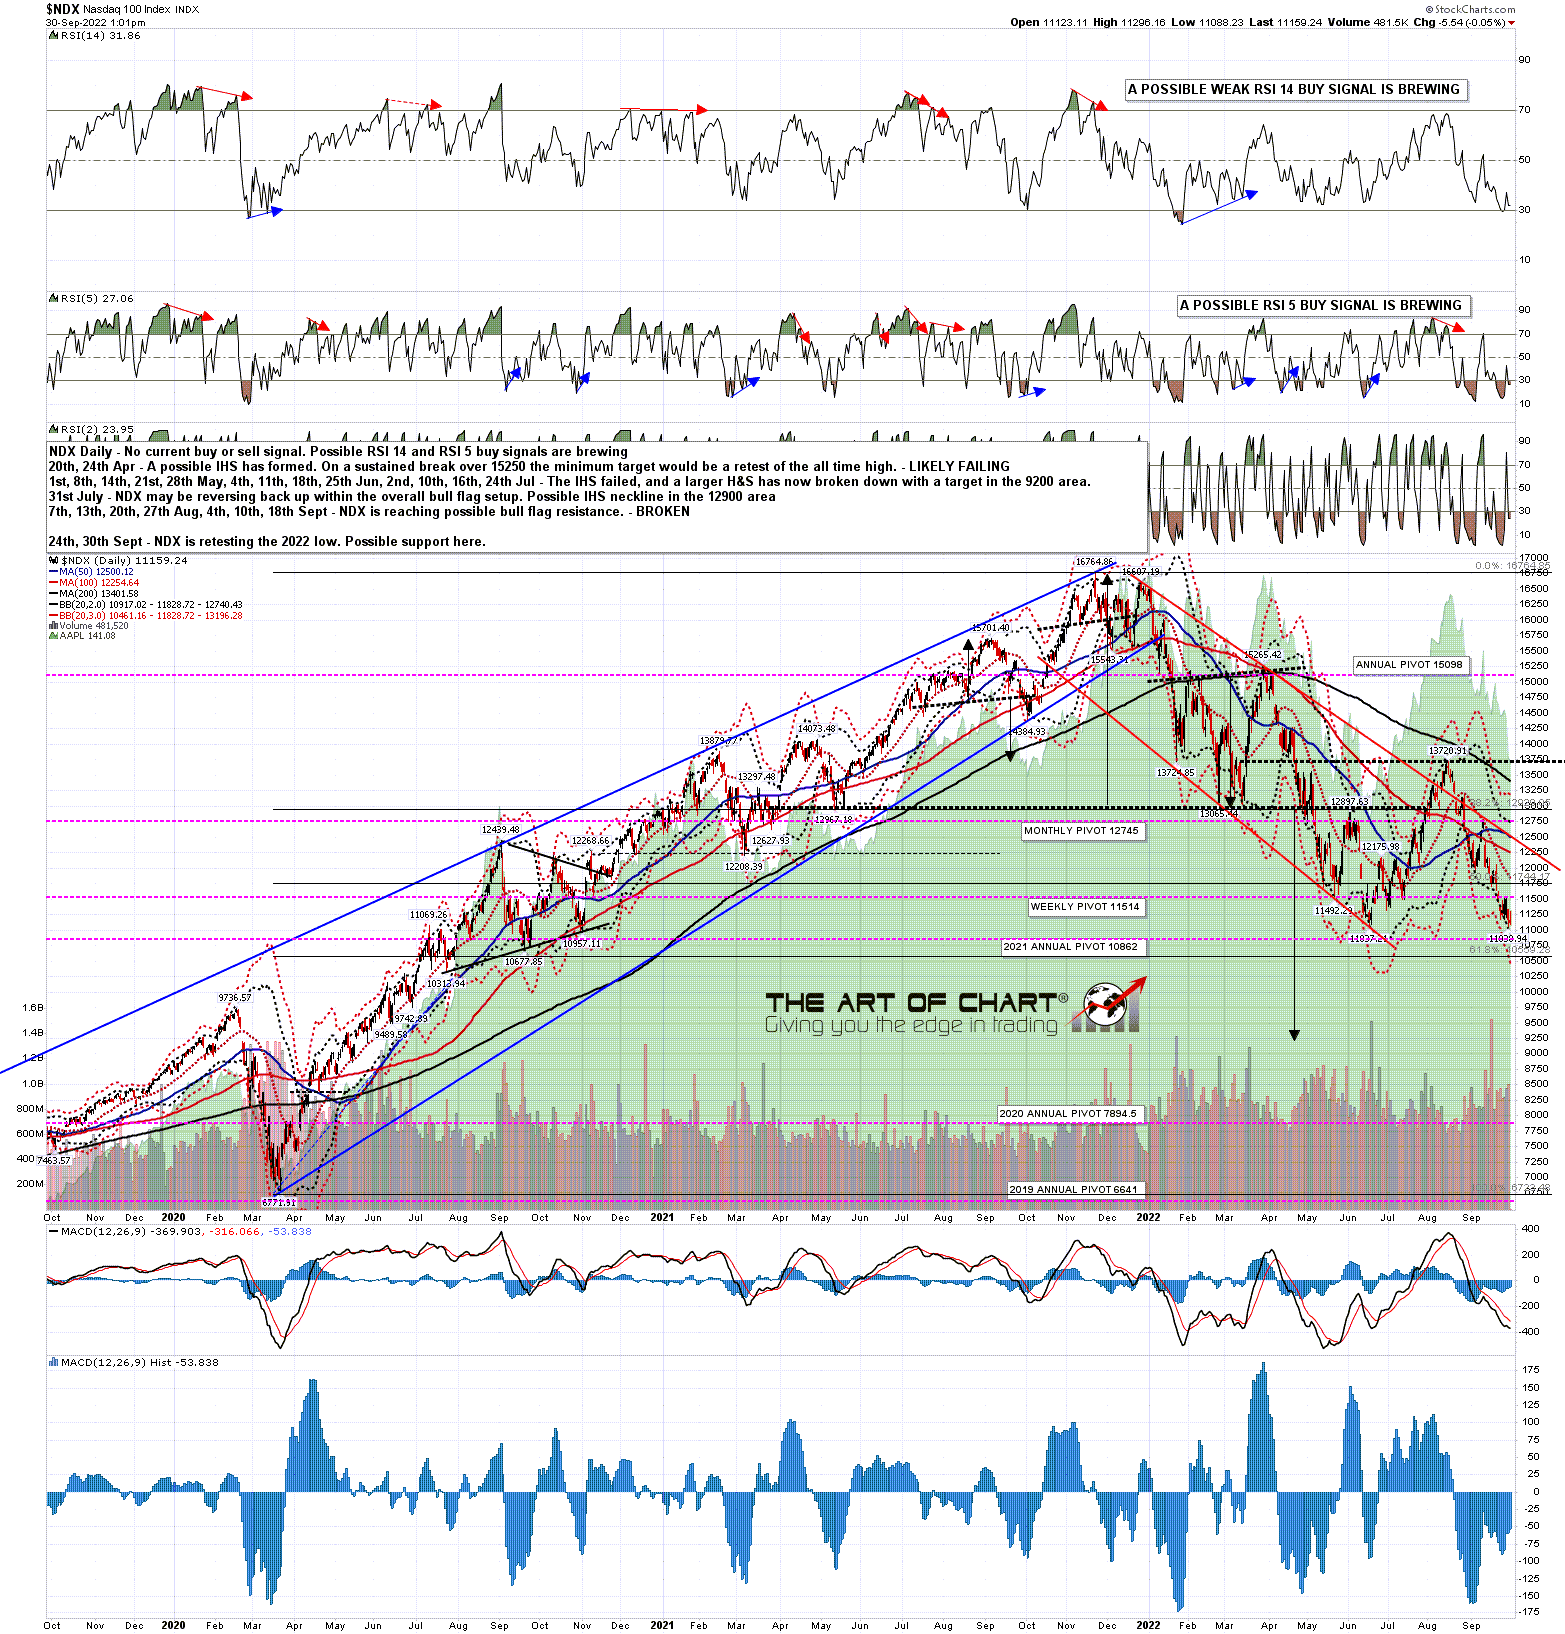
I've looked hard, but there is no corresponding channel on NDX. The existing high quality support trendline would now be in the 9500 area.

NDX daily chart:

On the hourly chart I really like the strong short term support trendline from the 4325 high, and I think that has a decent shot of holding. If so that is supportive of a rally here.

SPX 60min chart:

If we are going to see a decent rally here on SPX then the next step would be a break over short term declining resistance now in the 3715 area. If seen the obvious next target for this rally would be declining resistance from the 4325 high. That is now in the 3950 area which looks a bit high, but that is a declining trendline of course.

SPX 15min chart:

I'm keeping an open mind on a rally here. The setup is nice but the news is grim and a strong enough trend will run over divergence and reversal setups. We'll see soon enough whether that is the case here.

As of last weekend our Follow The Leader service at theartofchart.net was up 153% year to date with 90% winners so far. This is an autotrading service in partnership with GFF Brokers, official broker for the World Cup Advisor Auto Trade programs.  This is included in our Daily Video Service and if you're interested in that you can find out more about that here, and you can try a 30 day free trial at theartofchart.net here.

Our monthly free public webinar on Big Five and Key Sector ETFs at theartofchart.net was delayed a week so that is now after the close next Thursday and if you'd like to see that you can register for that here or on our October free webinars page.

My next post should be on Monday or Tuesday before the open. Everyone have a great weekend. :-)

Friday 23 September 2022

Approaching The Low Retest

I was saying in my premarket video on Monday morning that ideally what we would see this week is a rally on Mon/Tues, and then another leg down on Wednesday through Monday next week in line with the very bearish historical stats for these four days. So far that has delivered well, with FOMC on Wednesday delivering the next leg down I was looking for. If you'd like to hear that premarket video every morning that is included in our Daily Update Service and you can get a 30 day free trial here.

On Friday last week I was looking for a test of the daily lower band on SPX. That was hit on Wednesday and yesterday, so there is a possible daily lower band ride starting. The downtrend is strong and at the moment there is no meaningful positive divergence on the US indices that I follow. The 2022 low is at 3636.87, and that is likely to be testing within days.

SPX BBs chart:

SPX hit yesterday the possible target trendline I drew after the rally high at 4119 and that held for a couple of hours before breaking slightly. Overnight that is looking likely to break hard this morning and there is no positive divergence on the hourly or 15min charts, so once SPX breaks and converts 3700 the retest of the 2022 low at 3636.87 is the next big level.

SPX 60min chart:

On NDX the target trendline I drew is now in the 11175 area. That may well be hit this morning too and is possible support. If broken, or hit next week, the retest of the 2022 low is at 11037.20.

NDX 15min chart:

On IWM the target trendline I drew is now in the 169.50 area. That may well be hit this morning too and is possible support. If broken, or hit next week, the retest of the 2022 low is at 162.78.

IWM 15min chart:

On Dow the target trendline I drew is now in the 29650 area. That may well be hit this morning too and is possible support. If broken, or hit next week, the retest of the 2022 low is in that area. Dow would likely be the first index to reach that.

INDU 15min chart:

This has been a strong trend down, and if 3700 SPX can be broken and converted to resistance, I'd expect to see a new low on SPX for 2022 today or Monday. The daily lower band closed yesterday at 3753 with the 3sd lower band closing at 3650.74 so as both should be lower at the open, the 2022 low retest is in range today without a break of the daily 3sd lower band. If we hit the 3sd lower band today or Monday that would be a good indicator for a possible strong rally.

Today is Friday, and those usually aren't that exciting, so we may see a rally attempt today. If not, then we may well see a new low for 2022 today, with a decent chance of at least a decent rally after that low retest. If we don't see that today then we likely see that on Monday.

We did a trading commodities webinar yesterday and gave the usual three trade setups and designs. If you missed that you can see that here or on our September Free Webinars page. We are doing our monthly free public webinar at theartofchart.net on the Big Five and Key Sectors after the close next Thursday and if you'd like to see that you can register for that here or on the free webinars page.

My next post should be on Monday before the open. Everyone have a great weekend. :-)

Friday 16 September 2022

The Downside Is Strong In This One

I was saying in my post on Monday that a fail at the test of the daily middle band generally happens in one of two ways. The first way is the usual test and fail, and the second is a break above that is rejected the next day. Obviously SPX took the second option and delivered a memorable rejection candle. That was bearish with an obvious minimum target at a retest of the daily lower band, which closed yesterday at 3823. I'm expecting that target to be reached, and likely lower. A retest in the next few weeks of the 2022 low at 3636.87 is now firmly on the table as my primary scenario.

SPX BBs chart:

On the SPX chart there was a decent quality double bottom that formed and broke up on Wednesday afternoon, but rejected back into a lower low. On Thursday there was a really nice double bottom option looking for a backtest of the 4000 area, supported by a lot of 15min and hourly buy signals across the US indices and futures. That too broke up and then rejected into back into a lower low. This downside move has shown a lot of strength in those two rejections and I think the next real support is likely to be in the 3800 area.

In the short term SPX in still on a 15min buy signal and the best looking support trendline option is now in the 3790-3800 area.

SPX 15min chart:

On the NDX chart the best looking support trendline option is now in the 11500 area.

NDX 15min chart:

On the IWM chart the best looking support trendline option is now in the 173 area. That may be hard to reach on this move as IWM has held up the best of the US indices so far this week.

IWM 15min chart:

On the Dow chart the best looking support trendline option is now in the 30150 area.

INDU 15min chart:

It is opex Friday today so the market often doesn't move much after lunch. The positive divergence here is telling us that we could see a rally soon, but the failure to sustain a rally on either Wednesday afternoon and yesterday suggest that SPX will be testing 3800 before there is another serious attempt at a rally.

The historical stats for next week lean neutral on Monday and Tuesday and then there is are four consecutive trading days from Wednesday 21st September through Monday 26th September which all lean significantly bearish. Ideally therefore we would see the next rally Mon/Tues next week and then another leg down after that. I'm expecting to see a retest of the 2022 low at 3636.87 in the next few weeks, and that might well be sooner rather than later.

My next post should be on Monday before the open. Everyone have a great weekend. :-)

Monday 12 September 2022

Halfway Between The Gutter And The Stars

SPX rallied further on Friday to test the monthly pivot at 4078, and has been trading above it overnight. A string of decent quality double bottoms have broken up on the equity indices and if we are to see further upside then the next big resistance on SPX is at the daily middle band which closed on Friday in the 4108 area. This brings us to a big inflection point that should determine direction for the next few weeks.

On the bear side the daily middle band should hold as resistance. That can either happen with a fail directly at or under the daily middle band, or with a break above it that fails to follow through to convert it back to support. That would normally be delivered with a clear break above it that then rejects back below it the following day.

On the bull side the daily middle band needs to be broken and converted back to support, which would open up a possible move to retest the rally high at 4325.20, and perhaps then higher, as if that retest is reached all of the decent looking bull flag setups from the all time highs would then have broken up, opening up a possible retest of the all time highs on equity indices.

Is that all time high retest possible on equity indices in this economic environment? Well SPX really does like to retest highs and lows, and with inflation and bond yields where they are, effectively leaving bonds at significantly negative real interest rates and extremely unattractive as any kind of hedge against inflation, perhaps that might be enough to deliver a high retest, though, if seen at all, I'd be doubtful about seeing much more than that.

I can say that we have seen some really crazy things happen on the markets over the last thirty years and I don't think an all time high retest here would be the craziest. We'll see. As ever I'll be led by the charts as being an armchair economist has rarely been much use forecasting short or medium term moves on the markets.

SPX daily chart:

On the SPX chart a double bottom has broken up with alternate targets in the 4130 and 4155 areas. A 15min RSI 14 sell signal has fixed though that may or may not deliver some retracement today.

SPX 15min chart:

On the NDX chart a double bottom has broken up with alternate targets in the 12880 and 12970 areas. A 15min RSI 14 sell signal has fixed though that may or may not deliver some retracement today.

NDX 15min chart:

On the IWM chart a double bottom has broken up with alternate targets in the 189.5 and 190.7 areas. A 15min RSI 14 sell signal has fixed though that may or may not deliver some retracement today.

IWM 15min chart:

On the Dow chart a double bottom has broken up with alternate targets in the 32890 and 33080 areas. A 15min RSI 14 sell signal has fixed though that may or may not deliver some retracement today.

INDU 15min chart:

Historical stats this week lean 71.4% bullish both today and tomorrow, neutral on Wednesday and Thursday this week and Friday this week also leaning 71.4% bullish into Opex. As a group this is one of the most bullish leaning trading weeks of the year, though not so much on NDX in recent years. In a strong trend down that wouldn't matter much but in the absence of that we could see a decent move up into the end of next week.

In the short term we have those solid looking double bottom setups breaking up on SPX, NDX, IWM and Dow so we'll see how those fare today.

We are did our monthly free public Chart Chat at theartofchart.net yesterday and if you missed it you can see that here or on our September Free Webinars page.

My next post should be on Friday before the open.

Friday 9 September 2022

Back On The Three Day Rule

I was saying on Wednesday morning that the most important short term resistance was the 5dma, and we saw a break back over the 5dma at the close on Wednesday, so that put SPX back on the Three Day Rule. That means that in the event of a clear visual break (3 to 5 handles) back below the 5dma on either of the next two trading days, in this case yesterday or today, then SPX should retest the last low at 3886.75 before any retest of the prior high at 4325.28.

I was asked about this stat this week and I was looking back at it. The stat goes back to the start of 2007, I think because I first looked at it in 2012 and went back five years. After a fail and small tweak of the rules in 2019, on the revised basis this has delivered every time over the last almost thirteen years apart from two very marginal higher lows when triangles were forming that broke up to deliver significant lows. This stat is going to fail sometime but that must be somewhere between 150 and 200 Three Day Rule fixes over the period that all made target. I have never seen a market stat as reliable as this one has been.

The 5dma closed at 3957 yesterday and will likely close a bit higher today. A clear break back below it today would very likely deliver a retest of the last low at 3886.75.

SPX daily 5dma chart:

SPX has now clearly come off the daily lower band and may be heading back up to the the daily middle band, currently at 4115. Short term resistance for today is a break and conversion of short term double bottom resistance at 4018.43, the 45dma at 4048, and declining resistance now in the 4055 area. A break and conversion of 4018.43 looks for a target in the 4133-50 area.

SPX daily BBs chart:

The economic news has been pretty dire, and despite all the decent looking bull flags that have formed since the all time highs on equities I obviously have serious doubts about whether those retests are doable, but if SPX can break and convert the daily middle band back to support then they are at least still the table as a possibility and, so far at least, that important support in the 3900 area is still holding.

Rather than show you the updated short term double bottoms that are starting to break up here, as they are mostly on my last post in any case, I thought I'd close today showing you some of the most bullish looking charts on the sector indices that I  cover at theartofchart.net.

The most bullish is at IBB (biotech), where the obvious interpretation for this latest retracement is that the right shoulder on a larger IHS is forming. A sustained break up over the neckline in the 135 area would look for a target in the 165 area, effectively opening a retest of the all time high at 176.99. This may not deliver but it is a beautiful setup and pattern.

IBB daily chart:

On IYR (real estate) the setup is more ambiguous, but there is a lovely bull flag from the all time high with the obvious next target within the flag in the 108.8 area. A short term H&S has broken down but may be failing, and if it fails that should deliver a retest of the rally high at 103.36. If seen we may well see that test of main bull flag resistance and IYR would already have rallied most of the way back to the all time high retest.

IYR daily chart:

XLE (energy) has an IHS that has already broken up towards a retest of the 2022 high at 92.28, and a smaller H&S that has since formed and broken down. I'm expecting the small H&S to fail back to the recent high at 85.18 and after that I think there is a very good chance of a retest of the all time high.

XLE daily chart:

Historical stats for the next few days are 61.9% bullish today, with Monday, Tuesday and Friday next week also all leaning 71.4% bullish into Opex. As a group these are one of the most bullish leaning six trading day periods of the year. In a strong trend down that wouldn't matter much but in the absence of that we could see a decent move up into the end of next week.

In the short term we have solid looking double bottom setups breaking up on SPX, NDX, IWM and Dow so we'll see how those far today. As I didn't manage to finish this post before the open I can now see a possible breakaway gap up over double bottom resistance on SPX. If we are going to see a reversal back down today then a fill of the gap from yesterday's close at 4006.18 would be the first serious crack in this short term bullish looking setup.

We are doing our monthly free public Chart Chat at 4pm on Sunday. It should be interesting with equities bonds and USD all at or coming into interesting inflection points here. If you'd like to attend you can register for that here or on our September Free Webinars page.

My next post should be on Monday or Tuesday before the open. Everyone have a great weekend :-)

Wednesday 7 September 2022

Still Testing 3900

The rally from the first backtest of 3900 was over too fast to set up any possible possible divergence on the daily RSIs. That means that there are no possible daily RSI buy signals brewing on the US equity indices, and that is a strike in favor of the bears.

The inflection point here remains the same. The rally could resume from the important support in the 3900 area, or that area could fail into a retest of the 2022 lows.

SPX didn't quite make it to the daily lower band yesterday. That closed the day at 3872 and if the daily lower band ride is not ending then I'd be looking for SPX to make a lower low today and at least try to retest that.

SPX daily BBs chart:

At this point the 5dma, currently at 3948, is the most important short term resistance on SPX, because a clear closing break back above it would put SPX back on the Three Day Rule. If SPX was then to deliver a clear close back below that on either of the two subsequent days, we would then very likely see a retest of the current low, now at 3886.75 but possibly lower before that break up.

SPX daily 5dma chart:

On the SPX 15min chart there is currently a very decent quality double bottom setup here. A sustained break up over 4018.53 would look for the 4150 area. Declining resistance from the rally high is now in the 4090 area.

SPX 15min chart:

On the NDX 15min chart there is also currently a very decent quality double bottom setup here. A sustained break up over 12451.30 would look for the 12900 area. Declining resistance from the rally high is now in the 12650 area. The full H&S target from the rally high has now been reached.

NDX 15min chart:

On the IWM 15min chart there is also currently a very decent quality double bottom setup here. A sustained break up over 183.95 would look for the 199 area. Declining resistance from the rally high is now in the 189 area. The full H&S target from the rally high has now been reached.

IWM 15min chart:

Overall the setup here is leaning somewhat towards a break down, but there is some good news for bulls in the historical stats for the coming week. Historical stats for the next few days are neutral tomorrow and bullish on Friday, which leans 61.9% bullish with Monday, Tuesday and Friday next week also all leaning 71.4% bullish into Opex.

We are doing our monthly free public Chart Chat at 4pm on Sunday. It should be interesting with equities bonds and USD all at or coming into interesting inflection points here. If you'd like to attend you can register for that here or on our September Free Webinars page.

My next post should be on Friday before the open.

Friday 2 September 2022

Testing 3900

The H&S patterns from the rally highs that I was looking at a week ago all made their target areas yesterday and SPX is now testing important support at 3900. This area was significant on the way up in early 2021, and was then key support in May, resistance in June, and was broken as resistance and backtested as support in July.  Bulls need to hold this area if they want to go higher, and bears need to break it hard if they want to retest the 2022 low at 3636.87 and go lower.

Either way I'm expecting to see at least a rally attempt here, and I think that rally started yesterday. On the bull scenario I would be leaning towards a 50% (approximately) retracement back towards the new SPX monthly pivot at 4078, possibly failing at the 50 hour MA, currently at 4053, then a retest of yesterday's low to set up positive divergence on the daily chart and a double bottom setup to retest the rally high, and then the move back to that high at 4325.28, setting up a possible move back to retest the all time highs.

On the bear scenario SPX would retest yesterday's lows, breaking through and converting 3900 to resistance before a move to retest the 2022 low, probably then breaking lower. We will see.

SPX daily chart:

On the SPX chart the full H&S target was made yesterday, reaching the 61.8% retracement area. A decent looking falling wedge has formed on the way down and broke up yesterday afternoon. A possible declining resistance trendline target is now in the 4120 area and declining rapidly.

SPX 15min chart:

On the NDX chart the full H&S target was almost made yesterday, reaching the 61.8% retracement area. A decent looking falling wedge has formed on the way down and broke up yesterday afternoon. A possible declining resistance trendline target is now in the 12820 area and declining rapidly.

NDX 15min chart:

On the IWM chart the full H&S target was almost made yesterday, reaching the 61.8% retracement area. A decent looking falling wedge has formed on the way down and broke up yesterday afternoon. A possible declining resistance trendline target is now in the 191 area and declining rapidly.

IWM 15min chart:

On the Dow chart the full H&S target was made yesterday, reaching the 61.8% retracement area. A decent looking falling wedge has formed on the way down and broke up yesterday afternoon. A possible declining resistance trendline target is now in the 32700 area and declining rapidly.

INDU 15min chart:

What are the prospects of seeing the stock markets retesting the all time highs here? Well the economic news doesn't seem at all encouraging, and the Fed now seems to be remembering that keeping inflation low is an important part of their job. Do I think that a major new bull market started at the current 2022 low as some are saying? No, I think that is very doubtful, and if we do see a retest of the all time highs my lean will be that would likely be the second high of a large double top, preceding another test of the 2022 low and another big inflection point there. SPX does like those high retests though, and the decent looking bull flag setups across the board from the all time highs are saying that those high retests are possible until demonstrated otherwise.

Historical stats for the next few days are neutral until Friday 9th September, which leans 61.9% bullish with Monday, Tuesday and Friday the following week also all leaning 71.4% bullish into Opex.

My next post should be on Monday or Tuesday before the open. Everyone have a great weekend. :-)