- WE'RE JUST RANDOM SPECKS OF DUST IN A TORNADO TO THE MARKETS .......
- CHARTISTS MUST PUT ALL BIAS ASIDE AND LET THE CHARTS DO THE TALKING OR WE'LL SEE ONLY WHAT WE WANT TO SEE
- This blog has a copy of all header posts that I publish anywhere, so that those interested in seeing what my thoughts are on the markets can find them easily.
- I will be answering questions and responding to comments, so feel free to respond to any posts and I will see your comment even if it is not on the most recent post.
- If you're interested in seeing any intraday charts I post, I do that on twitter, and my twitter handle is @shjackcharts.
- The charts in the posts are as large as I can practically make them. if you would like to look at one more closely, click on it, and the link will take you to a larger version at screencast. If you click on that again, you will get a full page version, and can use the resizing function on your browser to enlarge parts of interest further.

Wednesday 22 February 2023

Rallying From Major Support

We saw the breakdown on SPX that I was warning about on my last post, and so far SPX is finding support in the 4000 area, which is the obvious support level as there is an intersection of decent support levels here. There are hourly buy signals fixed overnight on all of the six equity index futures I track on a daily basis and, subject to FOMC today, the pressure to deliver a rally today is strong.

The only support level not yet quite tested is rising wedge support from the 2022 low, and I'm wondering whether that, currently in the 3965 area, might need a test before the rally that we should see here. If we do see a test of that trendline and it holds, then that will open wedge resistance, currently in the 4240 area, as a possible target.

SPX 60min chart:

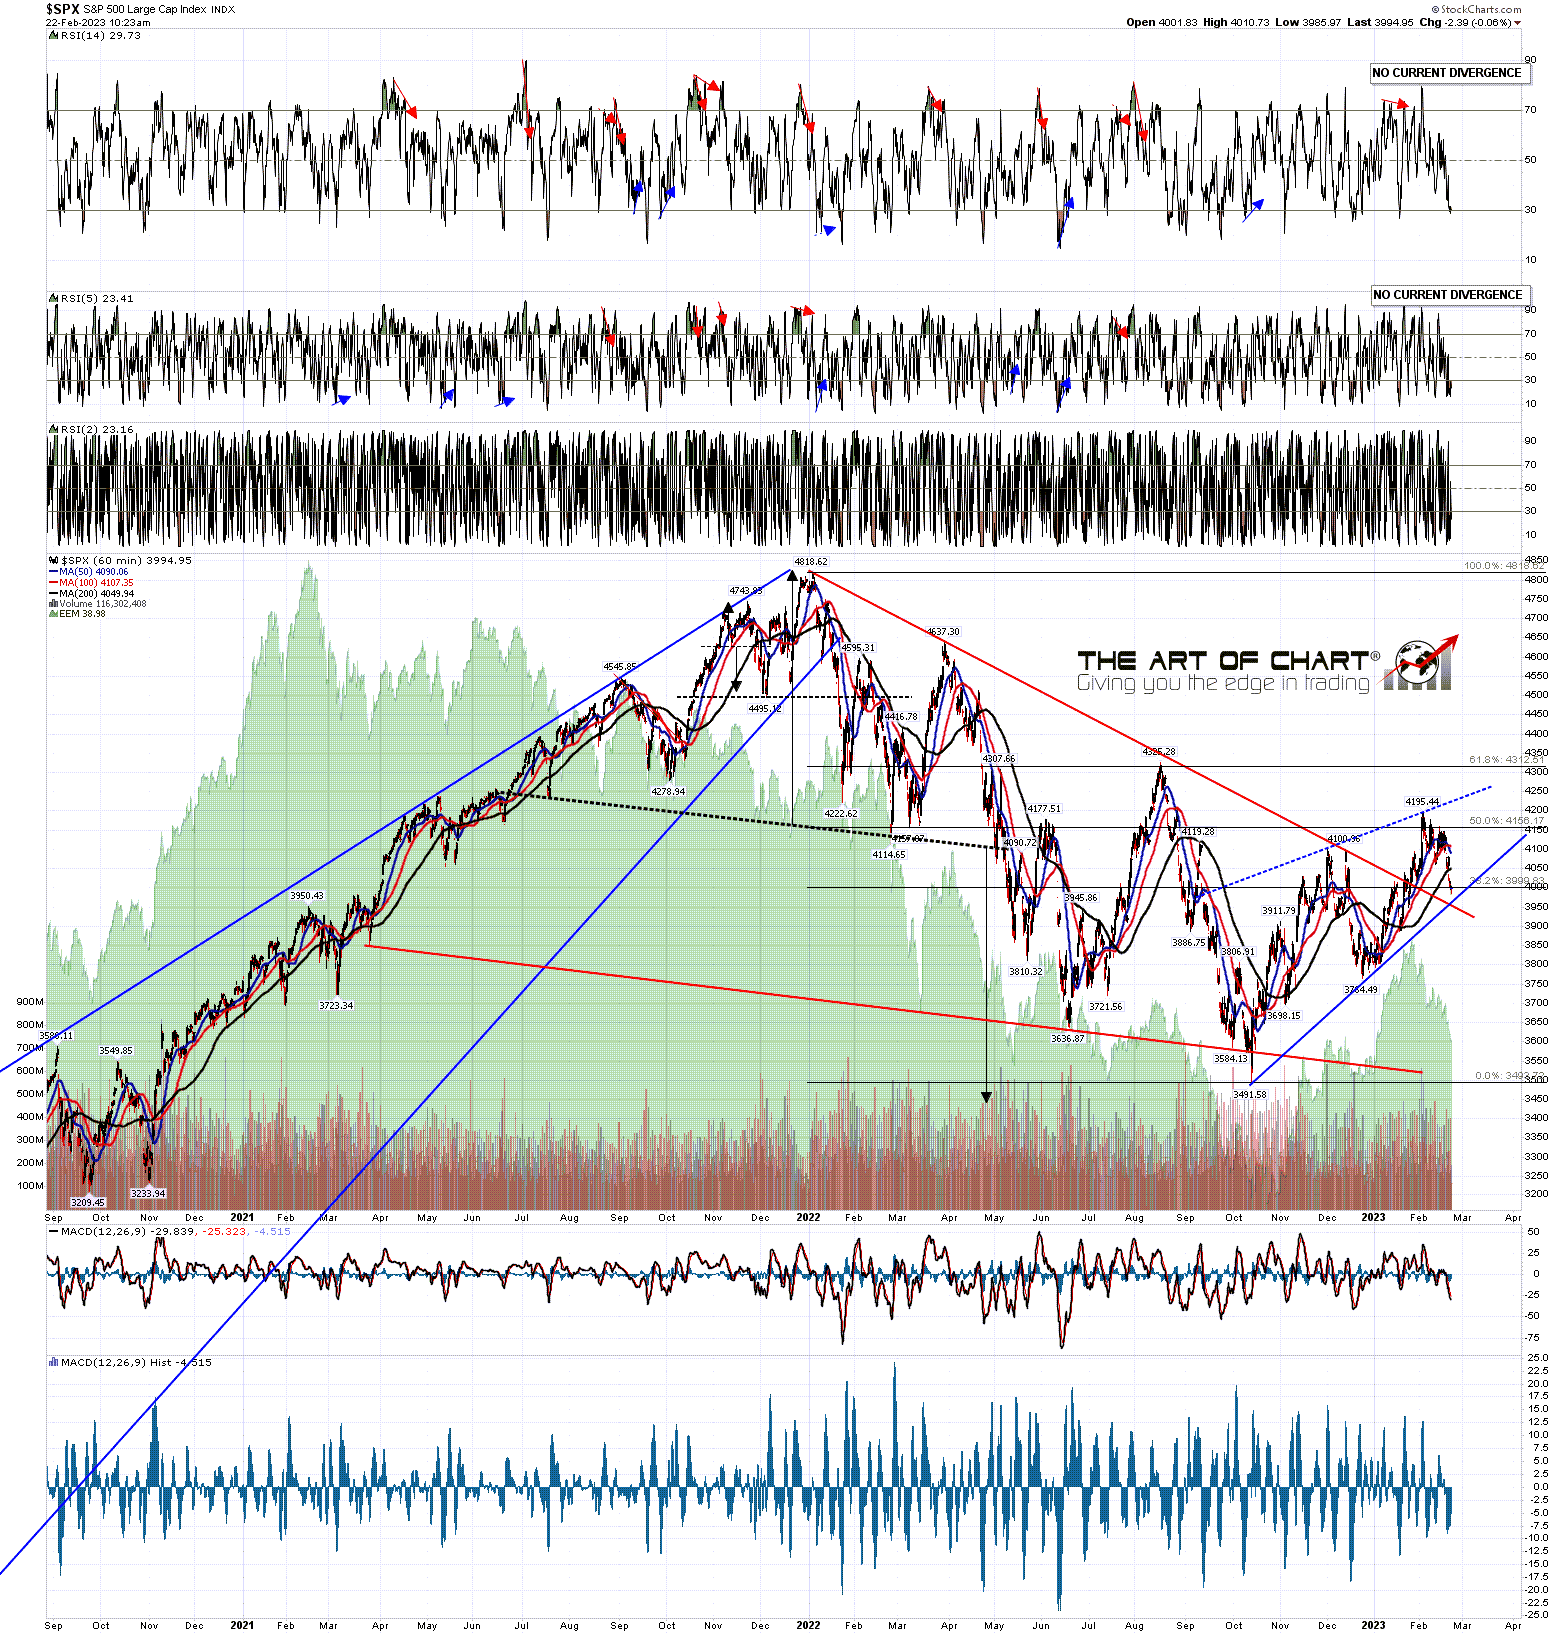
I was talking a lot last year about the 50 week MA, currently in the 4011 area, as key resistance on SPX before it was broken in January. The biggest support level I have been watching on this move down has been that backtest, which is holding well so far. On my bull scenario SPX could start another leg up from this test.

SPX weekly chart:

On the daily chart the daily middle band, now in the 4091 area, was broken on Monday and SPX made it to the daily lower band yesterday. This also makes this an obvious area to rally.

SPX daily BBs chart:

So what is happening here on the bigger picture? Well I'm thinking that decision gets made after this rally, ideally in the SPX 4070-4100 area. This may be an H&S forming on SPX that on a rally to that area, and on a subsequent conviction break below 4000, the target would be in the 3800 area.

However there is a decent case that what we have been watching from the early February highs are a series of bull flags forming  on the equity indices. That case was strengthened yesterday when IWM hit a trendline I drew in a few days ago as the ideal theoretical bull flag wedge support trendline.

IWM 15min chart:

The low on NDX yesterday was equally impressive, establishing a perfect bull flag channel from the 2023 highs.

This morning though that channel broke, leaving me with only one perfect bull flag setup on IWM, though all of the moves on the US equity indices from the 2023 highs have a flaggy look to them in the way they have formed. We will see.

NDX 15min chart:

Subject to FOMC today I am looking for a rally back into the 4070-4100 area on SPX next and then an inflection point where SPX could either break down hard towards the 3800 area, or break up into a retest of the early Feb highs which might then be a double top setting up a retracement back to the same 3800 area.

On the pattern setup this morning I'm thinking that could easily go either way at 4100, so we'll see what, if anything, the Fed might say this week to move the market either way.

If you are enjoying my analysis and would like to see it every day at theartofchart.net, which I co-founded in 2015, you can register for a 30 day free trial here. It is included in the Daily Video Service, which in turn is included in the Triple Play Service.

Monday 13 February 2023

Possible Break Down Starting

I was hoping that SPX would go higher and test a possible resistance trendline in the 4300 area and that is still possible, but reviewing the charts over the weekend there is a strong possibility that SPX is about to break down.

So far the high is a near perfect backtest of the monthly middle band, which is not the most obvious resistance level, but is a very significant one nonetheless, as it is regularly tested fairly exactly as support in uptrends.

SPX monthly chart:

On the weekly chart the previous main resistance at the 50 week MA, now at 4021, has been broken and the break above confirmed. That is now an important support level and if we are going to see a hard break down that will need to be re-broken and converted to resistance.

SPX weekly chart:

The first serious support however is at the daily middle band, currently at 4053/4. That held on Friday and at the last test in January. The first sign of a serious break down would be a confirmed break below that.

SPX daily BBs chart:

The daily middle band is supported by the rising support trendline from the December lows, currently in the 4047/8 area. A break of both would look distinctly bearish.

SPX 15min chart:

Looking at the short term on ES the overnight high was just below the new weekly pivot at 4116.25, and the patter from the low on Friday morning looks like a rising wedge that may be a bear flag. A sustained break over weekly pivot would make this look a lot more bullish.

Adding a note just after the RTH open, ES has just perfectly tested resistance on this rising wedge, confirming the resistance trendline with a third touch. This wedge could still break up, but 70% of the time these break down of course.

ES Mar 15min chart:

There are some international numbers being reported today that should shed more light on global inflation levels. My suspicion looking at a lot of charts over the weekend is that either those will disappoint, or that the markets will respond negatively to them not disappointing.

We held our monthly free chart chat webinar yesterday at at theartofchart.net. If you'd like to see that you can see it here or on our February Free Webinars page.

If you are enjoying my analysis and would like to see it every day at theartofchart.net, which I co-founded in 2015, you can register for a 30 day free trial here. It is included in the Daily Video Service, which in turn is included in the Triple Play Service.