- WE'RE JUST RANDOM SPECKS OF DUST IN A TORNADO TO THE MARKETS .......
- CHARTISTS MUST PUT ALL BIAS ASIDE AND LET THE CHARTS DO THE TALKING OR WE'LL SEE ONLY WHAT WE WANT TO SEE
- This blog has a copy of all header posts that I publish anywhere, so that those interested in seeing what my thoughts are on the markets can find them easily.
- I will be answering questions and responding to comments, so feel free to respond to any posts and I will see your comment even if it is not on the most recent post.
- If you're interested in seeing any intraday charts I post, I do that on twitter, and my twitter handle is @shjackcharts.
- The charts in the posts are as large as I can practically make them. if you would like to look at one more closely, click on it, and the link will take you to a larger version at screencast. If you click on that again, you will get a full page version, and can use the resizing function on your browser to enlarge parts of interest further.

Friday 27 May 2022

Holiday Rally Setup

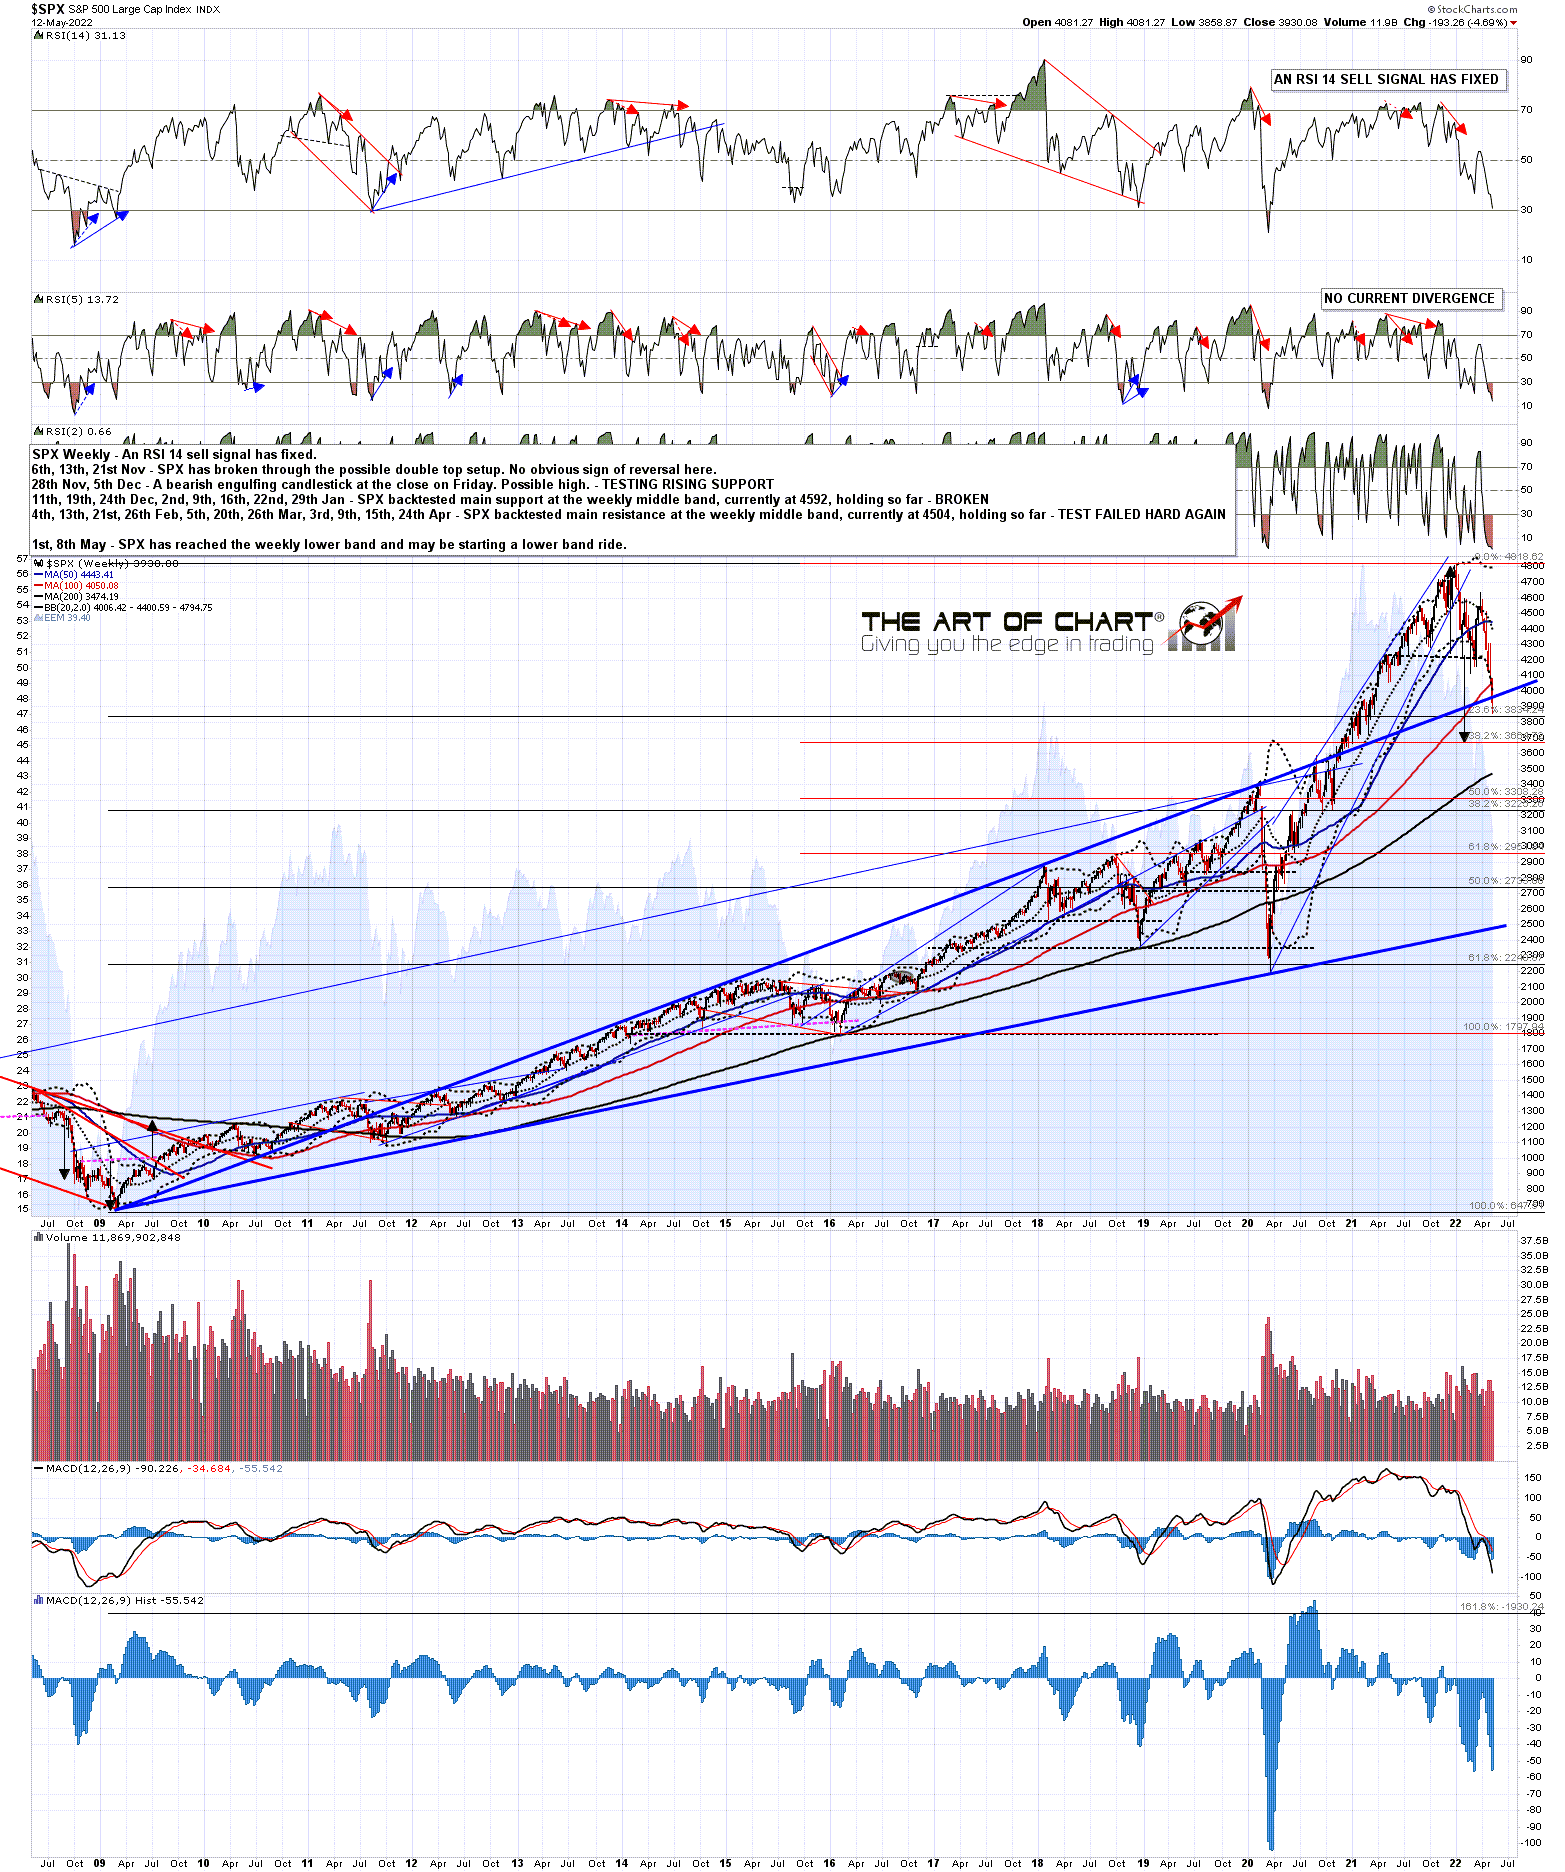
SPX closed below the main SPX support/resistance trendline at the end of last week. This trendline has broken twice since 2009, and both times SPX followed through hard. In 2011 SPX broke very hard through it and never broke back over it until until 2020. In 2020 SPX broke over it, then closed the next week back below, and then didn't close back below it again until last week. This is too limited a sample to extrapolate much from but there is precedent for failing to confirm the break the following week and then following through the break and so the likely weekly close back above today has precedent from 2020 and is not an obviously bullish development.

I was asked yesterday whether it is significant that SPX is back over the trendline and I replied that the importance of the trendline is mainly that the break below it effectively killed off the very bullish scenario that I was talking about in my post of 6th August 2021 as that required a more precise backtest to confirm the pattern setup. It may still hold on a less precise basis and the bull flag setups here on many indices and stocks still look good.

I added though that last week's low provisionally killed it off as support, and that a clear conversion of that trendline to resistance next would look very bearish indeed, and open both considerably lower targets, and the possibility that the trendline may become strong resistance for the next few years, as it was between 2011 and 2020.

SPX weekly chart:

On Monday I was talking about the possibility that there might be a significant rally this week and then on the bullish tape around the holiday on Monday and so far that has delivered a test and daily close break over the SPX daily middle band. That's promising for this rally to extend into next week.

As I mentioned on Monday the stats for this week were decently bullish, with historical stats of 61.9% for a green close today, and strong bullish stats of 71.4% and 76.2% respectively for the first two trading days of June on Wednesday and Thursday next week. Tuesday and Friday next week both lean very slightly bearish at 47.6% green closes historically but overall the week leans significantly bullish, as you'd expect for a holiday week that includes the first trading days of the month. 

In that time I'm thinking that SPX may convert the daily middle band, now at 4034, to support, and head up to test main resistance at the weekly middle band, now at 4331. I would note that, after the clear break back above the daily middle band at the close yesterday, if we were to see a clear close back below it today then that would be a bearish rejection.

SPX daily chart:

In terms of the short term pattern setup there is a clear inflection point here. On the bull side there is the break over the daily middle band yesterday and a clear double bottom setup on SPX that on a break and conversion of double bottom resistance at 4090.72 would look for a target area 4325-75, taking SPX back into the weekly middle band test.

On the bear side on SPX there is a clear rising wedge from the retracement low that may be a bear flag, and on the break through the resistance or neckline on any double top/bottom or H&S there is an inflection point where SPX or the instrument that broke through may either reject back into the previous high or low, or head to the pattern target.

There is also a lot of negative divergence here. On the six equity index futures charts that I watch every day there are possible 60min sell signals brewing on four of them, and with a little rally further up this morning there would be possible 60min sell signals brewing on all six of them. This is a very much a possible point of failure for equity indices, and while delivering a break down is harder to deliver on historically bullish days and around holidays, we have seen strong declines start from similar circumstance before this year so far and might see that again now.

In the meantime there are good bull and bear scenarios here and equity indices have a decision to make.

SPX 15min chart:


I've been asked about reversion to the mean from here and if we see a return to the 45dma then that is now at 4261. I explained though that the distance from the 45dma is more important when SPX is above it, simply because except for a period like the bullish spike up after the 2020 low, bearish moves tend to be more violent that bullish ones, which tend to mature into a grind upwards.

That is the reason that every bubble showing the distance from the 45dma on the SPX daily chart below is above the 45dma. The moves below the 45dma are too variable for this to be a meaningful indicator on bearish moves.

SPX daily vs 45dma chart:

My last chart today is for TSLA, where the possible bull flag falling wedge setup has overthrown bullishly and a strong daily RSI 5 buy signal has fixed. That too is an inflection point testing the shorter term falling wedge resistance and a break up from that would be bullish.

I know that TSLA is a controversial stock with much impassioned debate about it, and Elon Musk's social media posts add a large slug of randomness to the TSLA tape, but I just look at the charts, and this is a bullish looking setup. There are many others like it suggesting that even if equity markets have much lower to go, there is a decent chance that we might see some all time high retests before that happens.

TSLA daily chart:

This is a holiday weekend and on SPX  the historical stats lean 61.9% bullish today, 47.6% bullish on Tuesday which is the last trading day of May, 71.4% and 76.2% on Wednesday and Thursday which are the first two trading days of June. The next historically significantly bearish trading days are on Thursday 9th and Friday 10th June. There is a natural window here where we could see SPX test main resistance at the weekly middle band so we'll see if that happens.

In the event that the SPX daily middle band is broken and converted to resistance now, that would be bearish and suggest that SPX may proceed directly to a new retracement low, though there would still be a possibility that an IHS right shoulder might be forming, with an ideal low target in the 3858 area.

We had to delay yesterday's webinar so we are now doing our monthly free webinar at theartofchart.net on Big Five stocks and (eleven) Key Sectors an hour after the close on Thursday 2nd June, and if you'd like to attend you can sign up for that here.

I also want to mention again that our Follow The Leader service at theartofchart.net is up 100% so far this year. The technology to support this service is provided by our partner, GFF Brokers. GFF Brokers is an authorized broker for the World Cup Trading Championships Advisor programs. The profits on that so far this year on the nominal  account of size at $25k would be enough to pay the Triple Play subscription for ten years. If you'd like to have a free trial of the Triple Play service you can find that here.

Monday 23 May 2022

SPX Breaks Main Support Trendline

I was disappointed to see SPX close well below the main support and resistance trendline on Friday. This has only happened twice since the start of 2009, and on both occasions SPX followed through the break with force. Two instances is somewhat less than a statistically significant sample, but further downside is now undoubtedly open, even if the bull flag setups on many indices, sector ETFs and stocks are still intact.

SPX weekly chart:

The target at a full retest of the retracement low was made though, and there is now a decent looking potential double bottom setup on SPX, even if the lack of positive divergence is suggesting that no significant low has been made. SPX might get a decent rally here though, with obvious short term resistance at the 50 hour MA currently at 3962, and the 5dma currently at 3964. If this double resistance is broken and converted to support then the next obvious level would be the daily middle band, now at 4084.

SPX daily BBs chart:

I still like the overall bull flag setups here that if a sustained low could be made could set up retests of the all time highs, but as targets further down are now opened up I would like to go through the main ones of those on the US indices.

On SPX the original H&S failed, so there is now obvious downside targets there, and that is one reason that I have been favoring the high retest scenario, but there are decent topping patterns on NDX, IWM and Dow, so I'm showing where those targets are in the event that equity indices head significantly lower.

On NDX, where the bull flag setup is decent but not strong, the obviously lower target is an H&S target all the way down in the 9250 area. At that stage NDX would have retraced 75% of the move up from the 2020 low.

NDX daily chart:

On IWM the bull flag setup is again decent, though IWM has not yet either retested the last low, which looks like unfinished business, and may need to test flag wedge support currently in the 165 area. In the event of a break lower the lowish quality H&S target would be in the 133 area.

IWM daily chart:

On Dow the bull flag channel was very high quality, but has been weakened by an intraday break below it on Friday. That isn't terminal, but it may mean that an alternative support trendline is forming. The first high quality double top target in the 30750 area has been reached, but there is also a decent quality H&S target below in the 29250 area.

INDU daily chart:

This is a holiday week and the historical stats lean bullish every day, most strongly on Wednesday and Friday. Next Tuesday is the last day of June and leans neutral to bearish, and the first two trading days of June on Wednesday and Thursday lean strongly bullish at 72% and 76% green closes on SPX respectively. This week and next week are therefore a very natural time to see a rally and I'm favoring at least a backtest of the daily middle band on SPX in that time.

In the event that the SPX daily middle band is broken and converted to support we could see a test of main resistance at the SPX weekly middle band, currently in the 4362 area.

On Thursday we are doing our monthly free webinar at theartofchart.net on Big Five stocks and (eleven) Key Sectors and if you'd like to attend you can sign up for that here, or on our current Monthly Free Webinars page.

I also want to mention that our Follow The Leader service at theartofchart.net is up 100% so far this year. That is part of our Triple Play service and can be auto-traded at striker.com. The profits on that so far this year on the nominal  account of size at $10k would be enough to pay the Triple Play subscription for eight years. If you'd like to have a free trial of the Triple Play service you can find that here.

Friday 20 May 2022

Retest Interruptus

After the low last week very decent quality IHS patterns formed on SPX, NDX, IWM and Dow and broke up this week. They all failed, setting up targets at the retest of last week's lows, which would generally all be reached, so the fact that only Dow has delivered that retest so far tells us that there may well be unfinished business below.

The question here is whether the impressive collection of bull flags that have formed from the all time highs on many indices and stocks are going to deliver, and equities are still in the inflection point where that decision is being made.

There are better quality bull flags formed elsewhere, but the one shown on SPX below is pretty decent.

SPX 60min chart:

I was thinking that we might see a retest of the low and daily lower band together yesterday but both were missed. What next? Well the lows were almost retested on both SPX and NDX yesterday, and so there are decent quality potential double bottoms now in play on SPX, NDX and Dow, but the marginal higher low increases the odds that SPX and NDX may be forming bear flags or (likely bear) triangles that would then deliver retracement low retests in the next few days. If so the next move on SPX may well be a higher high over the rally high this week at 4090.72 so, if seen, a break over that would deliver an inflection point where SPX could either head to the double bottom target in the 4310-20 area, or fail back into the bear flag target at a retest of the retracement low.

SPX daily BBs chart:

The question for today is whether SPX is going to close above or below the main SPX support trendline, currently in the 3970 area. It isn't a really strong indicator for the bears if that is broken today, but I would note that since the start of the trendline at the 2009 low, this trendline has only broken twice on a weekly or monthly basis, and both times followed through hard on that break. Now two instances isn't a statistically significant sample, but it would still be better for the bull flag scenario if that trendline holds at the close today.

SPX weekly chart:

Two sector ETFs caught my eye after the highs this week, because they both perfectly held their short term resistance trendlines at those highs. A break above those now would therefore look potentially bullish.

XLF doesn't have an obvious overall bull flag though and definitely has a lot of further downside potential.

XLF 60min chart:

There is a decent quality bull flag setup on XLI though, and the double top target from the high made target last week. A break over the resistance trendline would open the nice looking double bottom setup here, and a very possible move back to flag resistance, currently in the 103.60 area.

XLI 60min chart:

Fridays generally lean bullish, so I'll be watching my main SPX support and resistance trendline today. If SPX recovers over 4000, there are decent odds that 4100 will be coming next to set up the next obvious inflection point. 

That said, today is May expiration, and the historical stats lean bearish, with about 38% green closes on SPX. If SPX heads down I'll be watching particularly for the full low retests on SPX and NDX, and ideally there would then be a strong rally back over the weekly SPX trendline by the close. That would be a strong bullish setup into next week, which leans modestly bullish every day.

Everyone have a great weekend :-)

Monday 16 May 2022

Decent Looking Candidate Low

SPX rallied hard on Friday and so closed back well above my retracement target support trendline, so that has held on a weekly basis and may still hold as the retracement low here. So how is this low looking as a possible retracement low?

The first thing to say that my possible very bullish scenario that I was thinking might well be set up on this retracement is, if not dead, at best sufficiently badly damaged that the pattern target could not be relied upon even if the current all time high was next to be broken and converted. The pattern setup requires a fairly precise retest of the trendline and this didn't meet that standard. Given the economic background that scenario was perhaps too much to look for in any case.

Does that mean this can't be the retracement low? No, and on actually the setup that we have here the odds of that retracement low being made here are looking pretty good, having firmed up a lot in trendline terms particularly over the last two trading days.

SPX weekly chart:

One thing that doesn't look ideal here is the amount of positive divergence on the daily charts at this low, but that could easily be fixed with a low retest that holds. That may be setting up here as SPX broke back over the 5dma on Friday, and is therefore back on the Three Day Rule. If we see a clear RTH close back below it on either Monday or Tuesday this week, we will have another fixed target at a retest of the current retracement low at 3858.87. There are other options for a reversal pattern back up from here, but some seventy percent of significant highs and lows on SPX form with a double top or bottom, and SPX may be forming an overall more serious high here.

SPX daily 5dma chart:

If we are seeing a retracement low forming here, then that brings us back to my main retracement scenario, which is that so far this year bull flags have been forming from the all time highs on pretty much everything. You can see the bull flag falling megaphone option on the chart above, on the chart below is the similar one on NDX. NDX has been leading the declines this year, and has now retraced 50% of the move up from the 2020 low. That is the most obvious level to find a retracement low.

There are already RSI 14 and RSI 5 daily buy signals fixed on NDX, so there is no need for a low retest, though we might see one anyway to set up a reversal pattern.

NDX daily chart:

I tend to use the big five and key sectors for a general barometer of where the market is and was discouraged on Wednesday night that the setup for bull flags there was unimpressive. That changed in the next two days though, and when I looked again this weekend I saw that it was now pretty solid. 

On the AAPL chart below my initial flag support trendline broke, but another high quality bull flag channel support trendline was established at the last low, so there is a very decent quality bull flag there again. It is also hitting an important support level and possible H&S neckline.

That does leave a possible bear option here of course, as a right shoulder could form here with an ideal target in the 156.60 area, and I'll be watching for that, but until this flag channel support is broken, this is a clear bull flag from the high.

AAPL daily chart:

On TSLA the early April high established a beautiful three touch trendline from the all time high, which was strongly suggestive of a bull flag forming, but the support trendline was uncertain. That too was fixed at Thursday's low, which established another very high quality flag support trendline there, in this case a bull flag falling wedge.

These are two very good examples, but there are others, and on the six stocks and eleven ETFs covered in our FAANG stocks and Market ETFs Service at theartofchart.net, there is now a clear bias towards a low in this area, followed by bull flag breaks up into retests of the all time highs.

TSLA daily chart:

In my post of 6th August 2021 I was looking at the possibility that there would a retracement in the coming months to backtest the broken resistance trendline on SPX and then return to retest the highs, and I now think that having reached this area, the pattern setup now significantly favors a low here and then return to the high. While the market may of course go the other way, I think the odds here now are 60% or better that is the next serious move coming on SPX and NDX, with decent quality bull flags also on RUT and Dow.  The more bullish scenario I laid out in that post is likely dead in the water, and it may be that the high retests are just to make the second highs on much larger double tops, but until we see some clear support breaks below this area, that is my main scenario here.

I might be mistaken, but I am also thinking that these retests of the all time highs on equities may well be supported by a big rally on bonds over the next few months. That sounds a bit radical here, but when I called a target on TNX at 32 at the end of last year that too sounded radical, and since then TNX has almost doubled into the recent high at 31.67. That may need to go a little higher, but I was thinking that we might see a big rally on bonds here to set up a right shoulder on a larger reversal pattern that would then take bonds much further and TNX up into the 60 area.

I'll be doing a post on bonds and that and other possible bonds scenarios in the next week or so, but there are already decent buy signals in place on bonds that may deliver that rally.

In case you missed it in my last post, I'll also mention our free to follow service 'The Weekly Call' at theartofchart.net. It is now up 714% since the start in October 2016 and Stan does a post every week on it at our blog. If you wanted to follow the trades you can do that automatically in a trading account at striker.com where it is in the top 10 of the trading strategies used there. I think this may be the best trading service given out for free on the internet, and if you try it and disagree, you can have a full no-quibble refund of that free subscription. :-)

Friday 13 May 2022

Friday The Thirteenth

In my posts over recent weeks I have been following on from my post of 6th August 2021 when I was looking at the possibility that there would be a retracement this year to backtest a major broken resistance trendline on SPX, and the possible very bullish setup that a good retest would partially confirm.

The trendline is the main resistance trendline on SPX on SPX from the low in 2009, shown on the chart below, and it was and is a really good trendline. The start was at the 2009 low, with touches at the lows in 2010, and highs in 2011, 2012, 2013, 2014, 2017, 2018 and 2020. It was so strong that I was expecting it to hold indefinitely until it broke in the wild move up after the 2020 low. This is the trendline I was looking to be backtested, and SPX delivered a visual hit of that trendline at the low early this week, and has broken below it slightly on Wednesday and Thursday, as you can see on the weekly chart below.

So where does that leave my very bullish scenario? At minimum significantly weakened and, if there is a weekly close below the trendline, broken entirely. You can't derive a statistical universe from a single trendline of course, but on the two occasions when this trendline broke on a weekly close basis, SPX followed through on the break with force.

We'll see how it goes today. Fridays tend to lean bullish and there is an hourly RSI 5 buy signal on SPX. SPX is also badly in need of a rally after the steep declines over the last few days.

SPX weekly chart:

NDX has now reached the 50% retracement level of the move up from the 2020 low, and is showing a decent bull flag. I'm not seeing as much bullish divergence on NDX stocks as I would like to see here, but this is a possible support area and is the likely inflection point area where NDX can either find support and reject back up into the high on the bull flag scenario, or continue down into the H&S target in the 9200 area, still a long way below.

NDX daily chart:

So how is the bull flag setup looking on SPX? Well the move so far this year has very much formed like a flag, but I'm not happy that the support trendline is right. Maybe.

SPX daily chart:

In the short term SPX has been on a daily lower band ride all week, and if that is to continue today then SPX would likely need at minimum to retest yesterday's low at 3858.87. A break up from the band ride would set up a possible rally into a test of the daily middle band, now in the 4200 area. 

SPX daily BBs chart:

If SPX closes below the main support trendline in the 3950 area today, the case for an all time high retest on SPX this year will be badly damaged. I will be watching the close today with great interest.

I haven't recently mentioned our free to follow service 'The Weekly Call' at theartofchart.net. It is now up 714% since the start in October 2016 and Stan does a post every week on it at our blog. If you wanted to follow the trades you can do that automatically in a trading account at striker.com where it is in the top 10 of the trading strategies used there. I think this may be the best trading service given out for free on the internet, and if you try it and disagree, you can have a full no-quibble refund of that free subscription. Everyone have a great weekend :-)

Wednesday 11 May 2022

Testing Ideal Backtest Area

 In my posts last week I was talking about my post of 6th August 2021 when I was looking at the possibility that there would be a retracement this year to backtest a major broken resistance trendline on SPX, and the possible very bullish setup that a good retest would partially confirm, and I looked at that in more detail in my last post.

The trendline is the main resistance trendline on SPX on SPX from the low in 2009, shown on the chart below, and it was and is a really good trendline. The start was at the 2009 low, with touches at the lows in 2010, and highs in 2011, 2012, 2013, 2014, 2017, 2018 and 2020. It was so strong that I was expecting it to hold indefinitely until it broke in the wild move up after the 2020 low. This is the trendline I was looking to be backtested, and SPX delivered a visual hit of that trendline at the low yesterday, as you can see on the monthly chart below.

SPX could still go a little lower on my possible very bullish scenario from here, but not much. Anything under 3930 would likely weaken that bull scenario, and a break below 3900 would likely kill it, though it wouldn't weaken the case that a bull flag has been forming so far this year that should naturally resolve into a retest of the all time high.

SPX monthly chart:

In my last post I was looking at the pattern setup here but I want to take a few minutes today to look at the trendline that is currently being backtested, which in my view must be a strong contender for the most remarkable trendline ever formed on SPX. Regardless of that I think this is likely the strongest trendline that I have ever drawn or seen on any trading instrument on any timeframe, and I have drawn tens of thousands of trendlines on hundreds of indices, bonds, commodities, currencies and stocks over the years. So what makes this particular trendline so special?

Well you see a lot of trendlines posted, and most of them aren't drawn that well in my view. If you are looking for a rough channel or just assessing wave structures then drawing rough trendlines can be ok, but when it comes to patterns I have always taken the firm view that the trendlines need to start at logical locations for the start of a move, and to be precise to avoid an an unacceptable risk that the chartist will draw what he/she wants to see, at the risk of missing what is actually there. I draw all my trendlines to be as precise as possible.

On that basis a three touch trendline is confirmed, a four touch trendline is strong, and a five touch trendline is a rarity. This trendline however starts at the 2009 low, was tested three times as rising wedge support for the first wave up from that low, broke down in 2011 and became the main resistance trendline from there through to late 2020, being tested nine times as resistance in that time, with a small intra-week spike through the trendline on the eighth test and a break up on the tenth. This current test is the first test since then, and will be the fourteenth test since the 2009 low, with two of those tests breaking through and converting the trendline first from support to resistance, and then from resistance to support (if it holds here on this test).

If this backtest is precise, then the bullish scenario I laid out last week is firmly on the table, with the next big inflection point after the retest of the all time high, at which point either the old all time high is converted to support, and the bullish scenario into 6560 becomes my main scenario, or the move up fails, in which case we may well be looking at a double top setup on SPX that on a subsequent break of this low would be looking for a target in the 3100 area.

Either way it should be fun to chart and trade on the way.

SPX weekly chart:

On the daily chart I have drawn in a very decent possible bull flag falling wedge support trendline that may hold for a start of the move back into the highs. One way or the other this is a likely bull flag setup from the high, so regardless of whether the main SPX trendline holds on this retracement, a retest of the all time highs in due course is likely. Not all bull flags break up of course, but some 70% of highs and lows on SPX involve a double top or bottom, so even if a major high or low is forming here, a retest after a large retracement would be normal.

SPX daily chart:

If we do form a low here then the first big resistance will be the daily middle band, now at 4259 and a decent match with the monthly pivot at 4283. Main resistance is at the weekly middle band now at 4404, currently a decent match with the annual pivot at 4412. 

SPX daily BBs chart:

In terms of the shorter term resistance the obvious first resistance levels are the 5dma, currently at 4112, currently a good match with the hourly 50 MA at 4116. A daily close would put SPX back on the Three Day Rule, so the next two daily closes would then need to hold above that, or SPX would likely need another low retest.

SPX 5dma chart:

SPX is making a possible low here at my target trendline, and if the low is at a precise test of that trendline then the very attractive bull scenario I laid out last week will still be in play. Regardless of that though the overall likely bull flag forming on SPX here favors a retest of the all time high in due course.

We are did our usual monthly free public Chart Chat at theartofchart.net on Sunday 8th May looking the usual wide range of instruments and markets. If you missed that you can see the recording here, or on our current free monthly webinars page.

Friday 6 May 2022

Another Three Day Rule Target

In my post earlier this week I was talking about my post of 6th August 2021 when I was looking at the possibility that there would be a retracement this year to backtest a major broken resistance trendline on SPX, and the possible very bullish setup that a good retest would partially confirm, and I said I would look at that in more detail in my next post.

The trendline is the main resistance trendline on SPX on SPX from the low in 2009, shown on the chart below, and it was and is a really good trendline. The start was at the 2009 low, with touches at the lows in 2010, and highs in 2011, 2012, 2013, 2014, 2017, 2018 and 2020. It was so strong that I was expecting it to hold indefinitely until it broke in the wild move up after the 2020 low. This is the trendline I am looking to be backtested.

So what's the pattern setup? Well, the corresponding support trendline was only two touches at the point it broke down in 2020, so if that was rising megaphone support, then the 2020 crash delivered a decent 50% retracement of the move up from the 2009 low and that may have been be the resolution and end of that pattern. There is however a possibility that the 2020 move established a new rising megaphone support trendline, and that is supported by the way that the resistance trendline broke at the end of 2020, with first a monthly test, then another monthly test with a poke above and close below at the end of the month, and then the break and monthly close above on the third test of the trendline.

Why is this important? Well if that break was a break up from a rising megaphone, then that sets up a potentially very bullish move if that is confirmed by (first), a fairly precise retest of the broken trendline that holds then (second), a new high that converts the old high into support. If seen, that is then a confirmed break up from the larger rising megaphone target with a high probability target in the 6560 area.

These rising wedge or megaphone targets when they break up and backtest cleanly are rare, as these generally break down, and if there isn't a clean backtest then something else may well be happening, but when they break up in the right way I have found that they have a very good chance of making target, well over 80% in my experience. I have a past example that I called a few years ago on SPX that I'll look at to illustrate how these work.

SPX monthly chart:

This example is from a special post I published on 30th June 2013 called 'Brave New World Series: 3 - The SPX Rising Wedge Target at 1965'. Some of my long term readers may well recall it.

In that post I showed the chart below, with the rising wedge on SPX that had broken up and backtested perfectly though it had not yet made a new high and converted the old one to support. The backtest however was also a conversion of the 2007 all time high at 1576.09 to support. That target at 1965 was then made a year or so later in 2014, a move up of 25% from the backtest.

The current setup would be a larger move, with a 66% or so move up from the backtest, but with the last impulse up from the 2020 low having delivered a 125% increase on SPX, then that doesn't seem too far from the realms of possibility.

There is also a possibility of a substantial rally on bonds starting in the next few weeks that could last a year or more and that could be a good fit with this scenario. I'll be doing another post in the next few days looking at the setup there.

SPX weekly chart (from 30th June 2013):

In the shorter term SPX broke up hard on Wednesday on doveish noises from the Feb, but then gave that all back yesterday. In the process there was a clear break back over the 5dma, putting SPX back on the Three Day Rule, then a clear close back below it fixing a Three Day Rule target at a retest of the current retracement low on SPX  at 4062.51.

I've marked the six previous Three Day Rule fixes so far in 2022, and all six made target. After a small tweak to the way I calculate this on 2019, on the new basis there hasn't been a fail on this setup since the start of 2007, with the exception of two marginal higher lows when triangles were forming, so I am expecting to see that low retest.

SPX daily 5dma chart:

On the daily bands chart the lower band is in the right area to get tested on that retest, but I'm expecting to see SPX go at least a bit lower, probably to 4000, and potentially down to my major trendline backtest, now in the 3930-50 area, though I have some reason to think that might not be backtested fully until June.

SPX daily BBs chart:

On the 15min chart the current short term support trendline may be a target, and that is currently in the 4000 area, though there are other longer term alternatives below that in the 3900-50 area.

SPX 15min chart:

The bottom line here is that a new retracement low on SPX is very likely, and there are some attractive targets not far below when that happens, most likely next week.

We are doing our usual monthly free public Chart Chat at 4pm EST on Sunday 8th May. We'll be looking in more detail at our equities retracement scenario there, as well as covering the usual wide range of instruments and markets. If you'd like to attend you can register for that here. As always you can also register for this on our current free monthly webinars page.

Tuesday 3 May 2022

Oversold Bounce

On 5th July last year I was updating my SPX monthly chart and added a scenario for a retracement that I thought might take place in the next few months, and talked about that in webinars at theartofchart.net. On 6th August I then wrote a post about that scenario looking for a backtest of a trendline on the monthly chart that was in the 3800 area at the time. That trendline is now in the 3930-50 area, and that is my main target for the retracement we have been seeing so far this year.

I'll be writing more about this scenario, and the potentially very bullish next move that this retracement may be setting up, in another post later this week, but I'm going to focus on the short term setup this morning. On the monthly chart below though, X marks the spot where I would like this retracement to reach, and end.

SPX monthly chart:

In terms of short term targets, I had two open targets below yesterday morning, and they we both reached in the morning so I have no open targets below.

The first target was the Three Day Rule target at the retest of the 2022 low on SPX, and we saw a new low made for 2022 this morning. The 5dma is currently at 4186/7 and, now the target is cleared, that is now important resistance on a daily close basis.

The second target was the double top target on Dow, and that was also reached and is shown on the last chart on this post.

SPX daily 5dma chart:

After the strong rejection at the test of the weekly and daily middle bands on SPX a few days ago, SPX has been on a daily lower band ride for seven trading days. The lower band is now at 4112 and declining fast, so if SPX is to remain on the lower band ride, that will need a test again today. If we don't see that SPX may be starting a bottoming process for another backtest of the daily middle band, now in the 4372 area.

SPX daily BBs chart:

Looking across the indices after the close yesterday there are two decent quality decline patterns from the last test of the daily middle band on SPX. The pattern on SPX is a decent quality falling wedge, with wedge resistance now in the 4230 area, and with the rally supported by an RSI 14 buy signal on the 15min chart, and a 60min buy signal on ES.

SPX 15min chart:

On Dow there is another equally nice falling wedge, also supported by an RSI 14 buy signal and a 60min buy signal on YM. Resistance on Dow is in the 33475 area. Both of these are the obvious initial rally targets and have a decent chance of being hit.

INDU 15min chart:

Both of these rally setups look good, and the odds of seeing the indices rally today look decent. That might be short lived though and I'd note that the historical stats for tomorrow are 67% bearish on SPX.

There are two webinars at theartofchart.net this week. The first is Trading Commodities - Setup and Approaches an hour after the close on Thursday. We'll be looking at the usual three prospective instruments and will be designing and outlining three options trades for those. If you'd like to attend you can register for that here.

The second webinar is our usual monthly free public Chart Chat which will be at 4pm on Sunday 8th May. I'll be looking in more details at my SPX retracement scenario from the top of this post, and we'll be covering the usual wide range of instruments and markets. If you'd like to attend you can register for that here. 

As always you can also register for either or both of these on our current free monthly webinars page.