I did a post a month ago looking at the triangles on Oil & Natural Gas. I’ve been following both since, amid the intermittent turbulence in the Middle East, and the rhyming triangles scenario I laid out in the post likely failed on Friday on natural gas. I’ll cover that further down but first I’ll review where we are up to on oil.
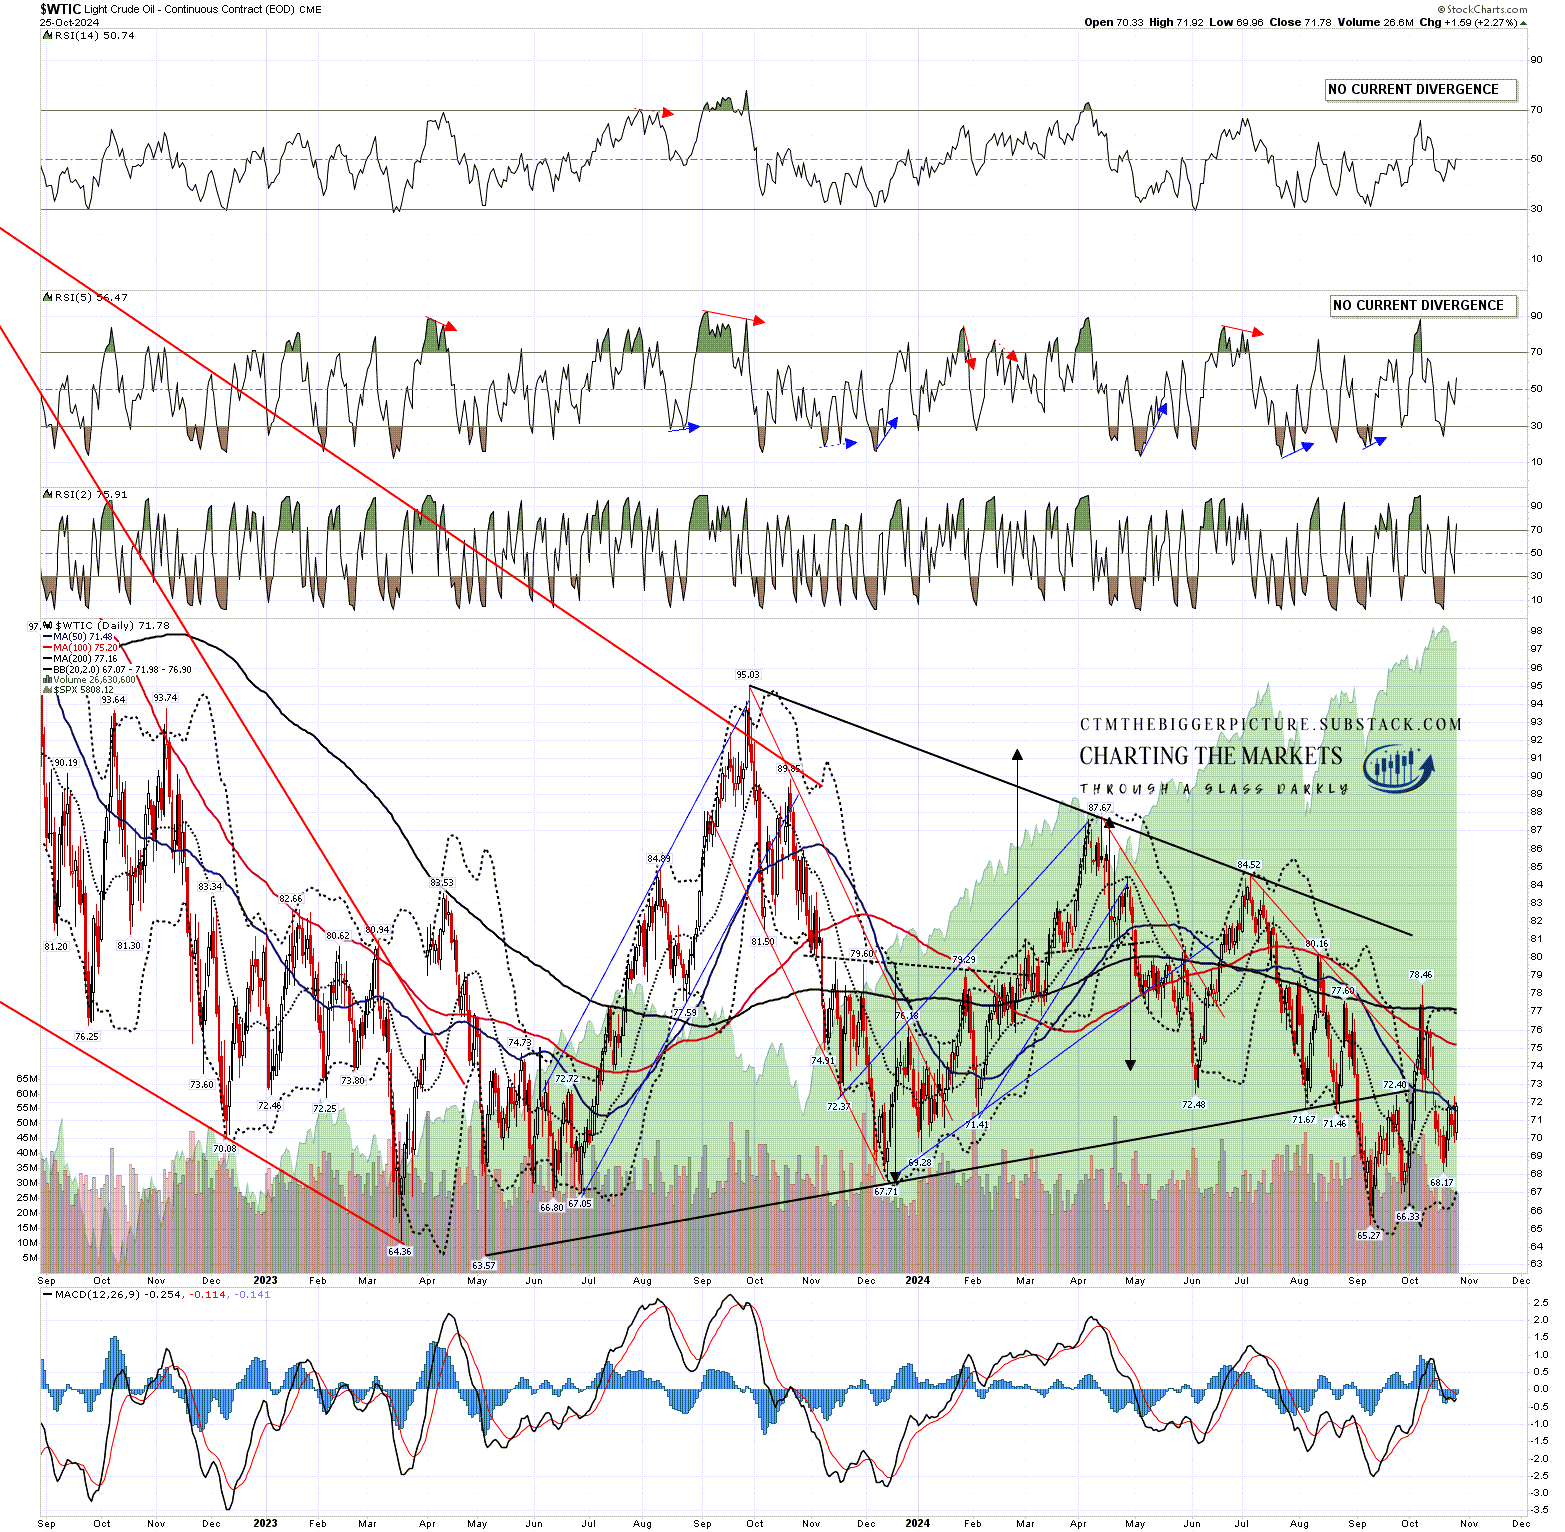
On the WTIC chart the triangle that broke down had a target at a retest of the May 2023 low at 63.57, and that remains the case. Invalidation of that target would be at a break back over triangle resistance, currently in the 81.2 area.
In the short term oil spent most of last week testing the daily middle band as resistance and failing to break above it. At the time of writing, just after the futures reopen on Sunday night, the reaction on oil futures to the retaliatory attack on Iran by Israel on Friday night has so far been a three buck drop from the closing price on Friday, presumable because Israel avoided attacking energy related targets.
I’m still treating that 63.57 triangle target as the obvious next target, and as I write, that is only $5 below the current price.
WTIC daily chart:
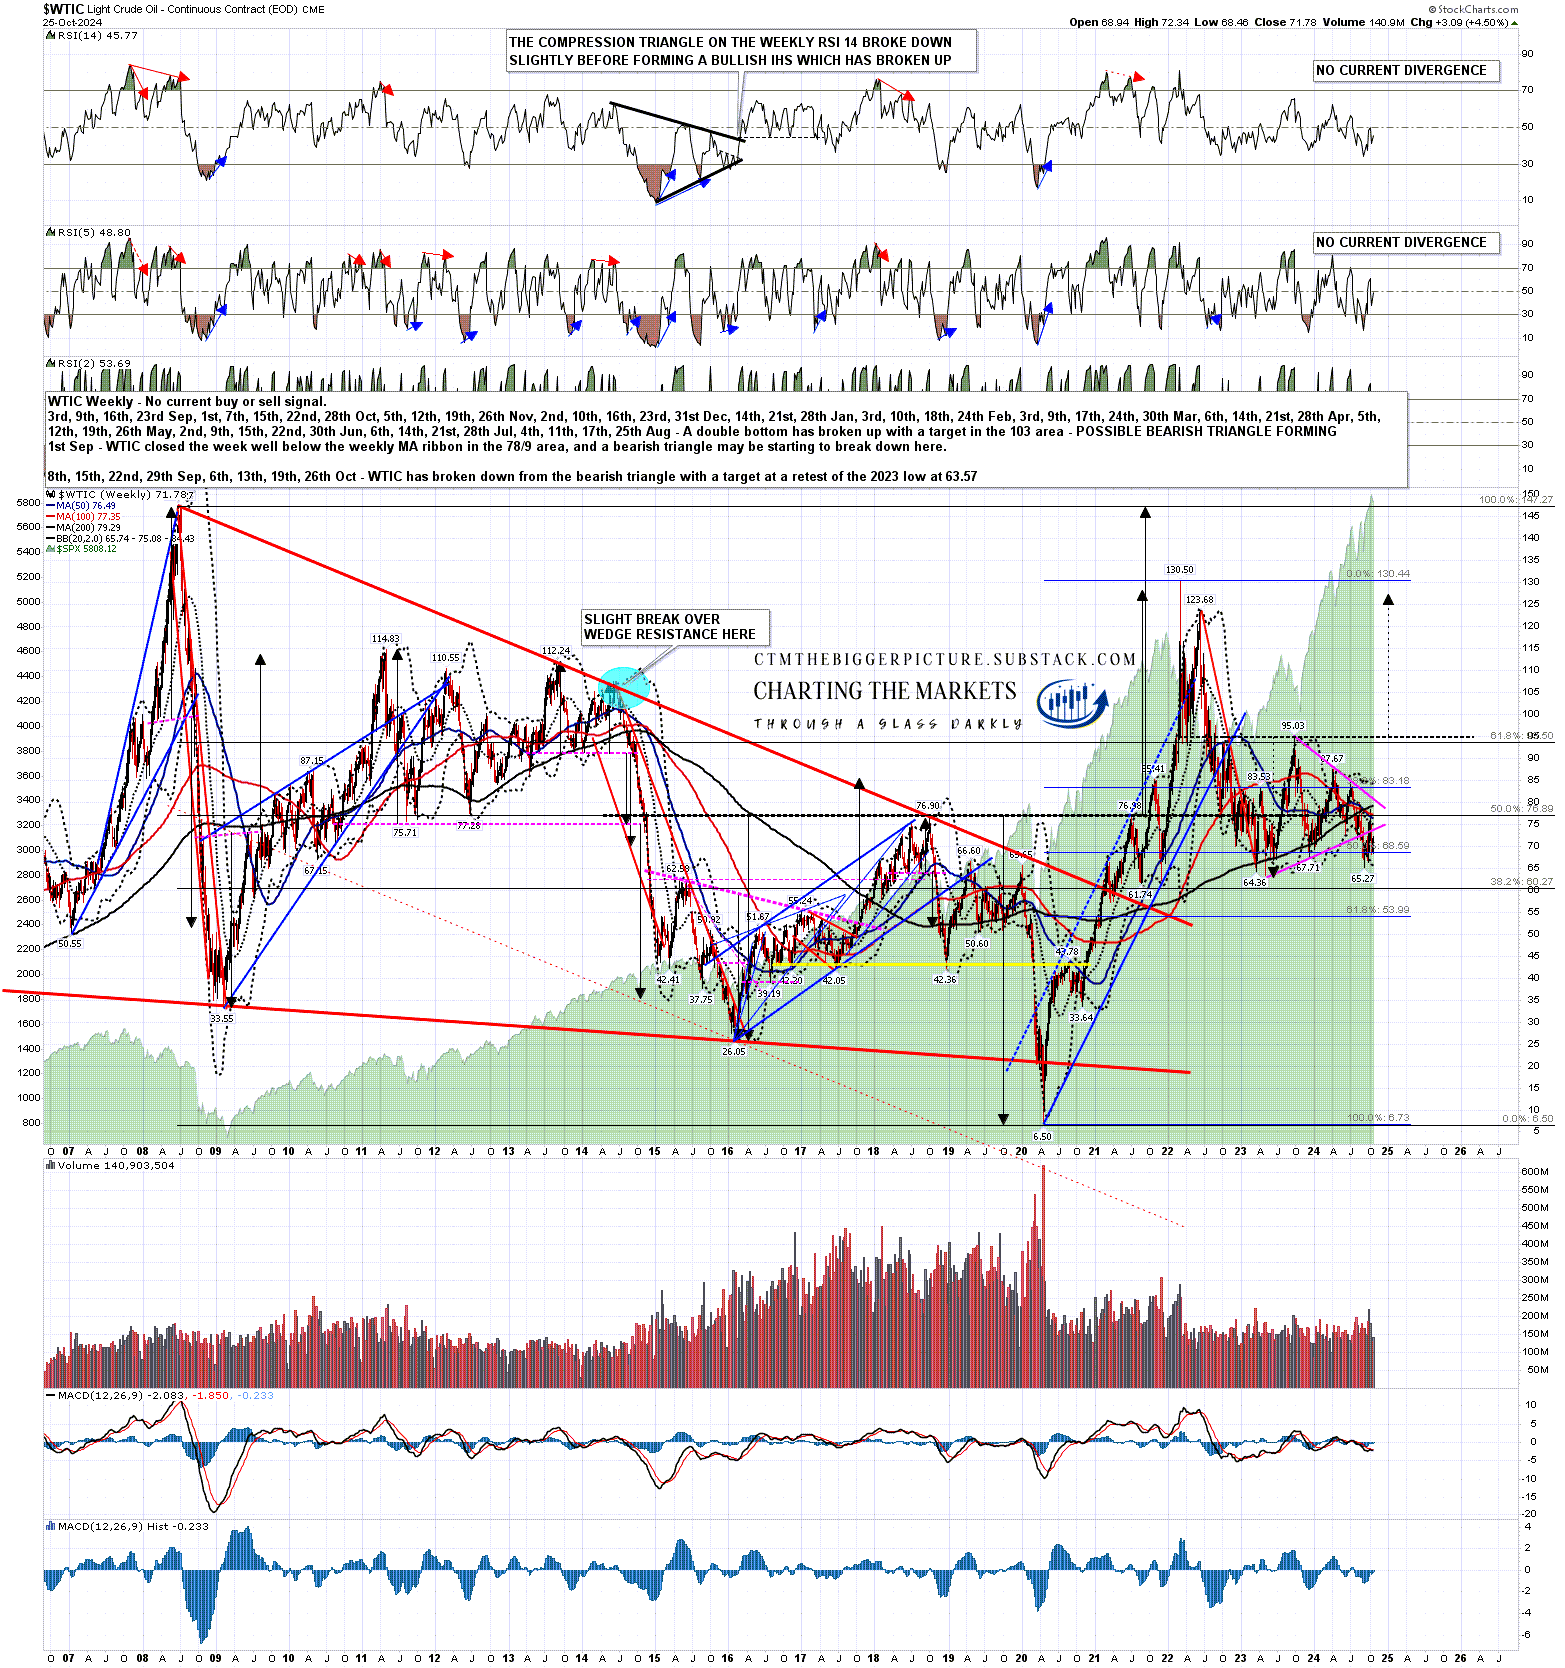
On the bigger picture I’m thinking that the retest of 63.57 may well be setting up the second low of a double bottom that might then, on a sustained break over the late 2023 high at 95.03, would target the 127.5 area, slightly below the 2022 high at 130.50.
Regardless of that oil has a lot of support in the $55 to $65 area, and I’d be surprised to see that broken anytime soon.
WTIC weekly chart:
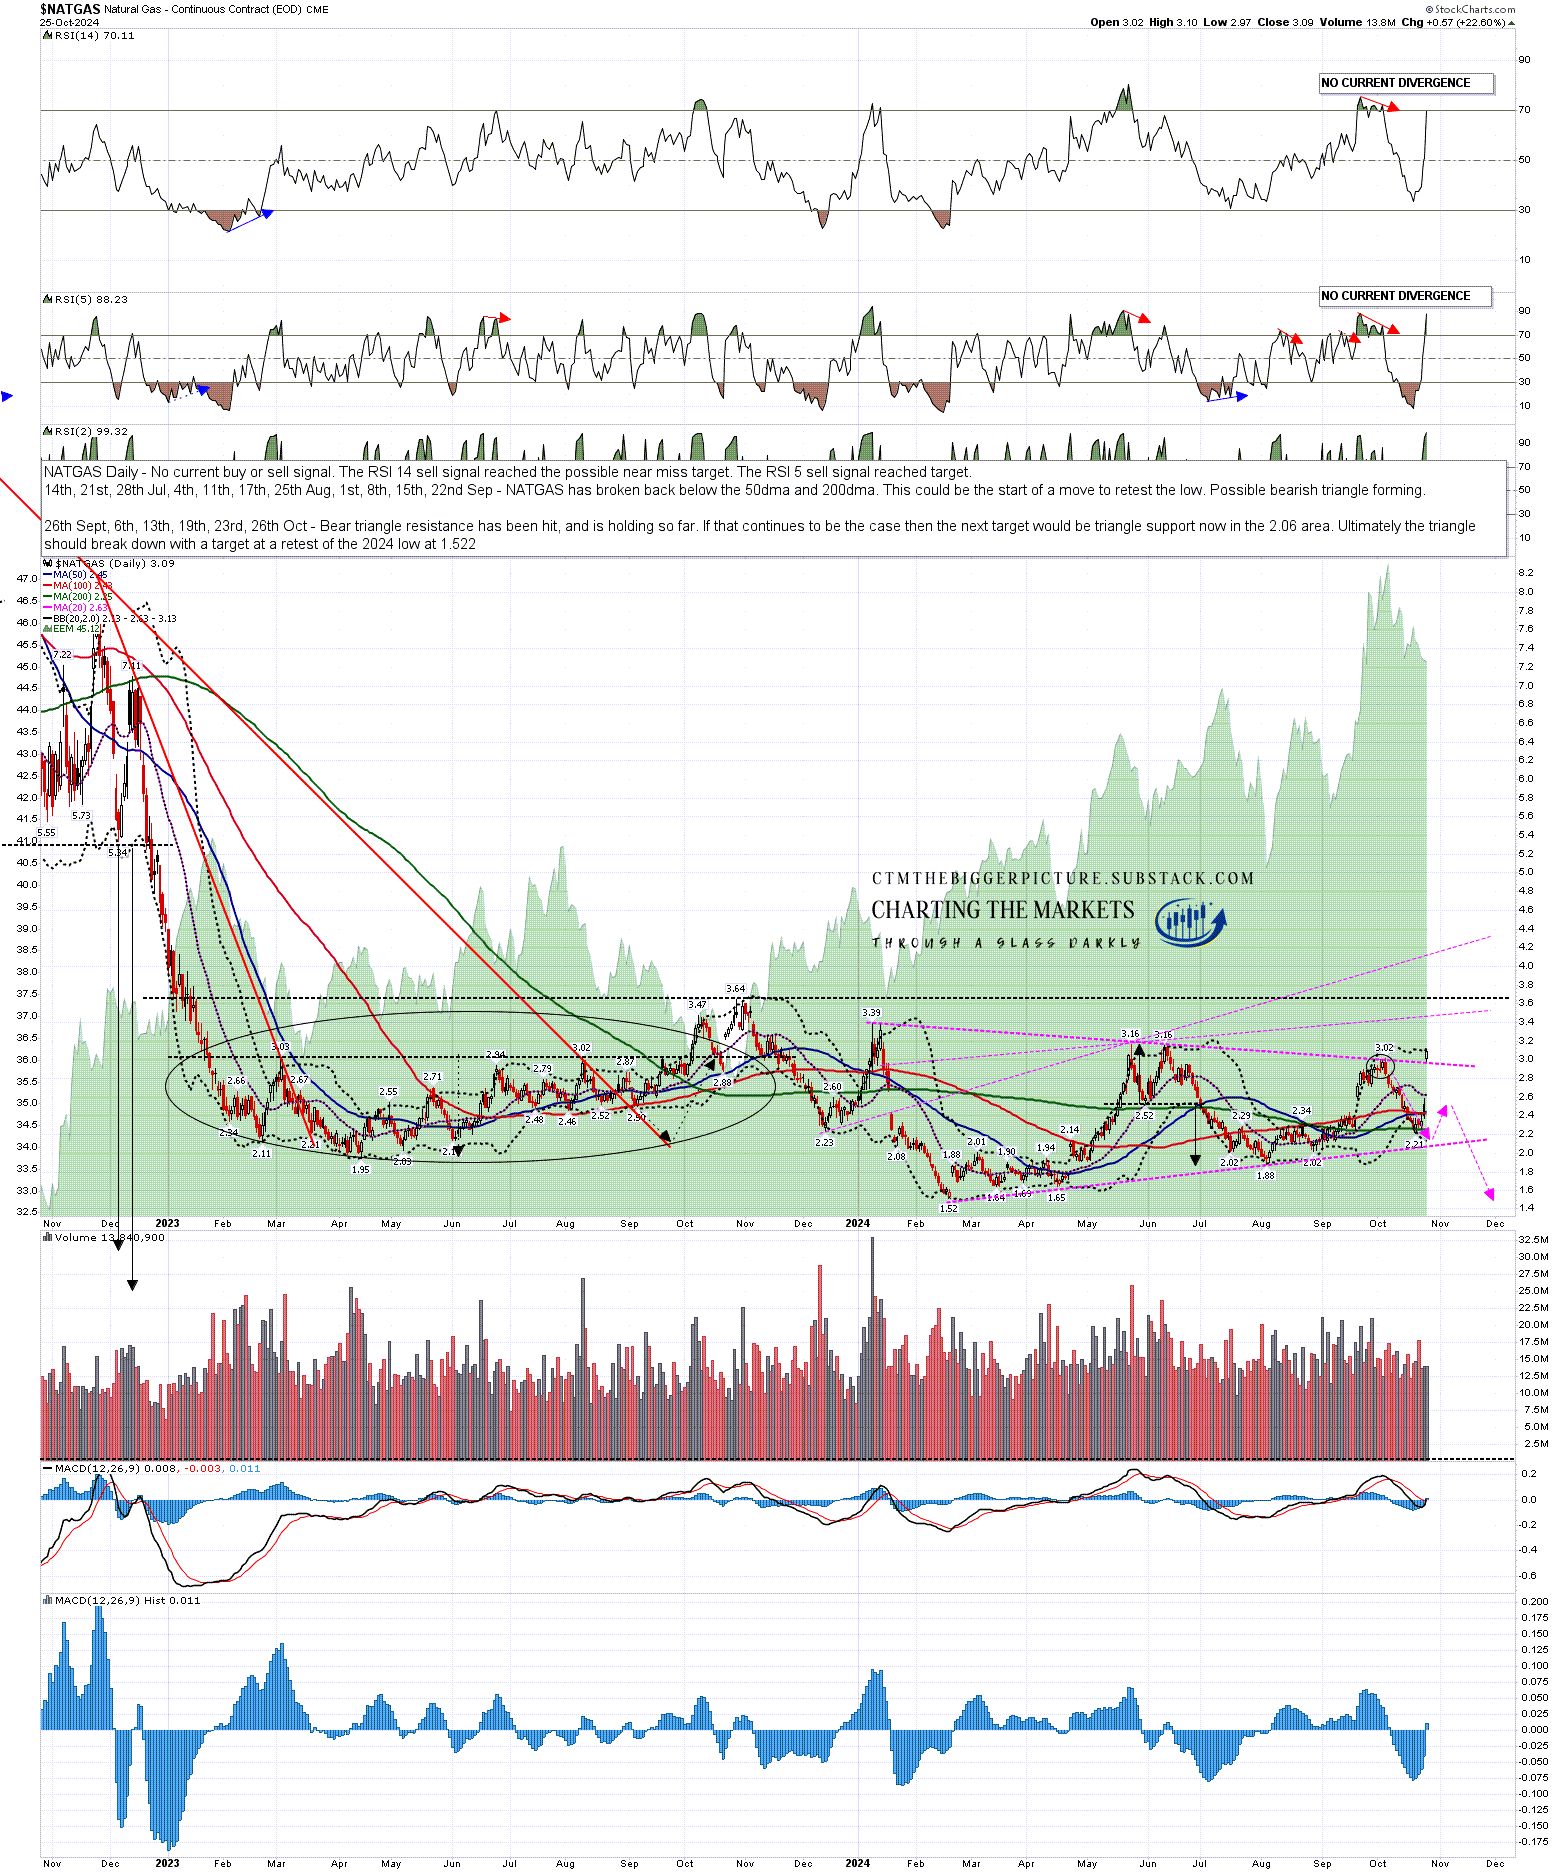
The triangle on natural gas that I was looking at a month ago was performing really well until the start of last week, and might to the casual eye have looked perfectly on track on Friday morning, but that rally last week was always going to kill the triangle when the NG front month futures contract rolled from Nov to Dec on Friday, at the price NG Nov closed at then. I’ll explain why that was on the chart below the one directly below.
For now though, triangle resistance has broken up and while the triangle could be rescued by a sharp decline of considerably more than the 2.5% decline in NG Dec since the open tonight, I have drawn in the two other possible bear flag resistance trendlines on the NATGAS index chart, currently in the 3.46 and 4.1 areas respectively, on the chart below.
There are other options, notably the possible IHS neckline or possible asymmetric double bottom resistance at the late 2023 high at 3.46, but those two would be the obvious next target if, in due course, we are then going to see a retest of the Feb 2024 low at 1.52.
NATGAS daily chart:
Why did the NATGAS index triangle break up on the roll from the NG futures contract from Nov to Dec?
Well I have mentioned that NATGAS is a hard long to hold for long periods, and the main reason is that there is almost always an assumption that NG will rise a buck or more in the winter each year as more gas is used for heating.
The main purpose of the NG future is to match big producers of natural gas to big consumers in the forward markets so the NG Dec 2024 contact has been in existence for several years with the big producers promising delivery in December 2024 to large consumers that commit to take those deliveries. The price varies over the period of the contact and only becomes final on the settlement date on 26th November 2024, at the final price on that date, for delivery in December 2024.
Until that final date speculators can buy or sell the futures in the hope that it will either rise or fall but at settlement, only companies that can take delivery can hold that contact. You can look at the settlement and delivery dates for these here if you’re interested.
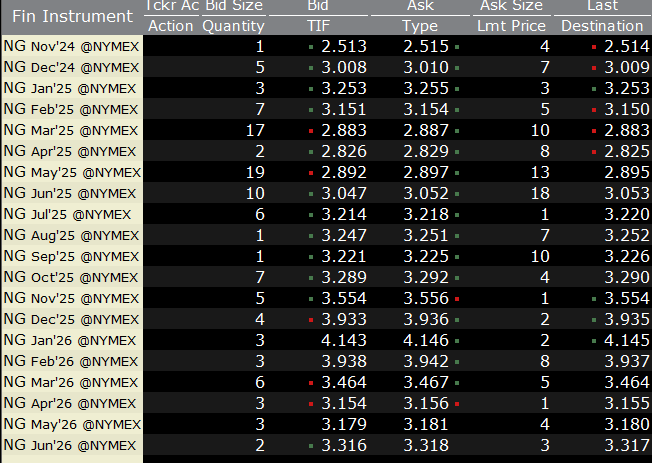
In practical terms this means that an expectation that natural gas prices rise in the winter mean that much of that rise is already baked into the futures prices. To roll from the October to November contract required paying another thirty cents. On Friday in the roll from the November to December contract was another fifty cents higher, and to roll from the December to January contract would be another thirty cents. As the NATGAS index price is always the front month price on the NG future, that would mean that for the price to remain the same October through January, the futures price would need to decline by $1.10 intra-month over that period. That is in effect what needed to happen for my triangle scenario to play out, and obviously that failed to happen last week.
Highs on NATGAS tend to be in Oct/Nov and lows in Feb-Apr, so I’m still thinking we might see that low retest, but the triangle I drew a month ago won’t be that path. We’ll see how it goes from here.
NATGAS Futures to June 2026:
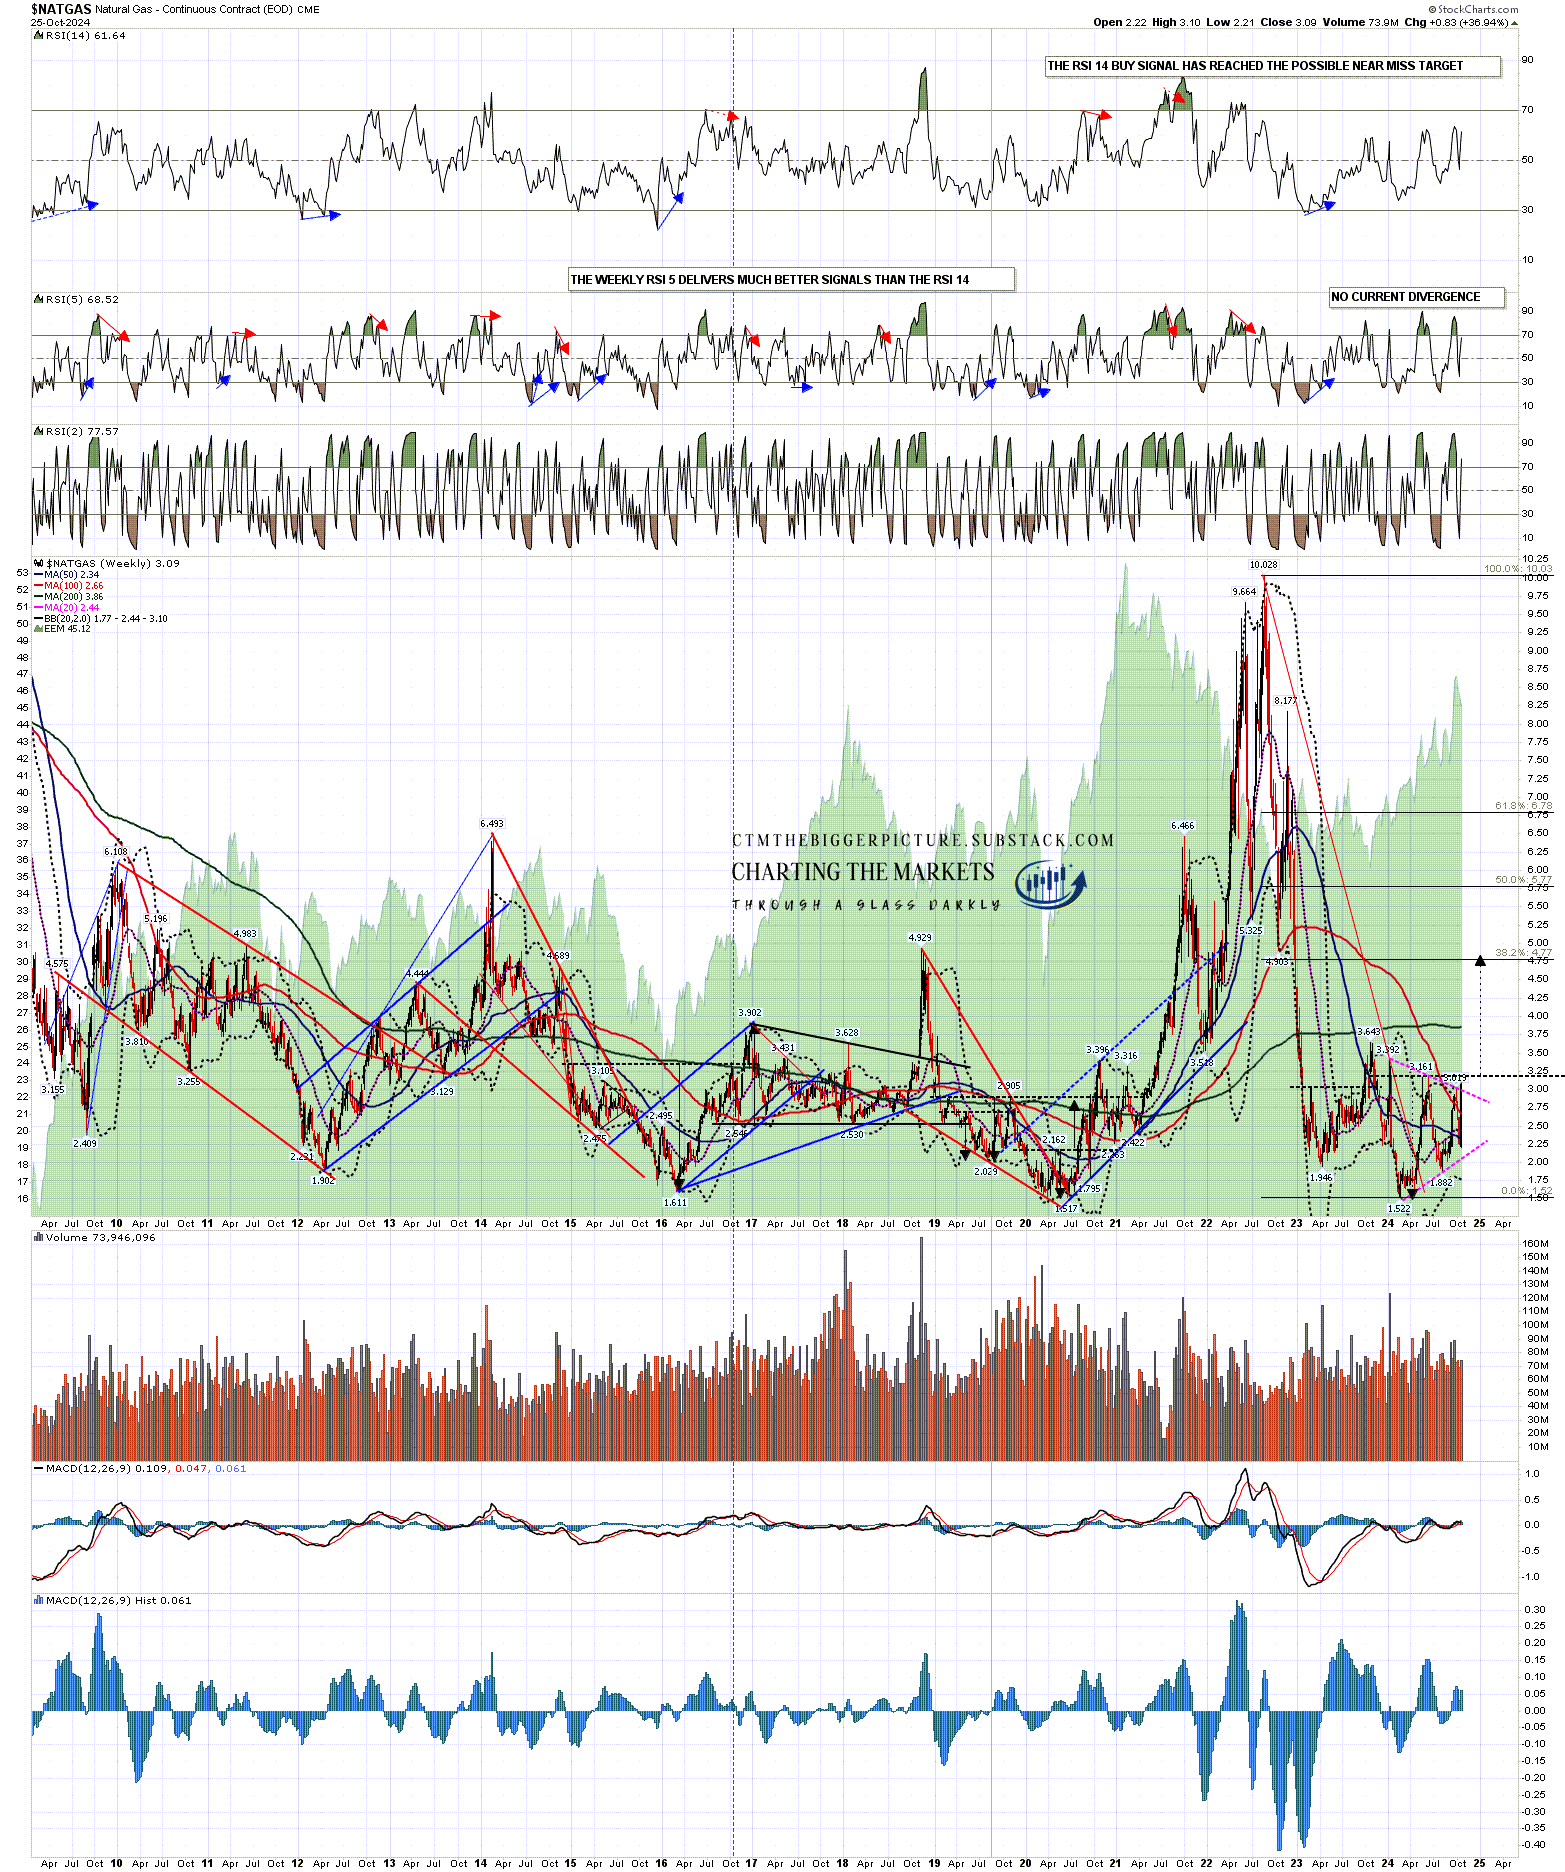
Why am I thinking we might still see a retest of the Feb 2024 low at 1.52? Well it would make a very nice second low of a double bottom on my NATGAS index chart, at a really good support level, and we might then see a reversal there back into the $4.75 to $5 area over the following year or two. That kind of move will generate some nice long opportunities, even if NG is really too hard a long to hold continuously over a long period.
NATGAS weekly chart:
Have we seen setups and moves like this before on natural gas? Most definitely, and to illustrate that I’m going to post a review of an even more impressive move on natural gas I was looking at in the past that was akin to this and delivered beautifully. If I have time I’ll post that over the coming week.
Just to mention, I’m going to start doing a post every week or two reviewing a single instrument that I cover in my futures and currencies charts on multiple timeframes to sketch out the higher probability paths going forward. The next two will most likely be the US Dollar index and longer term bonds, but after that I’ll be looking at metals, other commodities, major currency pairs and so on. Don’t forget to subscribe for free to my substack if you’d like to see those.
If you like my analysis and would like to see more, please take a free subscription at my ctmthebiggerpicture substack, where I will be publishing my posts covering other than equities or crypto, and where I do my The Bigger Picture webinars on Sunday and Wednesday nights.
If you like my analysis and would like to see more of my work on equity indices, please take a free subscription at my chartingthemarkets substack, where I publish my equity index posts, and do a short general premarket review every morning.
If you like my analysis and would like to see more of my work on crypto, please take a free subscription at my ctmcrypto substack, where I publish my crypto posts, and do a short crypto premarket review every morning.