
I read a few days ago that John Cleese was saying that politics in the US nowadays seems like an endless Monty Python sketch, and he has a point. Before I look at the US equity markets today I just want to reflect on the bizarre nature of the news we are watching nowadays.
In the ‘special military operation’ in Iran it is now clear that there were never any negotiations with Iran since the war started, and it isn’t even clear that the US wanted any talks, as the person preparing to negotiate on the Iranian side, former Iranian foreign minister Kamal Kharazi, was seriously wounded in a US/Israeli attack on his Tehran home three days ago. If he survives, his enthusiasm for future negotiations might be somewhat dampened by his wife’s death in that failed assassination attempt.
Trump declared on Saturday on Truth Social that there were only 48 hours left of the ten day pause he gave to the Iranians, and if there is no ‘deal’ in that time, which frankly seems doubtful, then he would rain down hell on the civilians of Iran. Since then he has said in another ‘Truth’ that he will now not start bombing Iran ‘back to the Stone Age’ until Tuesday (tomorrow).
Obviously that would likely be a war crime but perhaps, with the two world leaders Trump seems to respect most, Netanyahu and Putin, not necessarily in that order, both having open warrants out for their arrest for war crimes by the ICC in the Hague, that may nowadays seem more a badge of honor than a brand of shame. Certainly it has not stopped inviting both of them onto his Board (or Bored?) of Peace in a move that seems almost beyond parody.
In the meantime Trump has at various times recently declared that the regime has already been changed in Iran, that he has never been more beloved by US voters, that the USA has never been more respected in the world, that he will be conquering Cuba next, and is asking for an almost doubling of the 2024 defence budget to $1.5trn in 2027, while explaining in a speech last week, that was very briefly publicly posted by the White House, that the federal Government could no longer afford non-military expenses like Medicaid, Medicare or childcare in future as it needs to focus on war.
It is all madness of course, but nowadays also just another weekend in 2026. These are strange days.
On to the markets, where I am giving 10% odds that there is any kind of a deal with Iran before Tuesday, after which the Iran War is currently scheduled to escalate considerably. That being the case the path downwards on SPX, QQQ, DIA and IWM is clear and, unless peace breaks out unexpectedly, all those targets are likely to be reached within weeks.
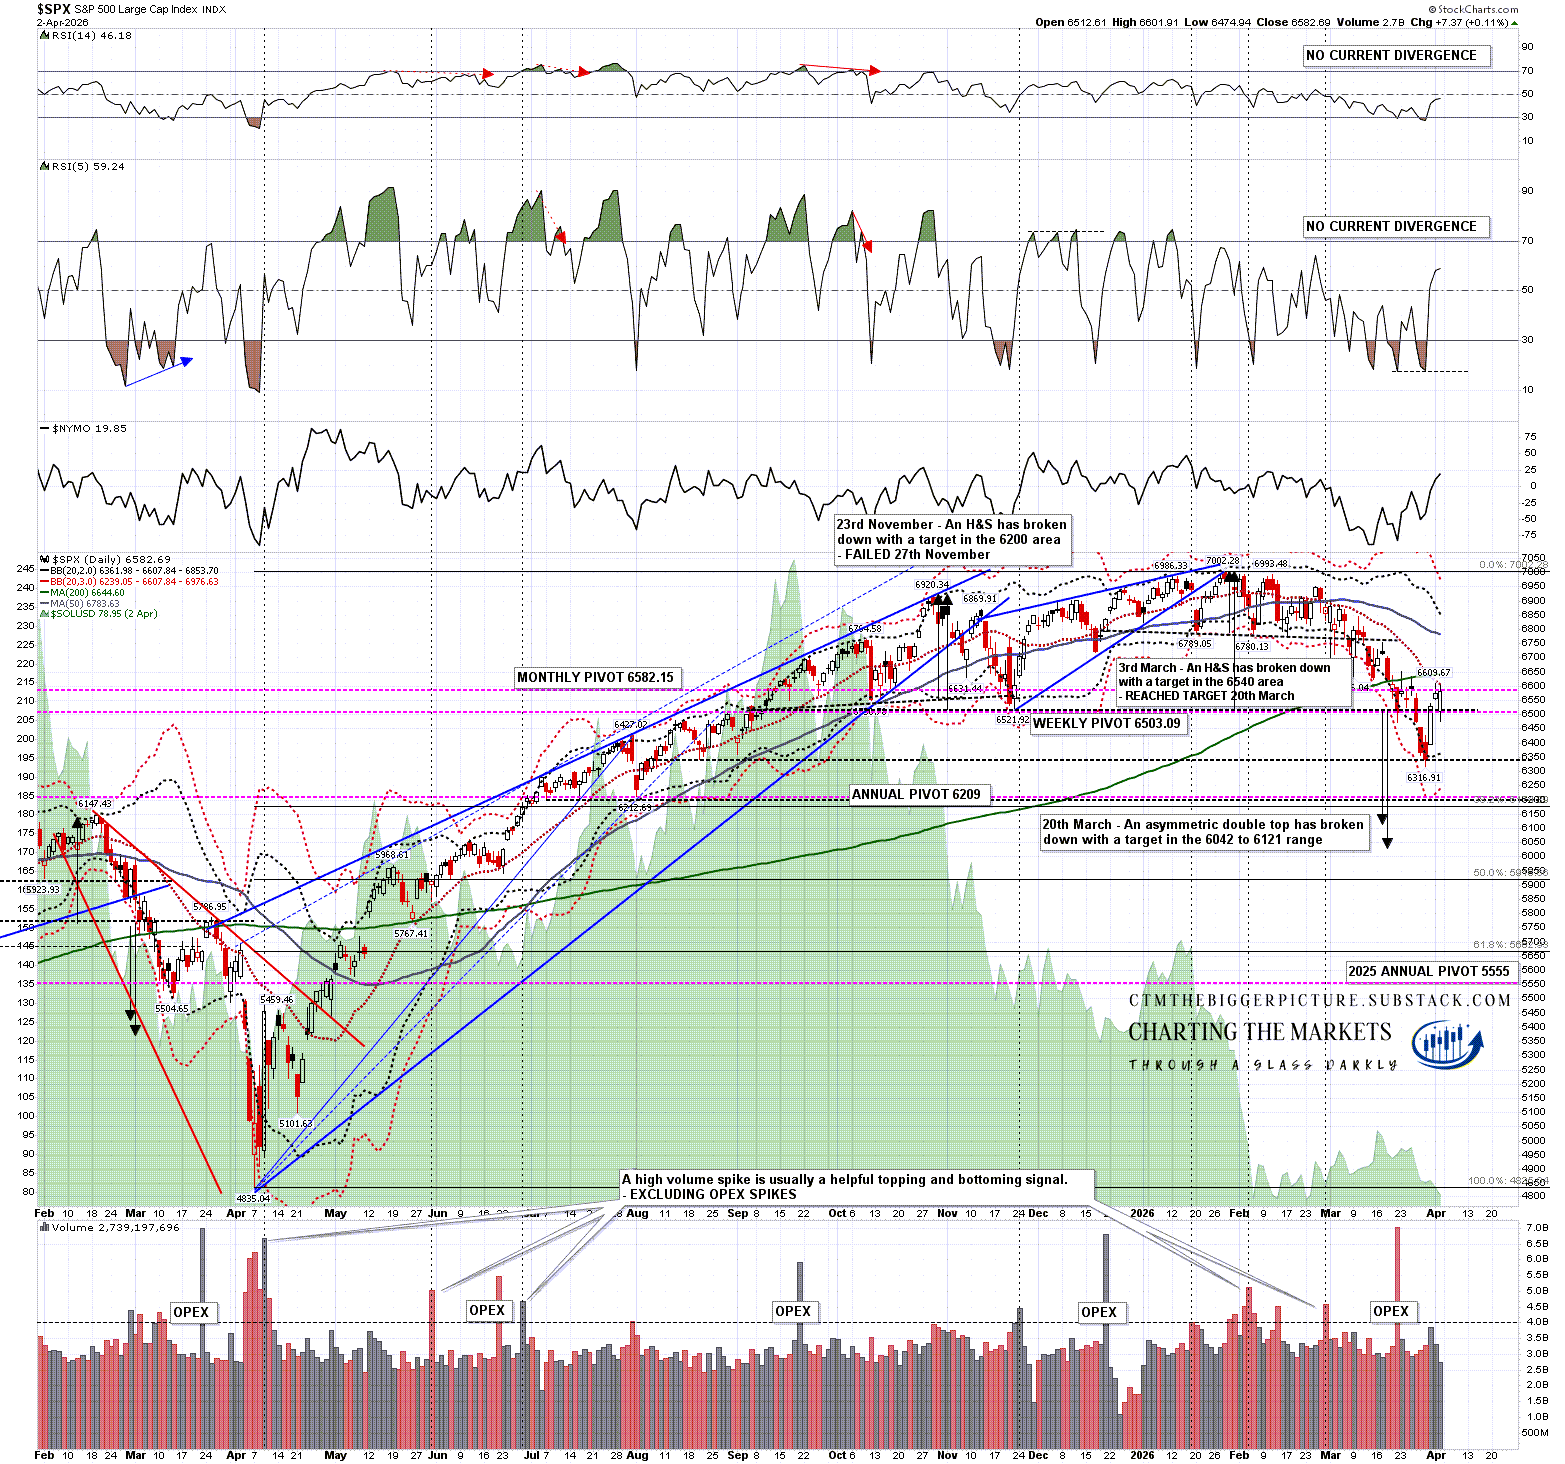
On SPX a decent quality asymmetric double top broke down on Friday 20th March. The double top target is in the 6042 to 6121 range.
The downtrend looks solid with the break down below the 200dma, currently in the 6645 area, broken on Thursday 19th March and backtested as resistance shortly afterwards. More recently the daily middle band, currently in the 6607 area was backtested and held as resistance on Wednesday and Thursday last week. The double top target range is slightly above the 50% retracement of the rising wedge from the April low last year.
SPX daily chart:
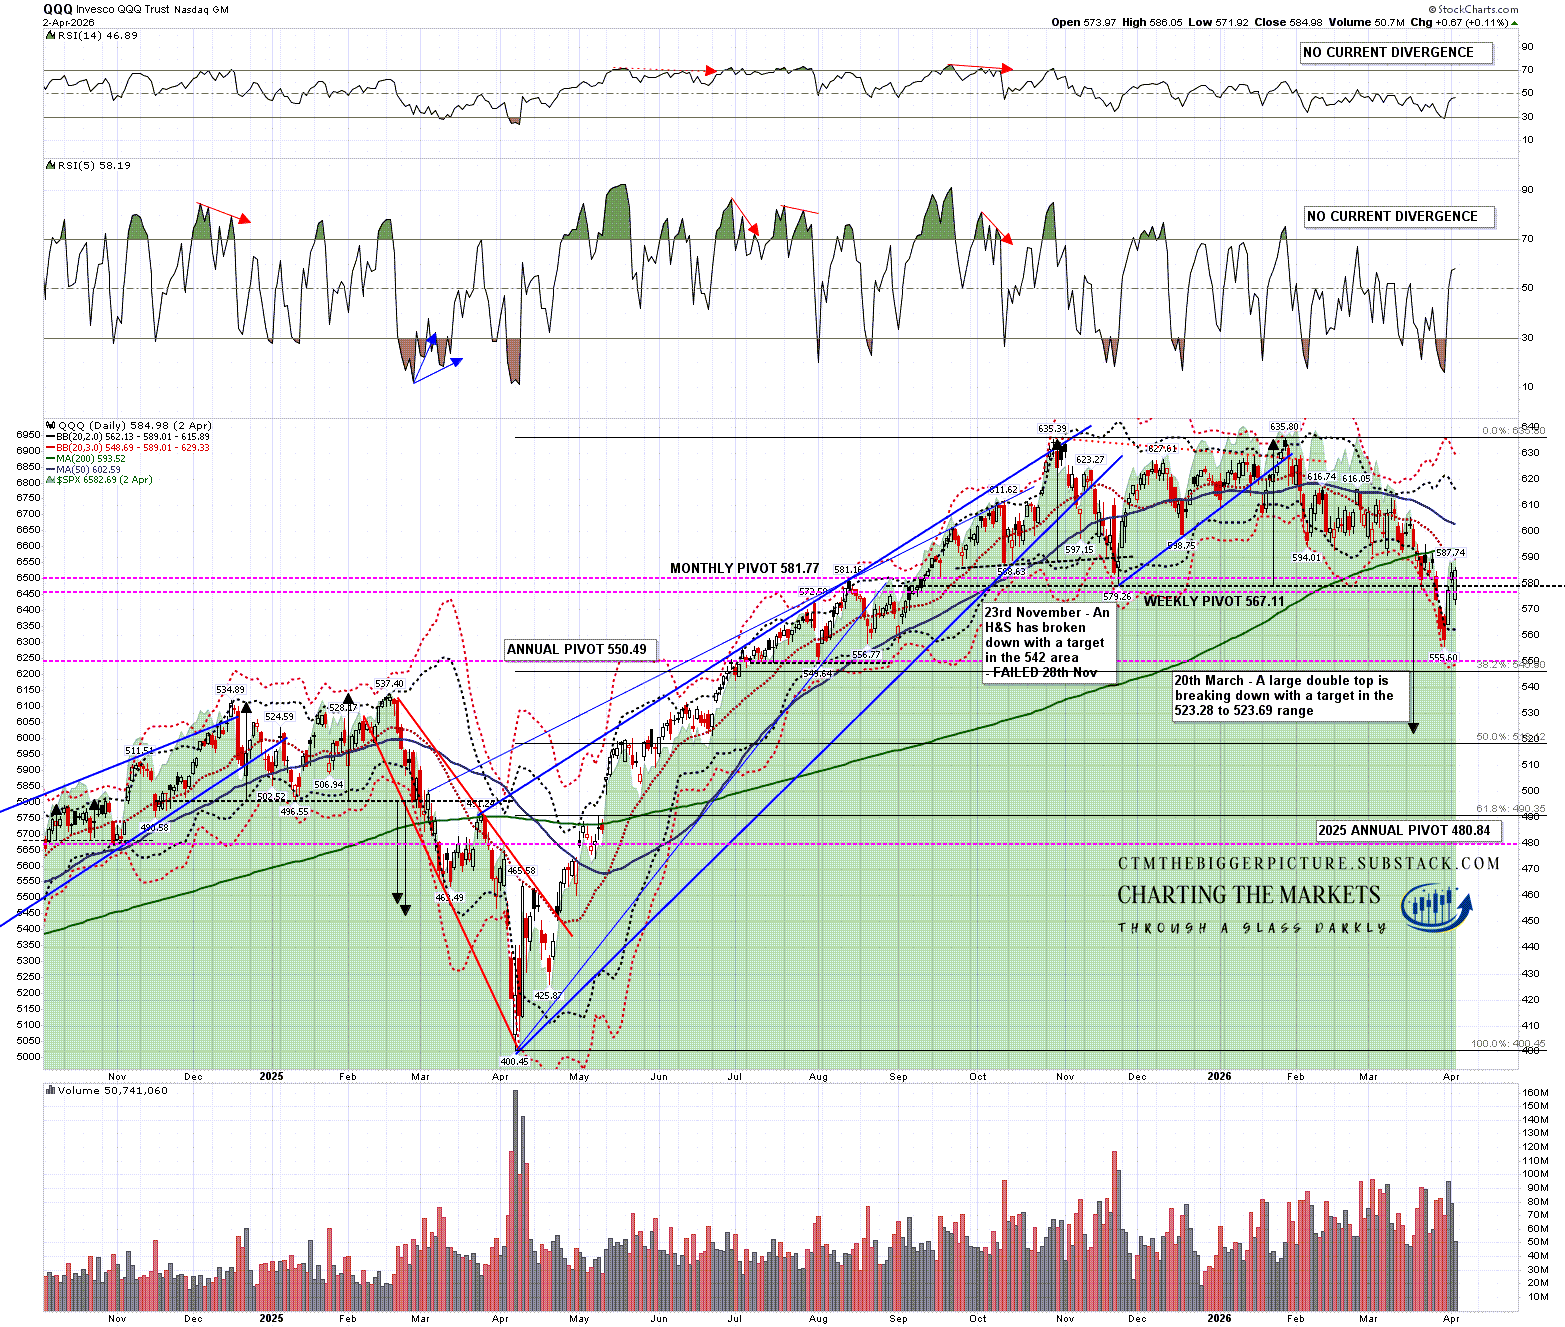
On QQQ a double top also broke down on Friday 20th March with a target in the 523-4 range.
The downtrend looks solid with the break down below the 200dma, currently in the 593 area, broken on Friday 20th March and backtested shortly afterwards. More recently the daily middle band, currently in the 589 area was backtested and held as resistance on Wednesday and Thursday last week. The double top target range is slightly above the 50% retracement of the rising wedge from the April low last year.
QQQ daily chart:
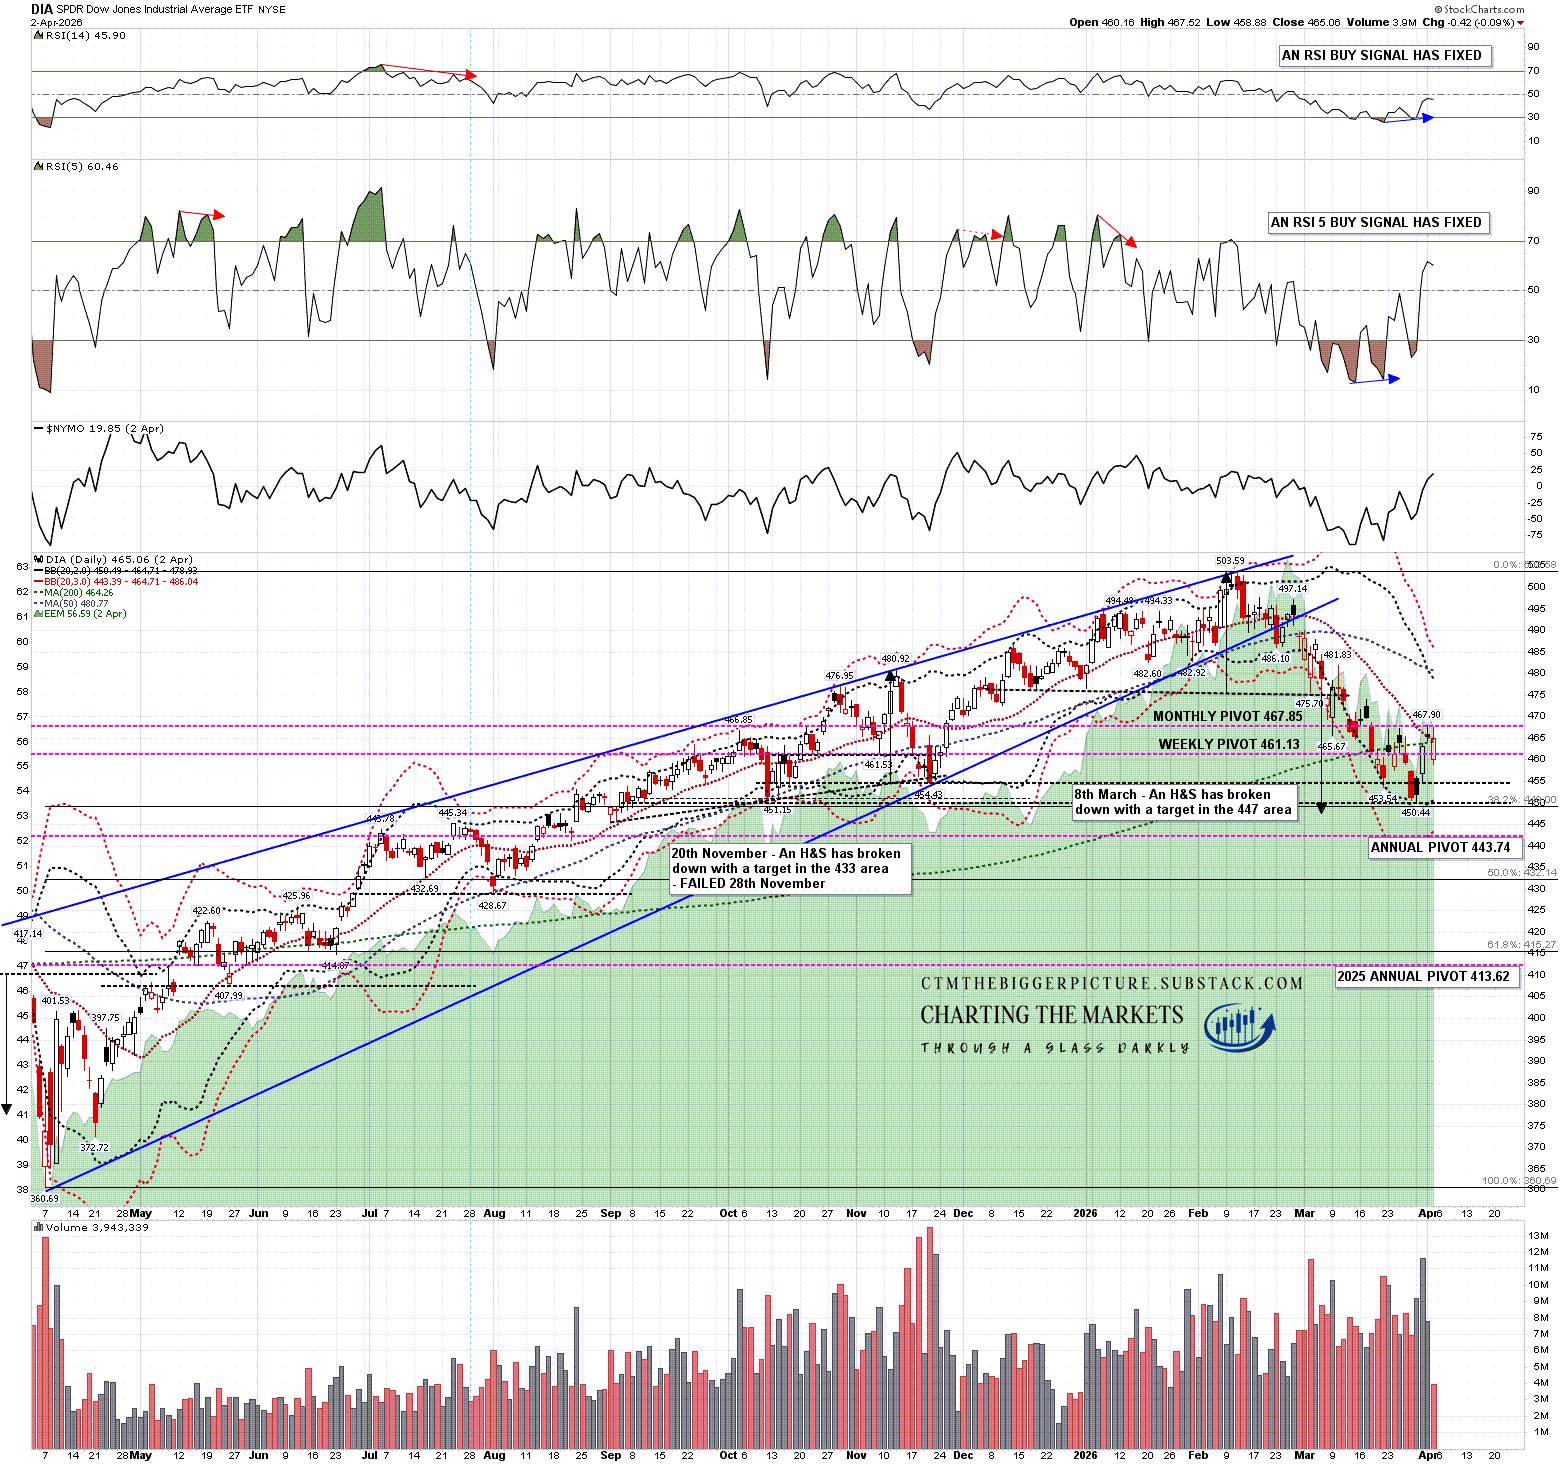
On DIA an H&S broke down on 8th March with a target in the 447 area, and the low on Friday 27th March was 450.49, close to that target.
I was watching in my last post for a possible right shoulder rally from that area that could form a right shoulder on a larger H&S, and we saw that. A sustained break below 450 would therefore look for a target in the 397 area. This is a lower target than on the other indices and would likely take longer to reach.
The daily middle band was aggressively tested as resistance on Wednesday and Thursday last week and have held so far. A daily RSI 5 buy signal fixed at the start of last week but in a strong downtrend these signals are often just run over by the trend.
DIA daily chart:
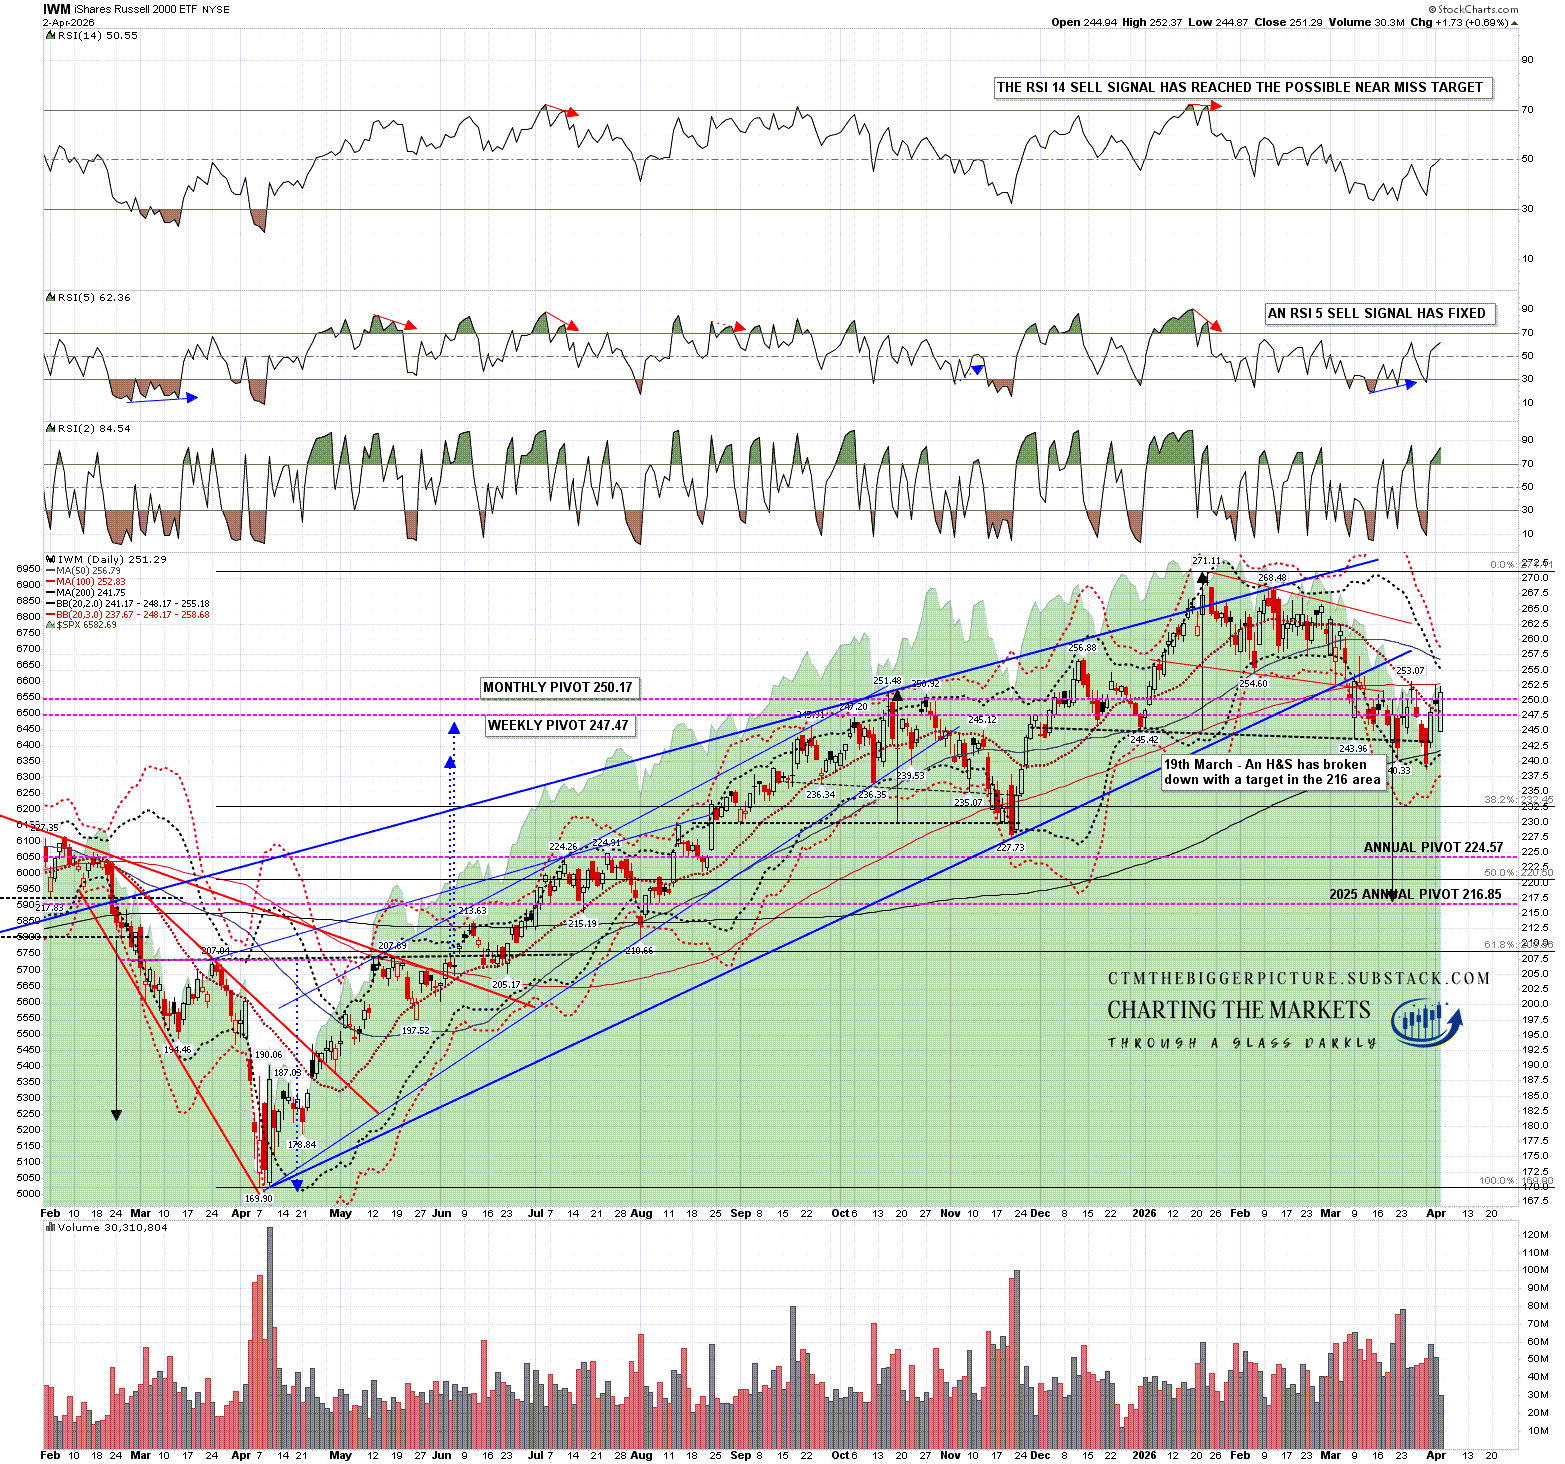
IWM broke down from an H&S on Thursday 19th March with a target in the 216 area, slightly below the 50% retracement of the rising wedge from the April low last year.
IWM broke above the daily middle band, currently in the 248 area and closed above again on Friday. If, as seems likely, all these equity indices are going to fail into lower targets then I’d be looking for a close back below the daily middle band today or tomorrow.
A daily RSI 5 buy signal fixed at the start of last week but in a strong downtrend these signals are often just run over by the trend. A decent rally over the next few days could see that reach target.
IWM daily chart:
The Iran War seems very likely to intensify in the short term and that is likely to send oil prices up and equity prices down. Much suffering is likely to be caused in Iran by US bombing but is unlikely to matter much strategically. The Iranians don’t have to win this war, all they need to do is survive.
The US won every battle in Iraq but still lost the war. The calculus is similar in Iran but they are much more united, almost three times the size, sitting in terrain that strongly favors the defender, and able to close not only the Strait of Hormuz but likely also the arguably even more important Bab al-Mandab that is currently taking a lot of displaced Strait of Hormuz traffic and is also a vital waterway for the Suez Canal. If both are closed then world trade will be badly affected and we will likely see oil prices break over $200 per barrel.
If you like my analysis and would like to see more, please take a free subscription at my chartingthemarkets substack, where I publish these posts first. I also do a premarket video every day on equity indices, bonds, currencies, energies, precious commodities and other commodities at 8.45am EST, but only for paying subscribers. Other places to find me are my page on the platform previously known as twitter, and my YouTube channel.