
In my last post a week ago I was remarking at how very stretched SPX was and how near it should be to a mean reversion move, and the mean reversion high was then made within a few minutes of my publishing that post. The minimum target for that mean reversion move, last reached after the June high, is a backtest of the 45dma, and that target was reached at the low yesterday. That may of course be the low for this retracement, and I'll be looking at the setup for that today.
SPX daily vs 45dma chart:

Now a majority of mean reversion moves extend past the 45dma, and many of those reach the larger mean reversion target at the 200dma, which closed yesterday in the 3094 area. There is a setup for getting there and if that target is to be reached, then I'd be looking for resistance at the daily middle band, currently in the 3432 area.
SPX daily chart:
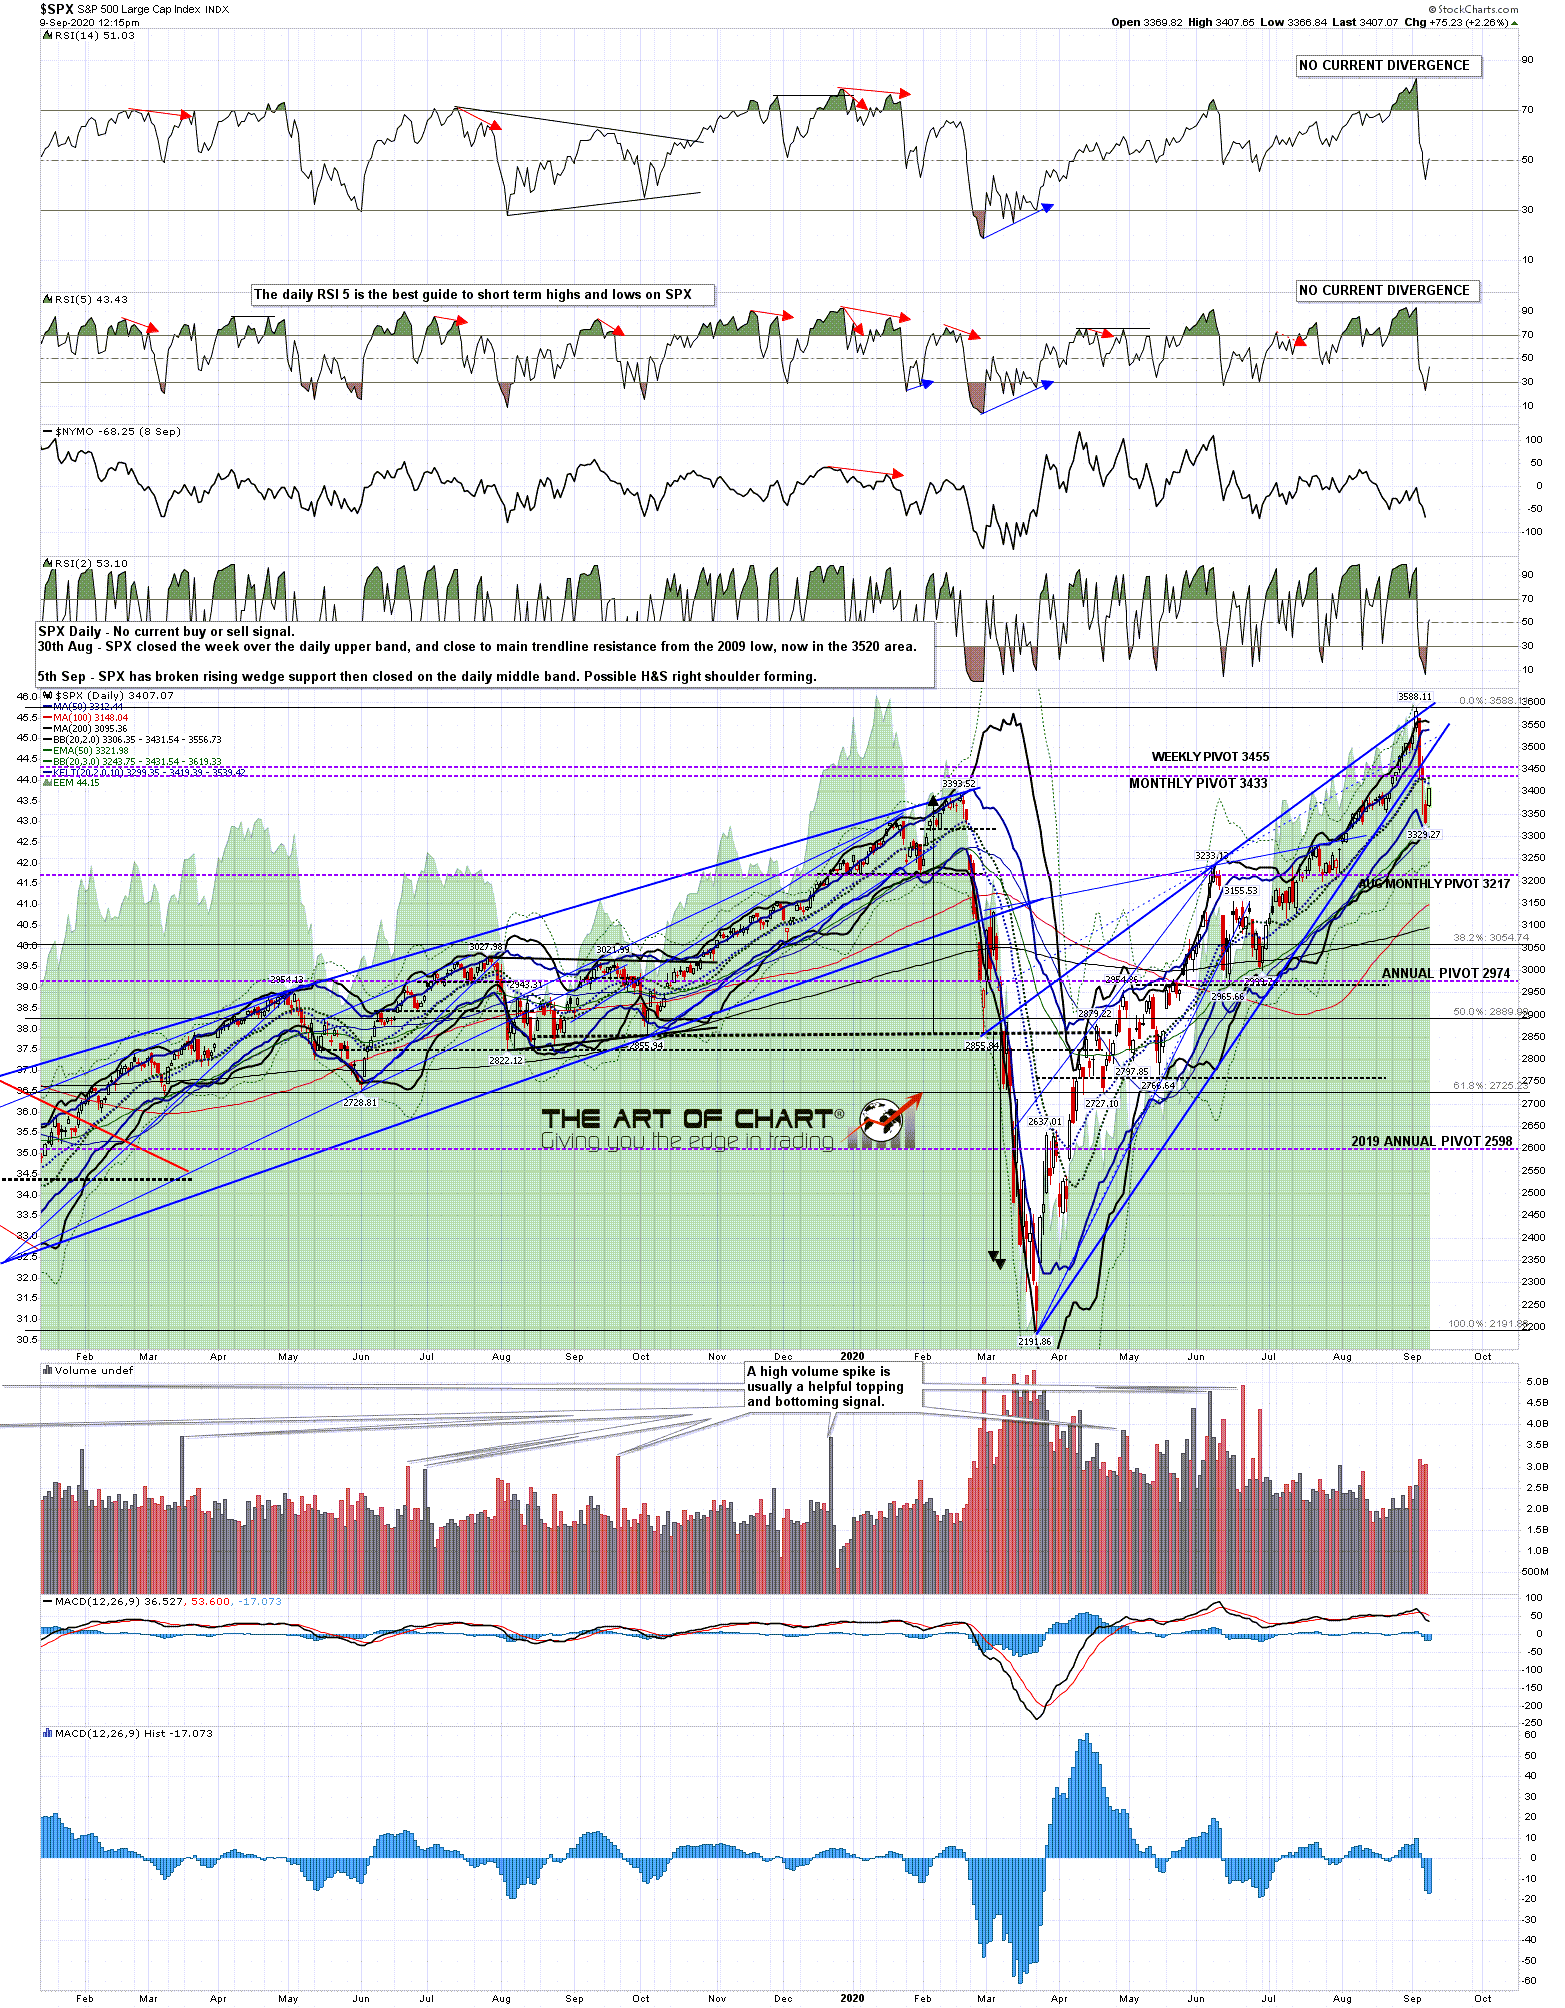
There isn't a clear overall pattern for this retracement and that is a possible argument for going lower. There is a termination falling wedge at the end of the move but that might just be the end of wave A, with a possible C wave down still to come. There is however a decent quality nested double bottoms setup that may deliver a retest of last week's highs, and the smaller double bottom has broken up today with alternate targets at either 3420 or 3430. With the daily middle band now just above 3430, that is a very attractive short term target. On a subsequent sustained break over larger double bottom resistance at 3455, the double bottom target would come close to a retest of last week's highs.
SPX 5min chart:
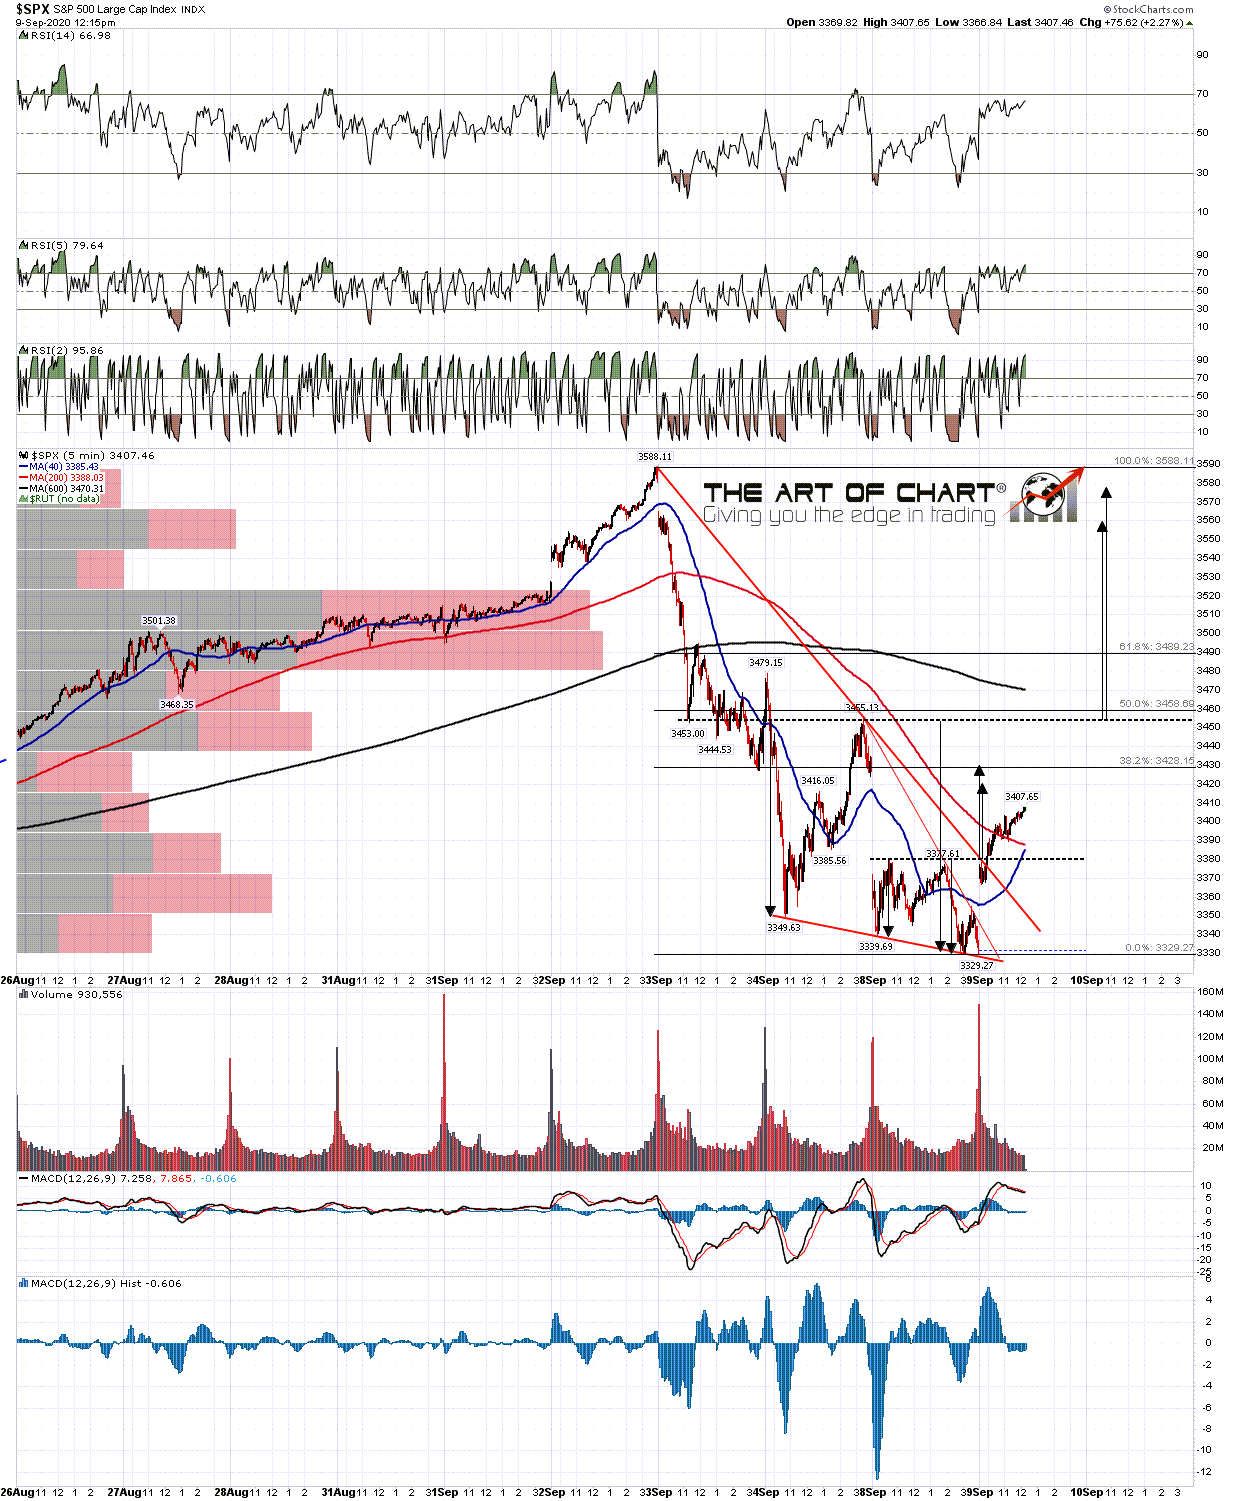
On the SPX hourly chart there are two things of interest here. The first is the decent quality H&S that broke down yesterday with a target in the 3110 area. At this point there are two main options, either that SPX continues down towards that target, or that the H&S fails on a move back over the right shoulder high at 3455, in which case I'd be looking for a retest of last week's high. The second is the hourly RSI 14 buy signal that fixed this morning, boosting the case for that rejection back into the high.
SPX 60min chart:

So what happens if SPX retests the high, bearing in mind that over 60% of SPX highs and lows involve some kind of retest. Well last week I was looking at the huge long term resistance trendline that SPX was spiking over then, and noted that if that break over resistance was to fail, what I'd want to see would be a fast and hard rejection, which we then saw immediately afterwards. If that high was now to be retested I'd be therefore leaning strongly towards that being the second high of a double top, which of course would have a target fairly close to the 200dma. SPX weekly chart:

Overall this all looks like topping action for last week's high, and often topping action involves a high retest, which may be next. On the bigger picture I was looking back at highs which were even more stretched that the June and August highs this year and the only two I located quickly, so there may be another on closer inspection, were the slightly more stretched highs in June 2009 just after the bear market low, and the 2000 bull market high. Last week's high may be a very significant high and I'll be watching any high retest with that in mind.
No comments:
Post a Comment