
I was going to do a longer post today but I've decided to split the post in two, covering the longer term in this post and looking shorter term in a follow up post to be published tomorrow.
In my last post I was looking, among other things, at the SPX monthly chart and noting that if there was a monthly close significantly above the monthly upper band (currently 3570 area) at the end of November, then that would be the first time in the last twenty five years that had happened less than six months after a recent strong punch close above the monthly upper band (in August). The monthly close for November is at the close on Monday, so that is now only just over a trading day away in regular trading hours. Could it happen? Yes, and this has certainly been a very strange year both in the world and on the markets so we'll see.
SPX monthly chart 25 Yr: 
It isn't the case on every chart that monthly upper band punches deliver minimum consolidations lasting several months, there are three or so exceptions on the Dow Industrials chart in the last 25 years, and on the NDX longer term chart there are twelve similar punches over the last 25 years and five of those delivered monthly upper band rides going quite a bit higher. What I would say is that such a break would be bubbly looking action on SPX, given that this hasn't happened in the last quarter century, a period that includes at minimum two asset bubbles into the 2000 and 2007 highs.
NDX monthly (LOG SCALE) chart 25 Yr: 
One thing to add here is that I've said quite a few times over the years that in my view LOG scale charts are greatly overused and I only see a few charts where these are obviously a good choice. These tend to be the longer term charts and the NDX monthly is a good example. I would note that NDX is testing possible channel resistance on this chart and I have very much seen this kind of LOG scale pattern deliver before.
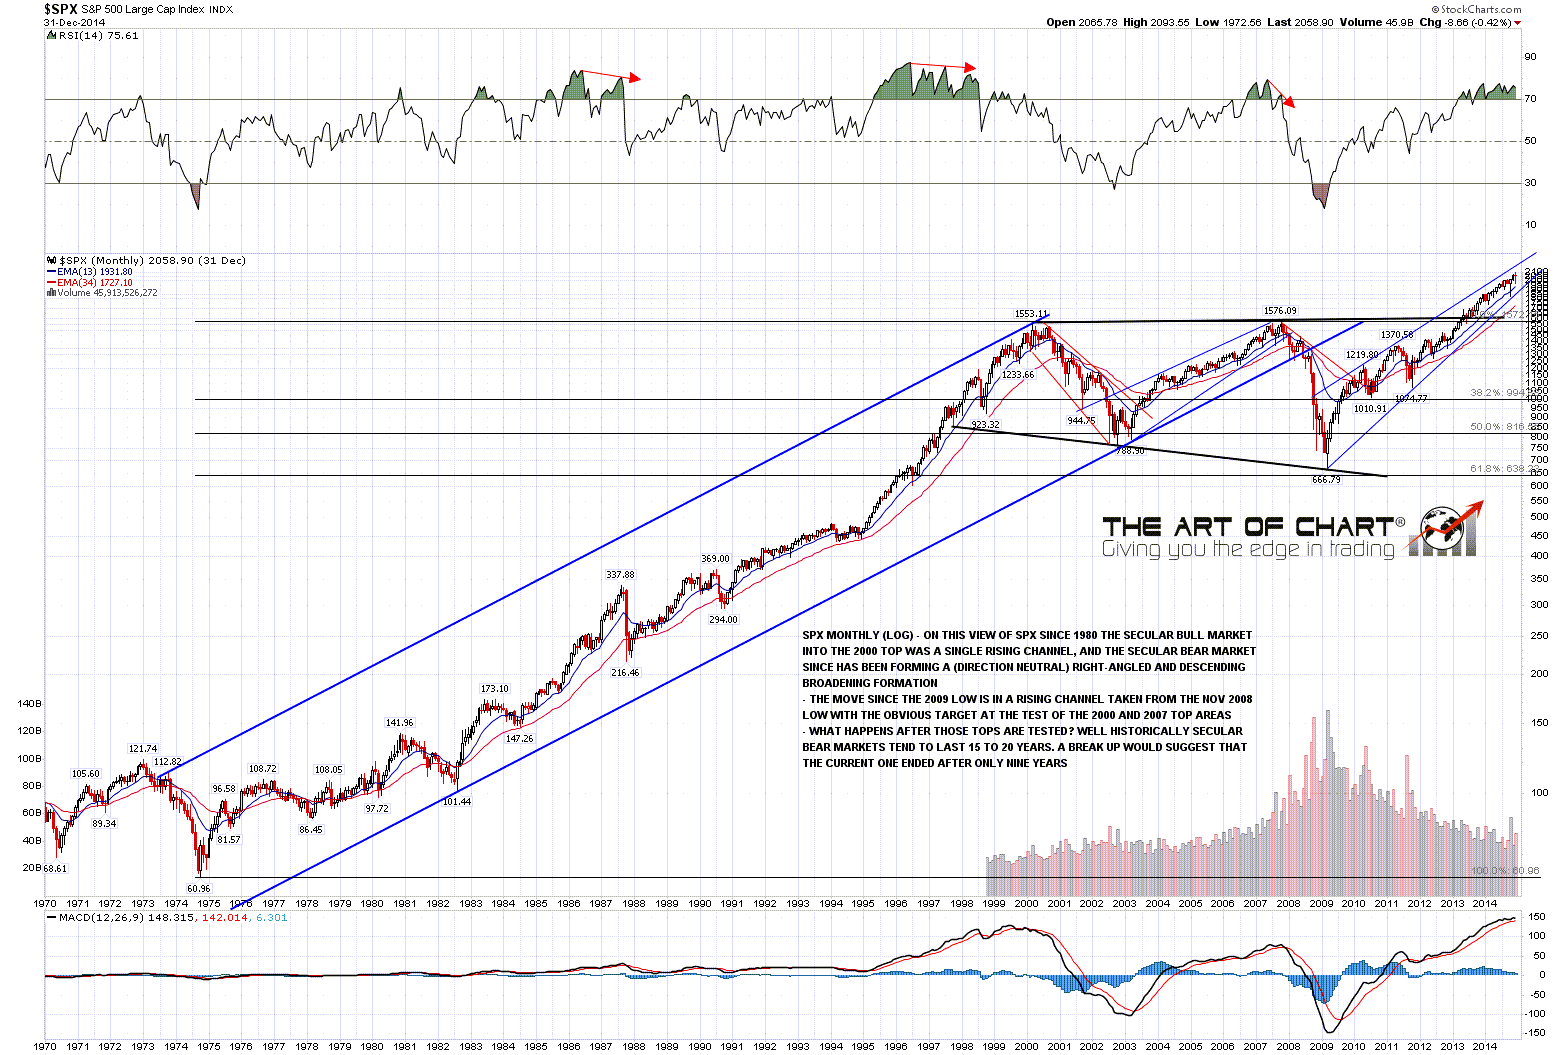
Where would that be you might ask, and one great example is below with the beautiful 26 year channel that captured the whole of the secular bull market on SPX from the low in 1974 to the high in 2000, so I'm watching that NDX channel with great interest. We'll see whether that candidate channel resistance trendline holds.
On another point of interest if you take the secular bear market low in 1974 to the secular bear market low in 2009, you can see that the 2009 low was slightly more than ten times higher than the 1974 low. Equally, looking at the chart it seems clear that a new secular bear market started at the 2009 low. If this was to repeat exactly with the current secular bull market, which is unlikely but simply for the sake of argument, that would suggest the next secular bear market high would be in about the year 2135 in the 21000 SPX area, with a subsequent bear market low in the year 2144 perhaps in about the 7000 area. Thought for the day.
SPX monthly (LOG SCALE) chart:
I'll be doing a post tomorrow morning looking at the shorter term setups on SPX and NDX particular, with a look at why I think that both are likely to at least retest the current all time highs before a serious reversal is seen. I would also mention that we are running our usual Black Friday weekend sale on annual memberships at theartofchart.com until the end of November on Monday night, and that during the sale we are offering four free months on an annual membership against normal monthly prices. We never raise subscription prices for existing members as long as memberships are renewed without breaks, so if you are thinking of getting an annual membership to theartofchart.net, then this is the best time to do that.
Everyone have a great weekend and look out for my follow-up post tomorrow. :-)
No comments:
Post a Comment