
The rally from the first backtest of 3900 was over too fast to set up any possible possible divergence on the daily RSIs. That means that there are no possible daily RSI buy signals brewing on the US equity indices, and that is a strike in favor of the bears.
The inflection point here remains the same. The rally could resume from the important support in the 3900 area, or that area could fail into a retest of the 2022 lows.
SPX didn't quite make it to the daily lower band yesterday. That closed the day at 3872 and if the daily lower band ride is not ending then I'd be looking for SPX to make a lower low today and at least try to retest that.
SPX daily BBs chart:

At this point the 5dma, currently at 3948, is the most important short term resistance on SPX, because a clear closing break back above it would put SPX back on the Three Day Rule. If SPX was then to deliver a clear close back below that on either of the two subsequent days, we would then very likely see a retest of the current low, now at 3886.75 but possibly lower before that break up.
SPX daily 5dma chart:

On the SPX 15min chart there is currently a very decent quality double bottom setup here. A sustained break up over 4018.53 would look for the 4150 area. Declining resistance from the rally high is now in the 4090 area.
SPX 15min chart:

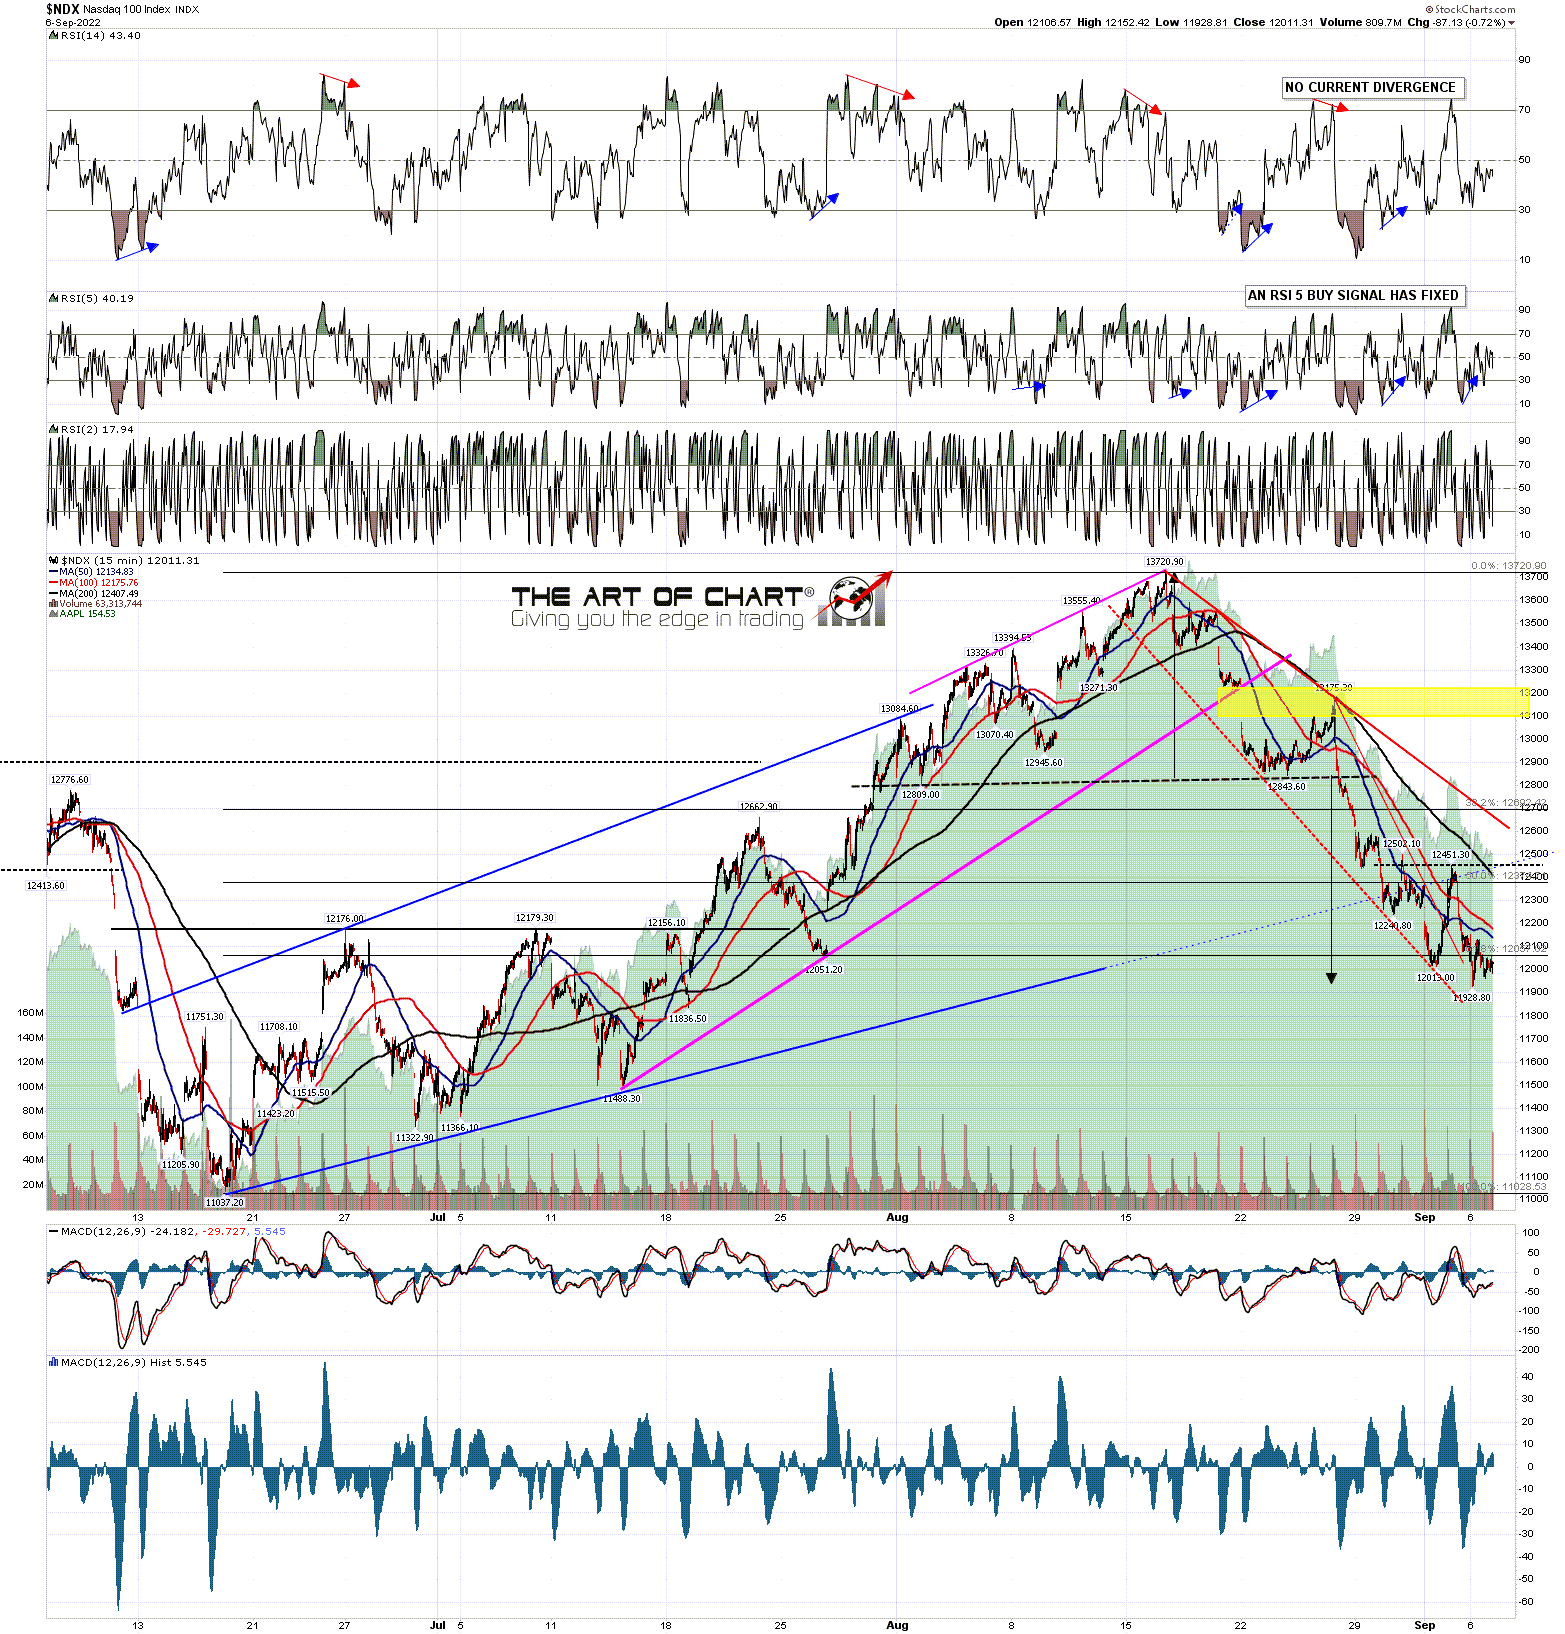
On the NDX 15min chart there is also currently a very decent quality double bottom setup here. A sustained break up over 12451.30 would look for the 12900 area. Declining resistance from the rally high is now in the 12650 area. The full H&S target from the rally high has now been reached.
NDX 15min chart:
On the IWM 15min chart there is also currently a very decent quality double bottom setup here. A sustained break up over 183.95 would look for the 199 area. Declining resistance from the rally high is now in the 189 area. The full H&S target from the rally high has now been reached.
IWM 15min chart:

Overall the setup here is leaning somewhat towards a break down, but there is some good news for bulls in the historical stats for the coming week. Historical stats for the next few days are neutral tomorrow and bullish on Friday, which leans 61.9% bullish with Monday, Tuesday and Friday next week also all leaning 71.4% bullish into Opex.
We are doing our monthly free public Chart Chat at 4pm on Sunday. It should be interesting with equities bonds and USD all at or coming into interesting inflection points here. If you'd like to attend you can register for that here or on our September Free Webinars page.
My next post should be on Friday before the open.
No comments:
Post a Comment