- WE'RE JUST RANDOM SPECKS OF DUST IN A TORNADO TO THE MARKETS .......
- CHARTISTS MUST PUT ALL BIAS ASIDE AND LET THE CHARTS DO THE TALKING OR WE'LL SEE ONLY WHAT WE WANT TO SEE
- This blog has a copy of all header posts that I publish anywhere, so that those interested in seeing what my thoughts are on the markets can find them easily.
- I will be answering questions and responding to comments, so feel free to respond to any posts and I will see your comment even if it is not on the most recent post.
- If you're interested in seeing any intraday charts I post, I do that on twitter, and my twitter handle is @shjackcharts.
- The charts in the posts are as large as I can practically make them. if you would like to look at one more closely, click on it, and the link will take you to a larger version at screencast. If you click on that again, you will get a full page version, and can use the resizing function on your browser to enlarge parts of interest further.

Tuesday, 24 March 2026

There Is No 'I' in 'TACO'

The Iran War and the US equity markets have reached an interesting stage and I am watching with great interest to see what happens next. I’ll be reviewing the setup on equities here mainly but first I’ll review where we seem to be on the Iran war.

I was saying in my last post on Thursday 12 March that Trump had a problem in this crisis in that if he wanted to TACO here, likely by declaring victory, withdrawing US forces and moving on to something else, then the problem was that this would necessarily require some kind of agreement with Iran, and Iran, under new, younger and much angrier management, was showing no interest in talking.

That’s still the case as far as I can tell, with Iran insisting that hostilities will only cease when the US close all their bases in the Persian Gulf, and agree to pay reparations. That seems unlikely to be an acceptable outcome from the US perspective.

What complicates this further is that it seems that the US allies in the Persian Gulf are now insisting, after many and serious attacks on them by Iran during the war so far, that the US stays and finishes the job, either toppling the Iranian regime or degrading their military capabilities to an extent where they were incapable of further attacks. I understand that they may be threatening, in the event that the US pulls out without this, to end all current agreements to invest in the US and might potentially then also close all the US military bases in the Persian Gulf allies.

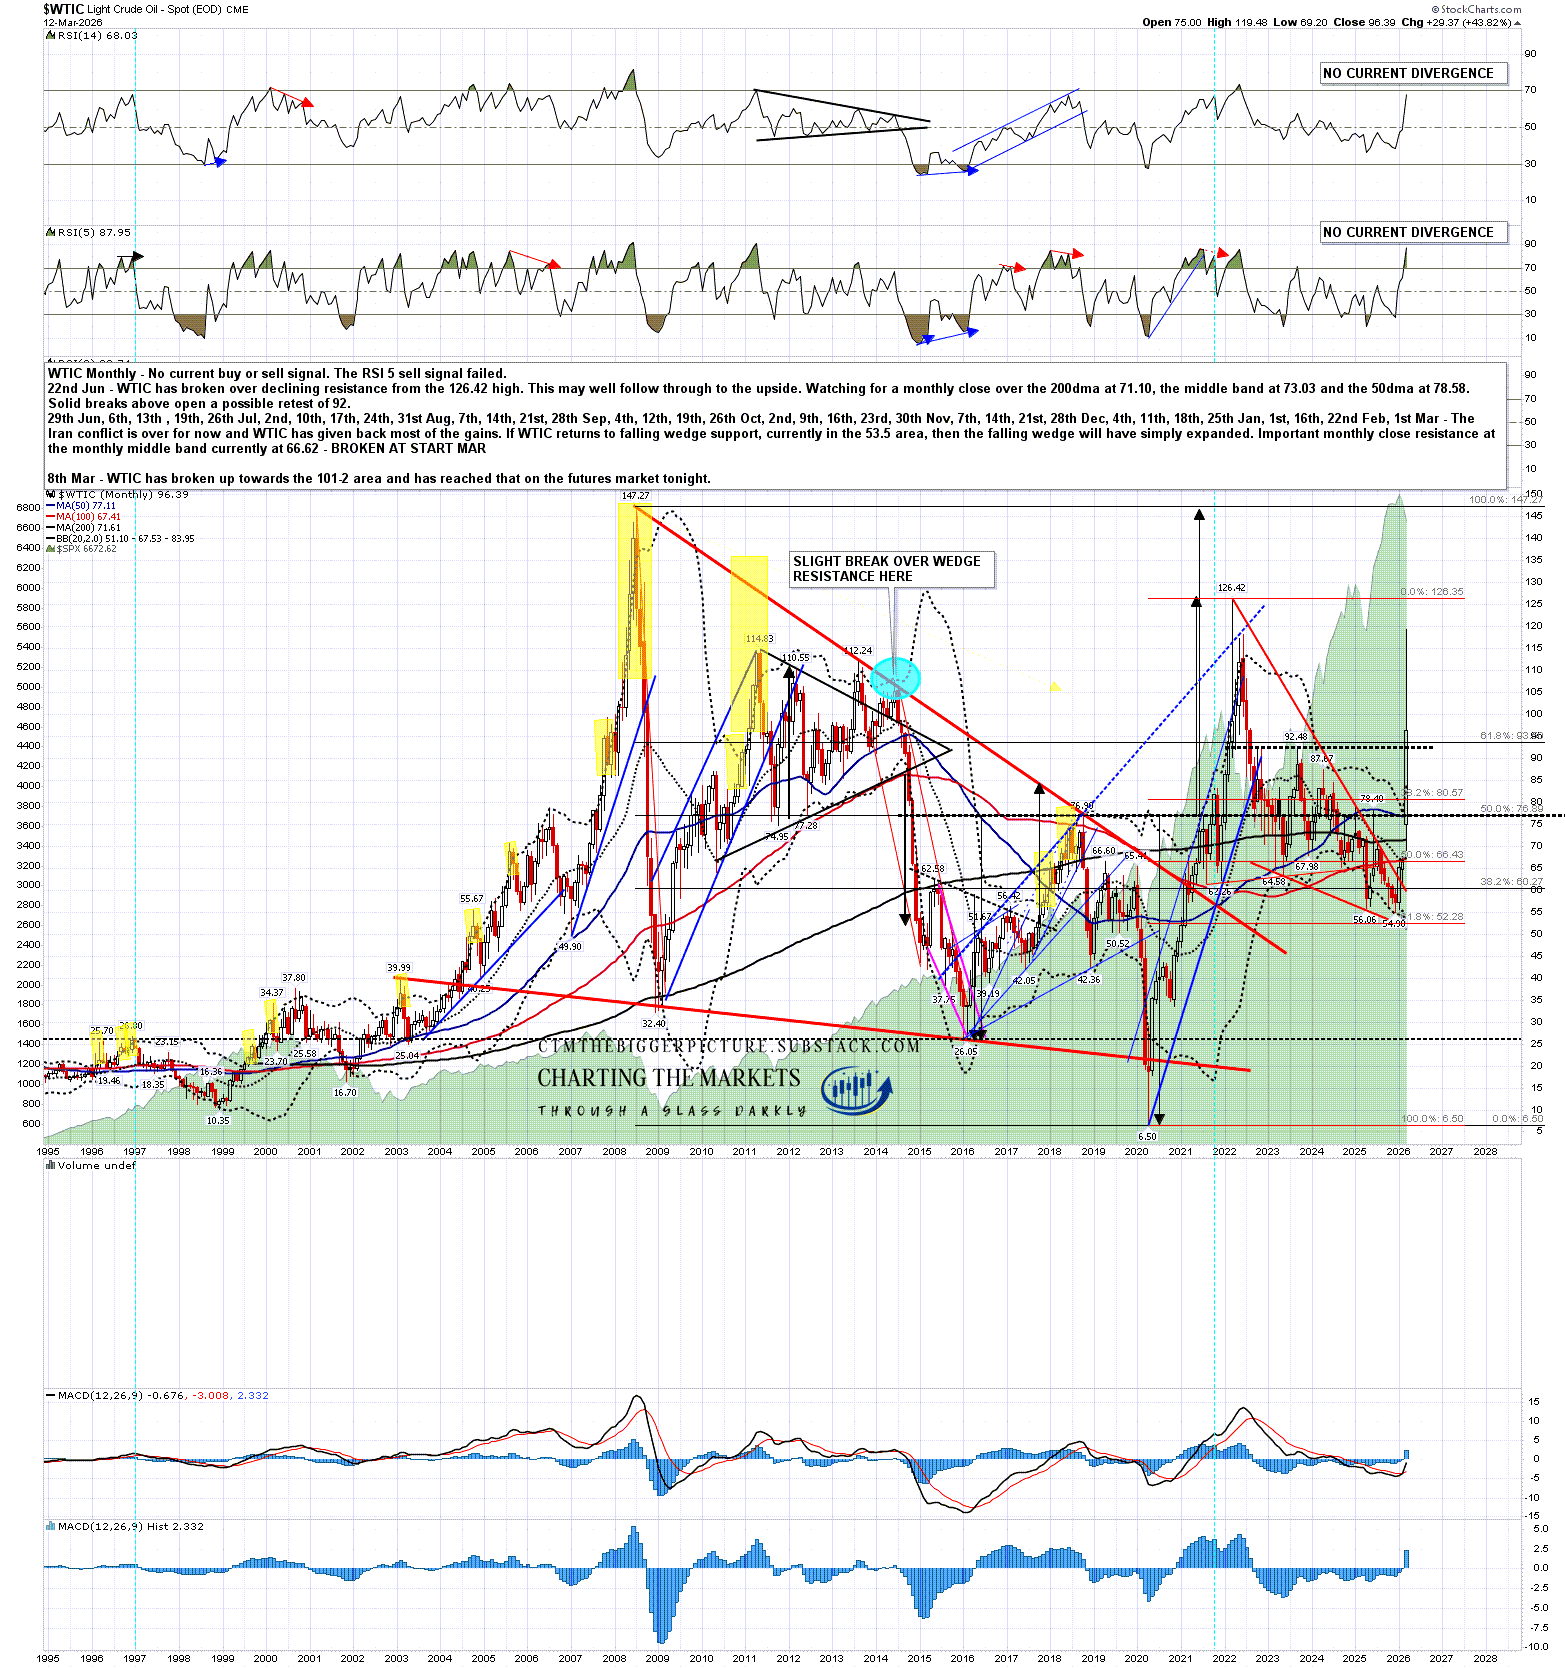
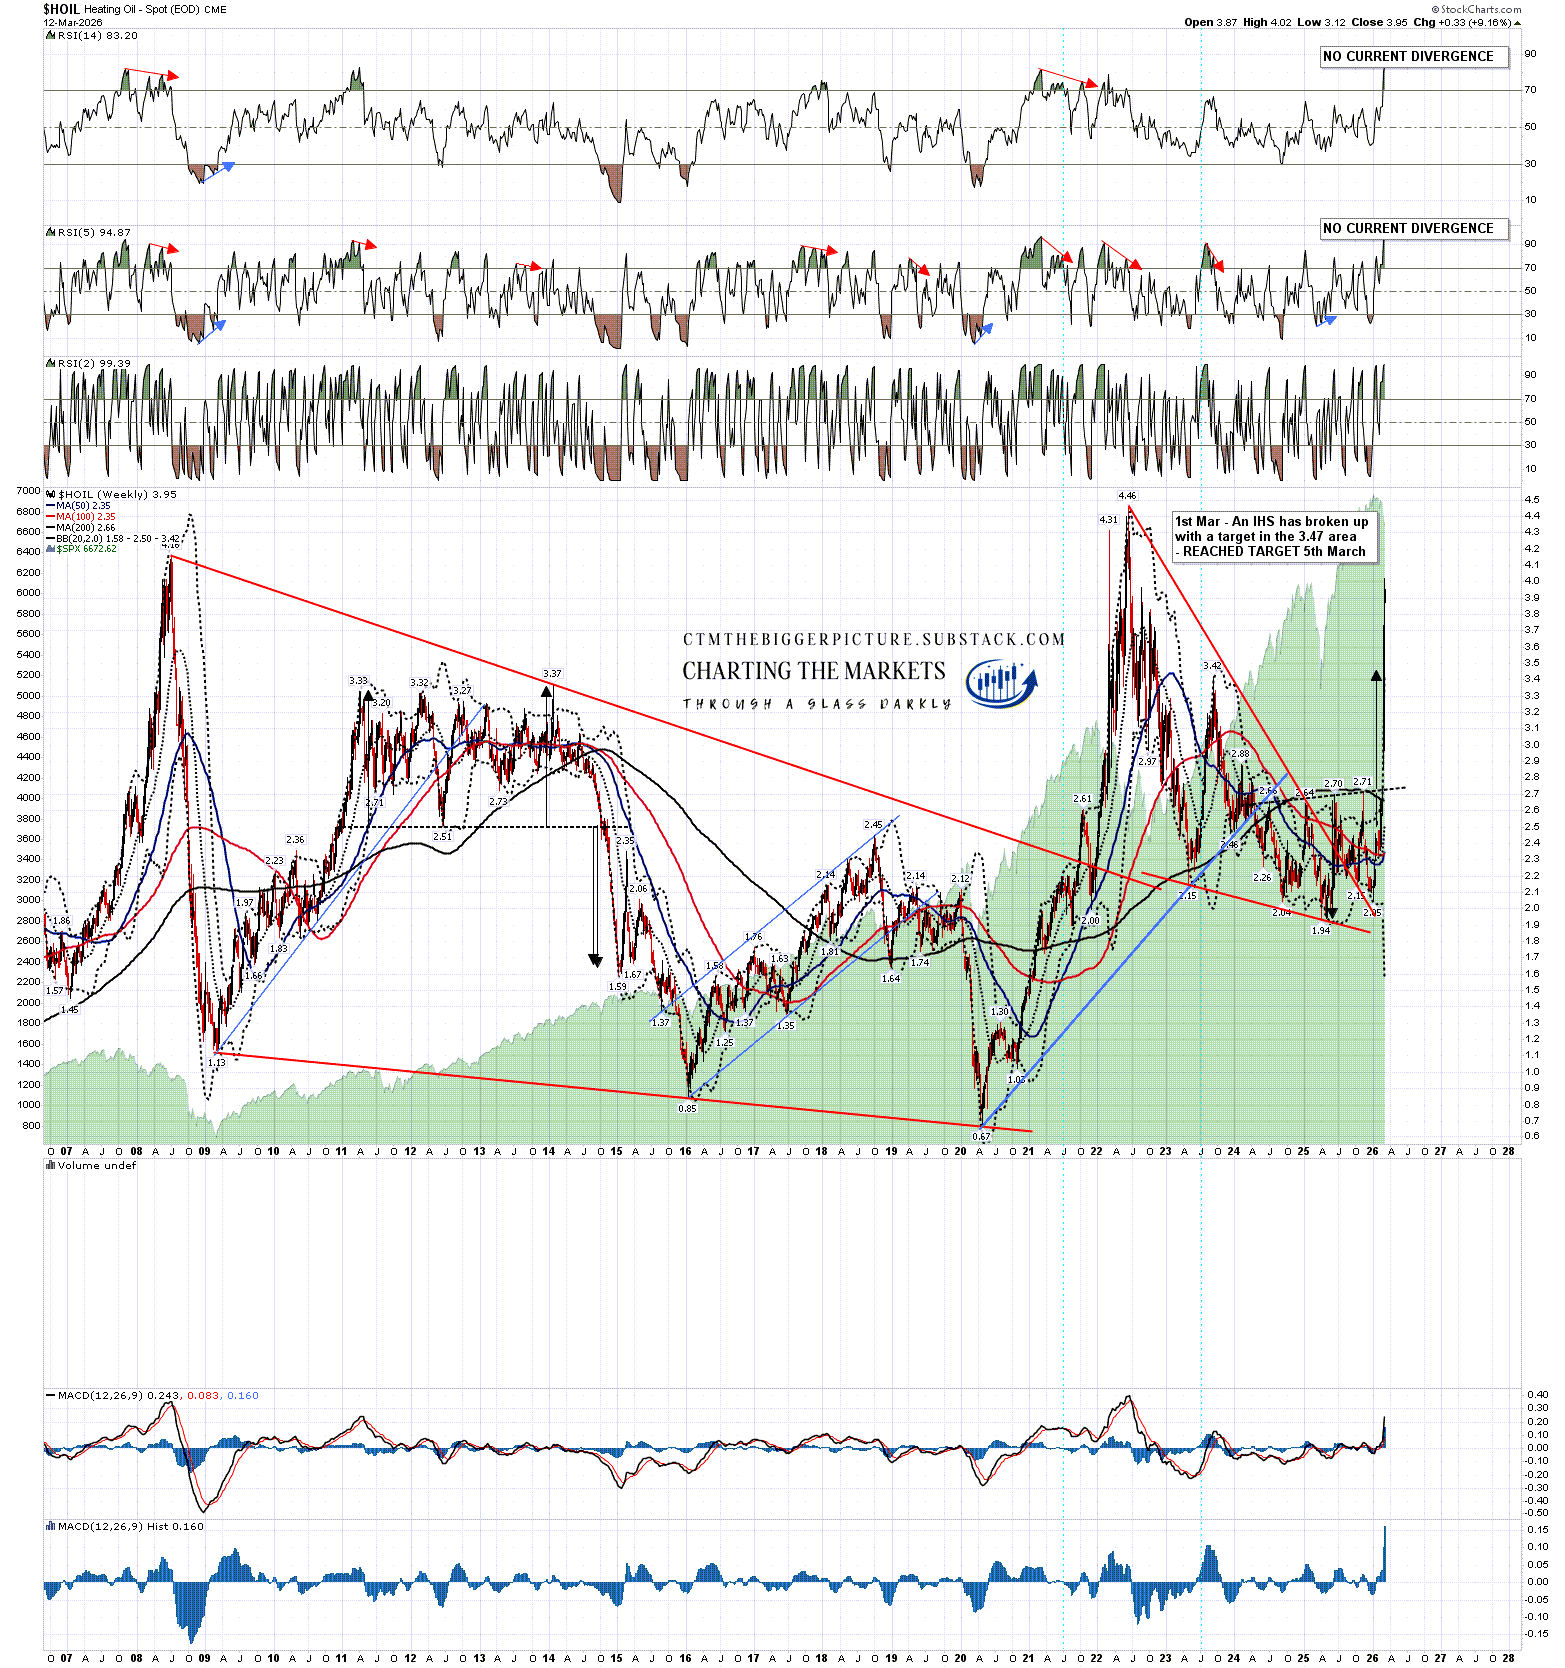
Trump and/or Israel have already attacked a desalinization plant in Iran and Iranian oil infrastructure since the war started and Trump was threatening over the weekend on Truth Social to bomb all the civilian power plants in Iran. Iran responded that in that event Iran would bomb the desalinization plants and oil infrastructure in the Persian Gulf States. If they were able to do that on a large scale that might well trigger a major multi-year world energy crisis while making much of the Middle East uninhabitable due to a lack of drinking water.

So the obvious course would be to continue the war until the regime in Iran is toppled and replaced with a friendlier one? Possibly but if that was to involve a ground invasion that would not be at all popular in the US, Iran has a population twice the size of Iraq and a geography that makes it considerably easier to defend than attack, except by air of course. This could develop into a Vietnam scenario.

Iran has been successfully invaded before, as the British and Soviets invaded from two sides and conquered (neutral) Iran in 1941 in a three month campaign, drove out the first Pahlavi Shah and replaced him with his son with the agreement to withdraw after the end of WW2. I would note though that the only other two previous successful wars of conquest against Iran I can find in the last 2700 years since Iran became a recognisable state were the the conquest by Alexander the Great in the 4th century BC and the Islamic Caliphate in the 7th century AD.

There are no obviously good options here, but the consequences if this war goes badly are clear. The worst case is that the world is plunged into an energy crisis that would dwarf the 1970s energy crisis, considerably reduce world growth, and be highly inflationary. That would likely be very bad for US equity indices and asset prices generally.

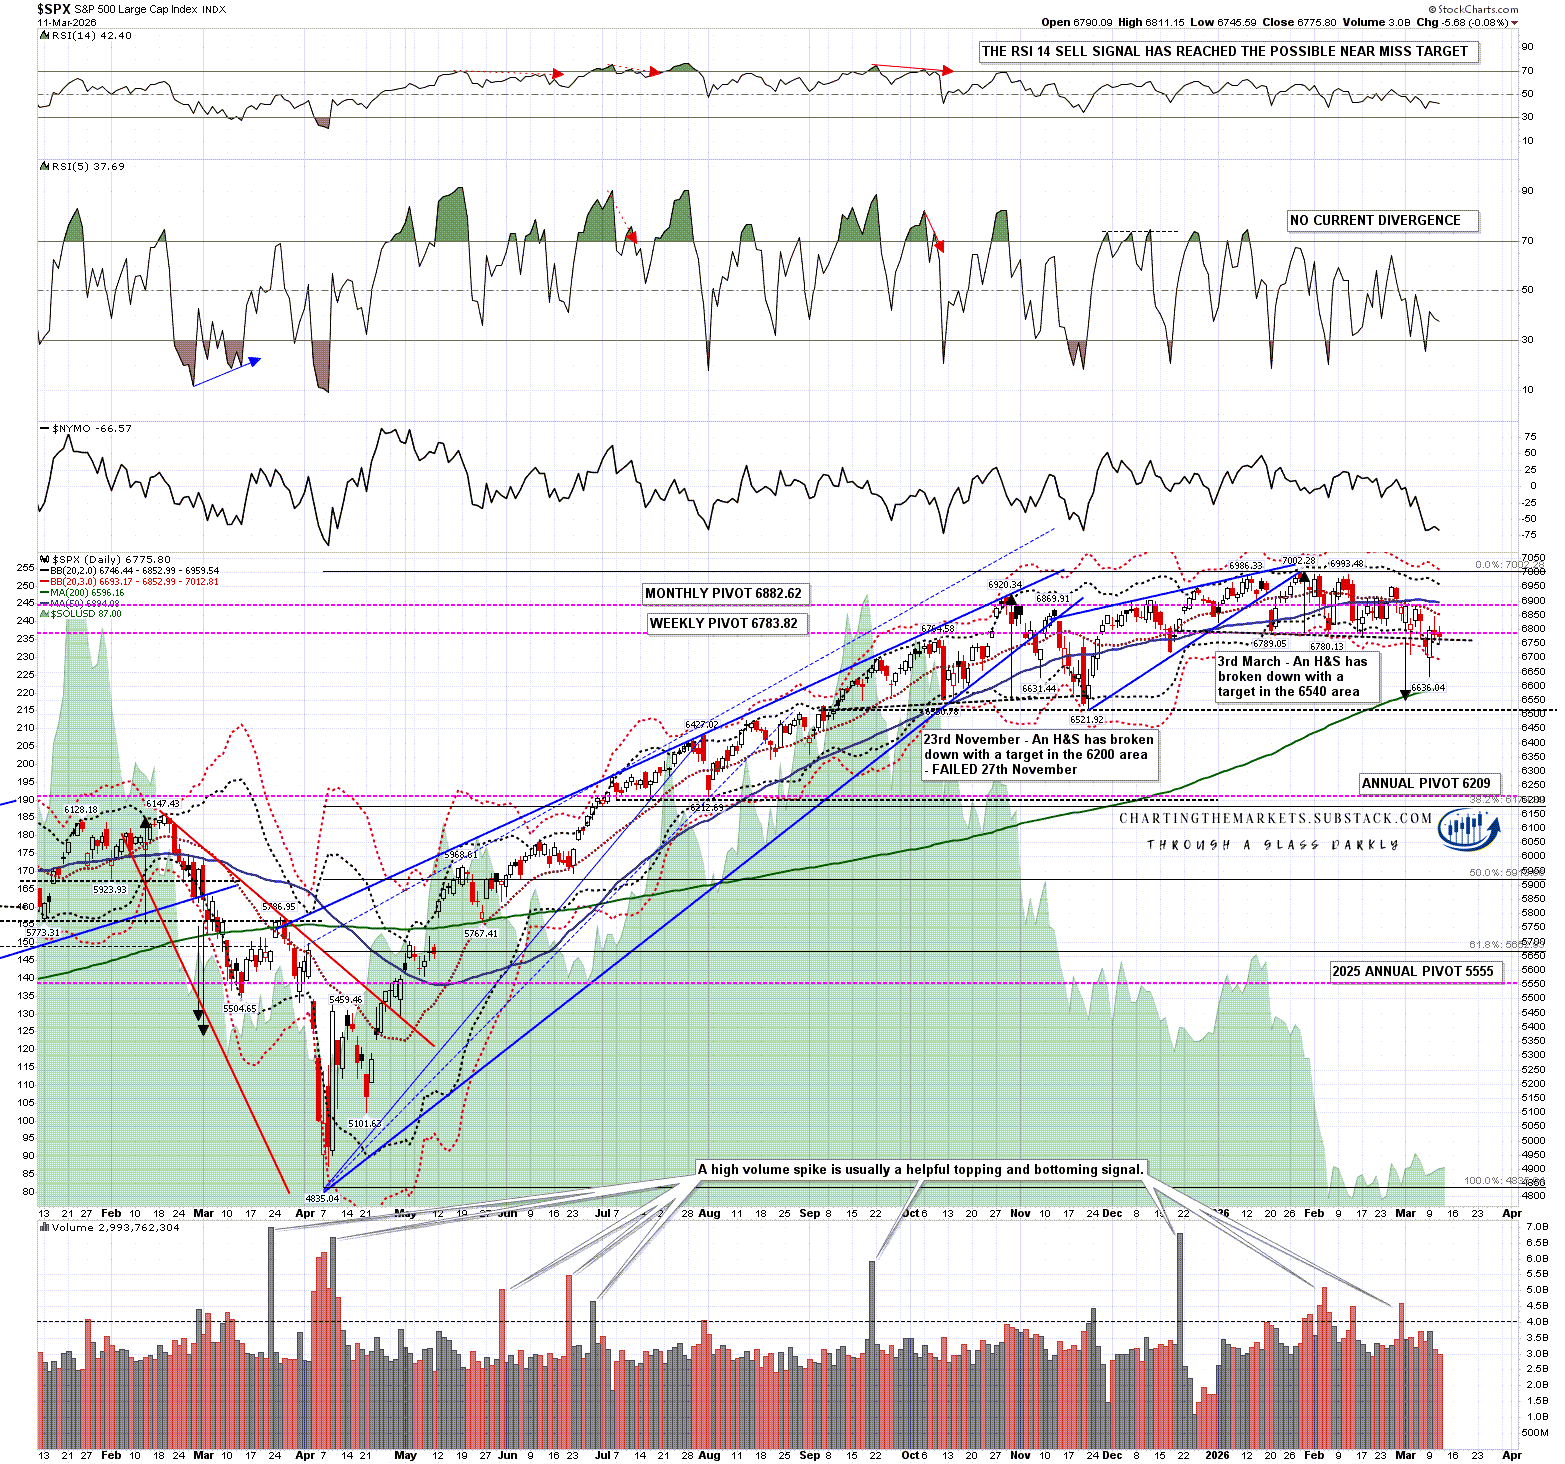
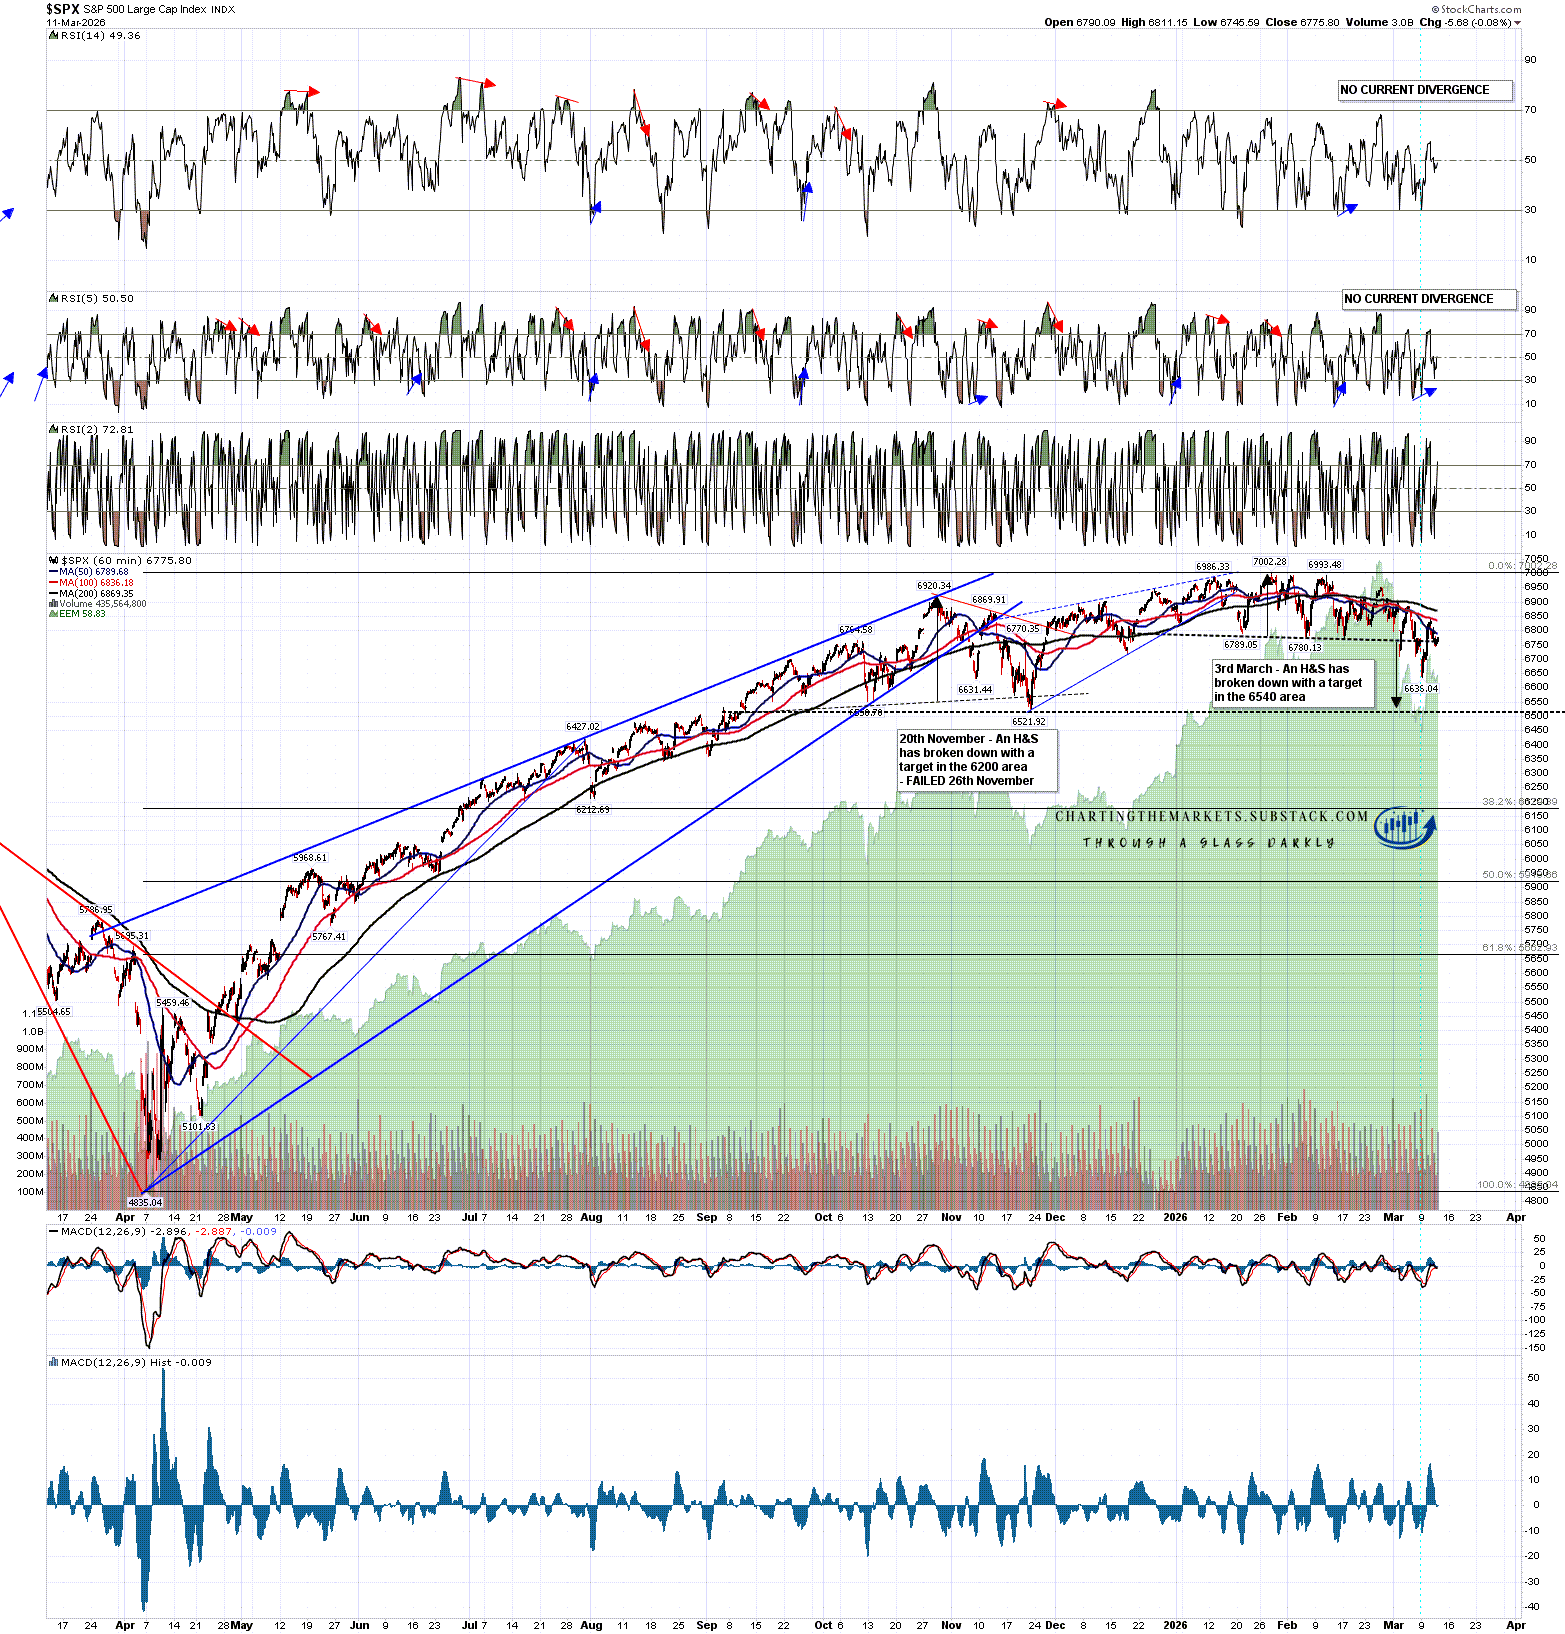
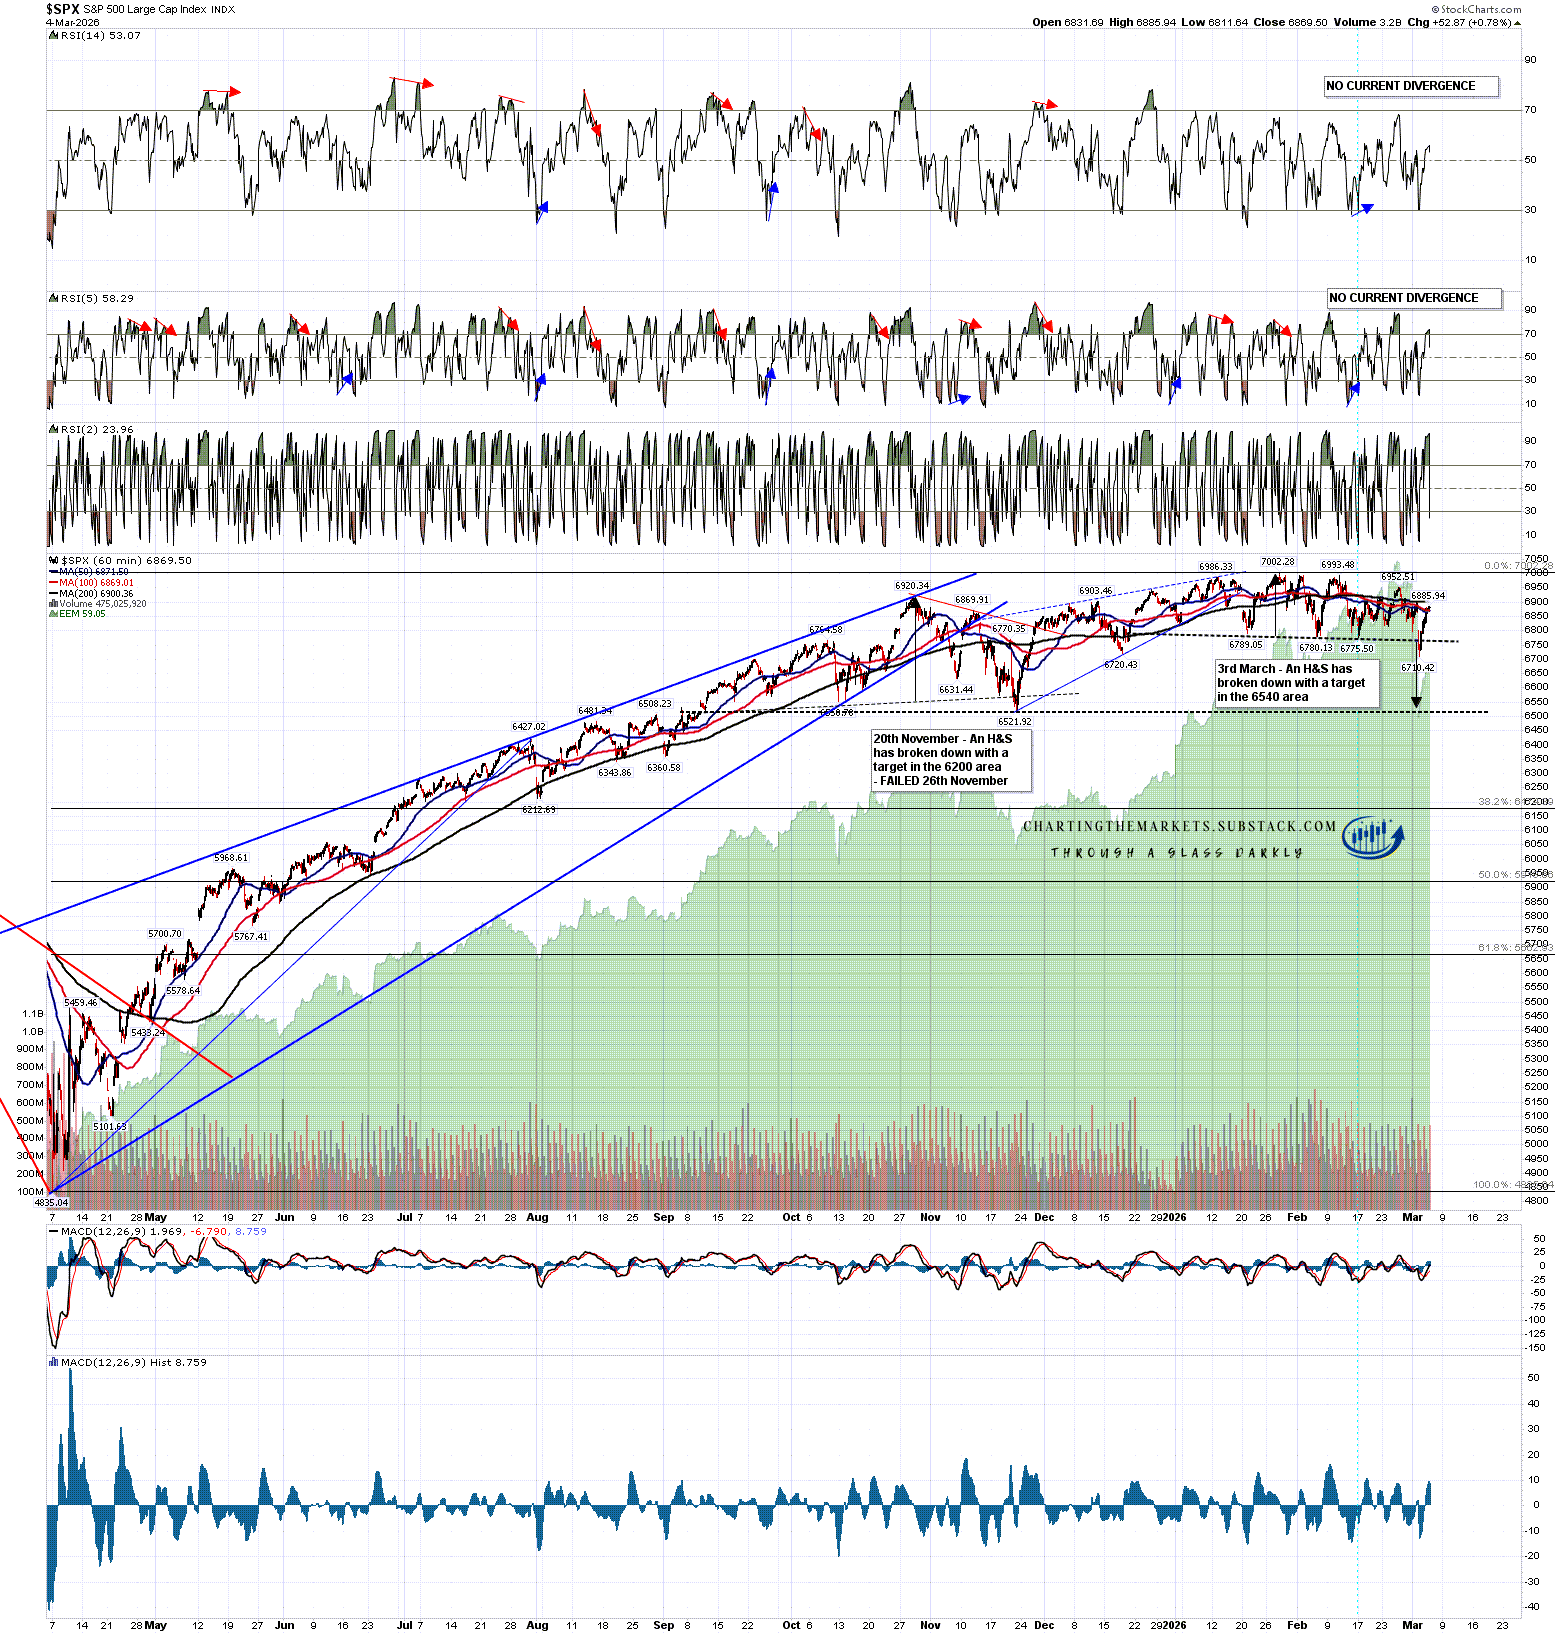
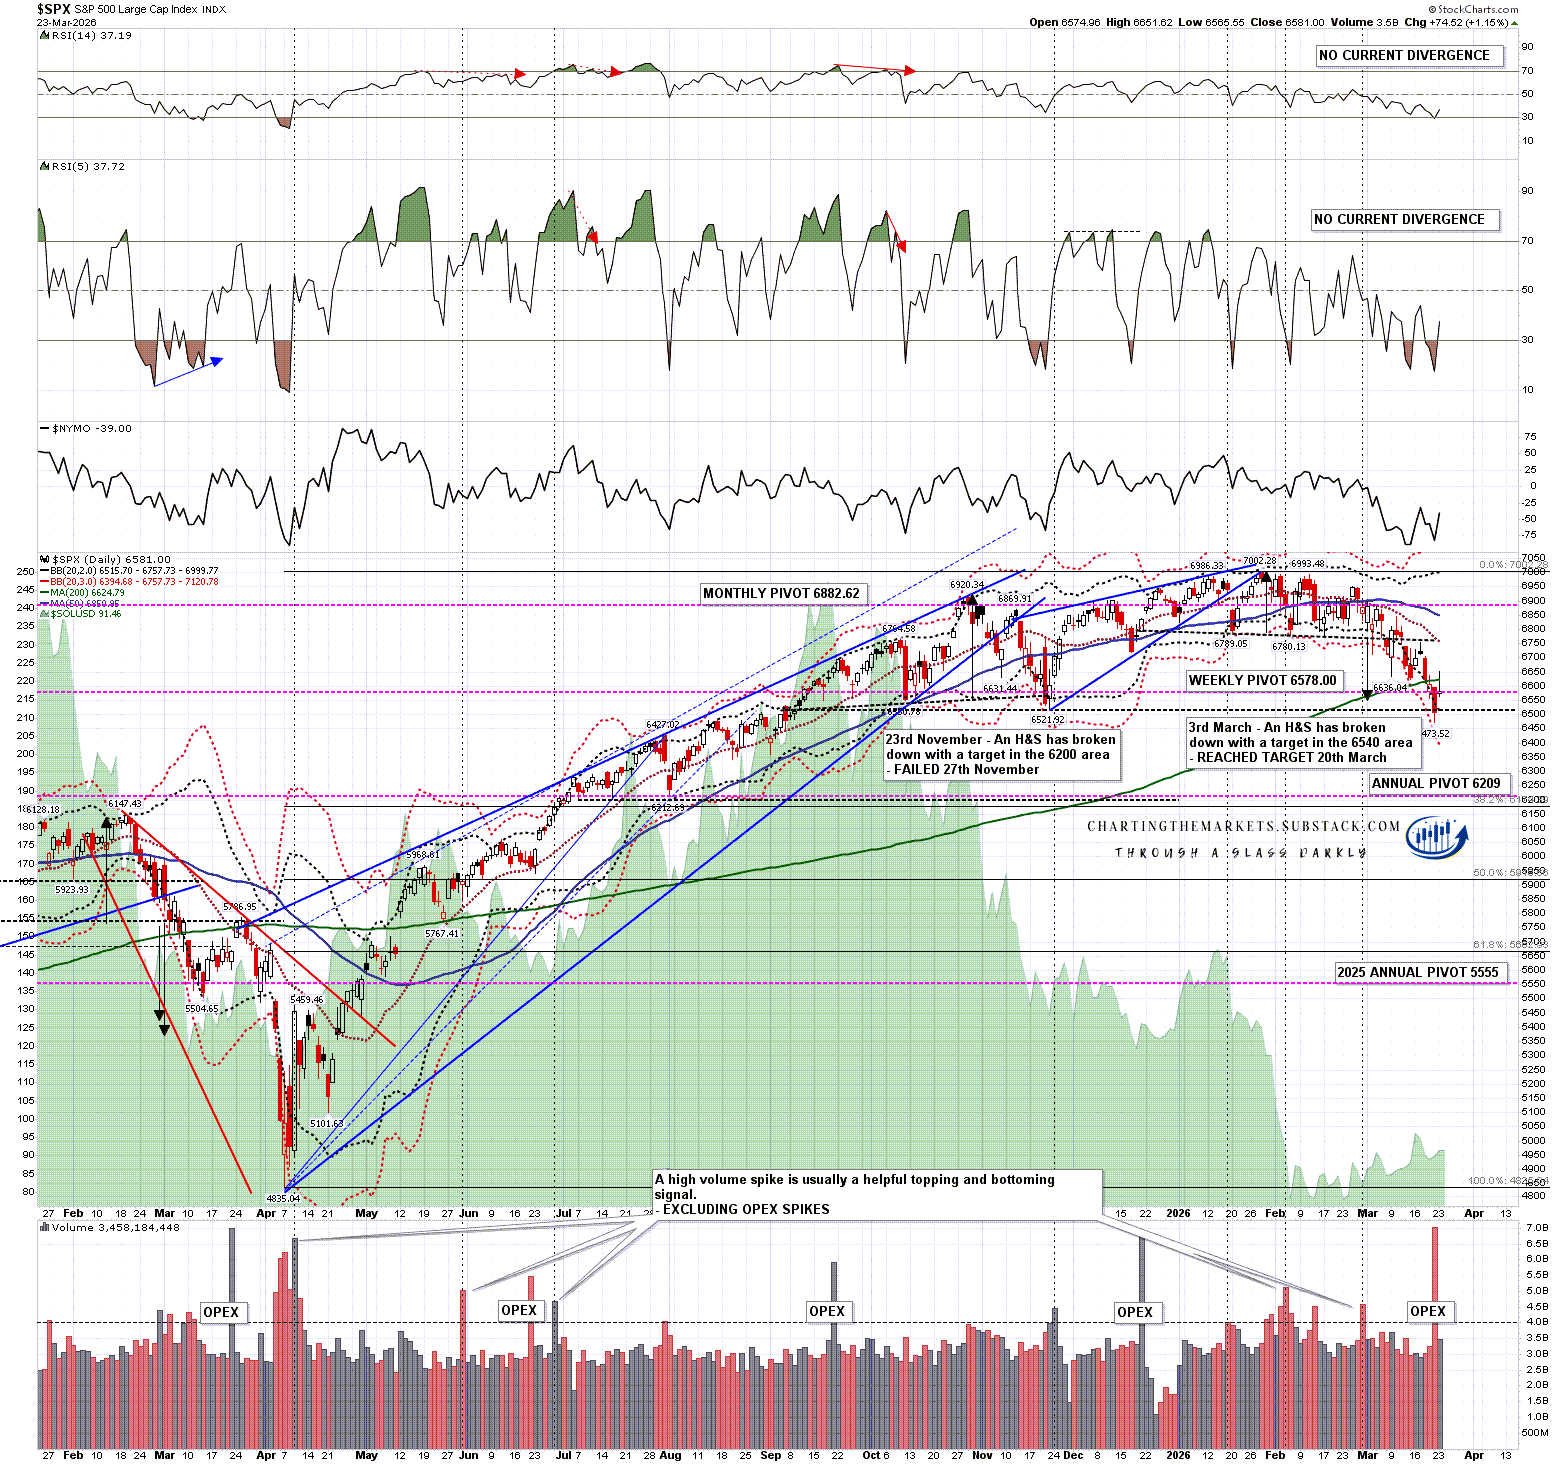
On to the markets where on the H&S on SPX that I was saying in my last post had broken down with a target in the 6540 area reached target on Friday. I mentioned then that this target was also close to a possible larger H&S neckline in the 6522 area and that was also hit on Friday.

This is a big level on SPX and an area where we could see a possible right shoulder rally before SPX could break down further towards the 4900 - 4950 area. Could we do that in a week? Probably yes, with an ideal right shoulder high target close to short term resistance at the daily middle band, currently in the 6757 area.

SPX daily chart:

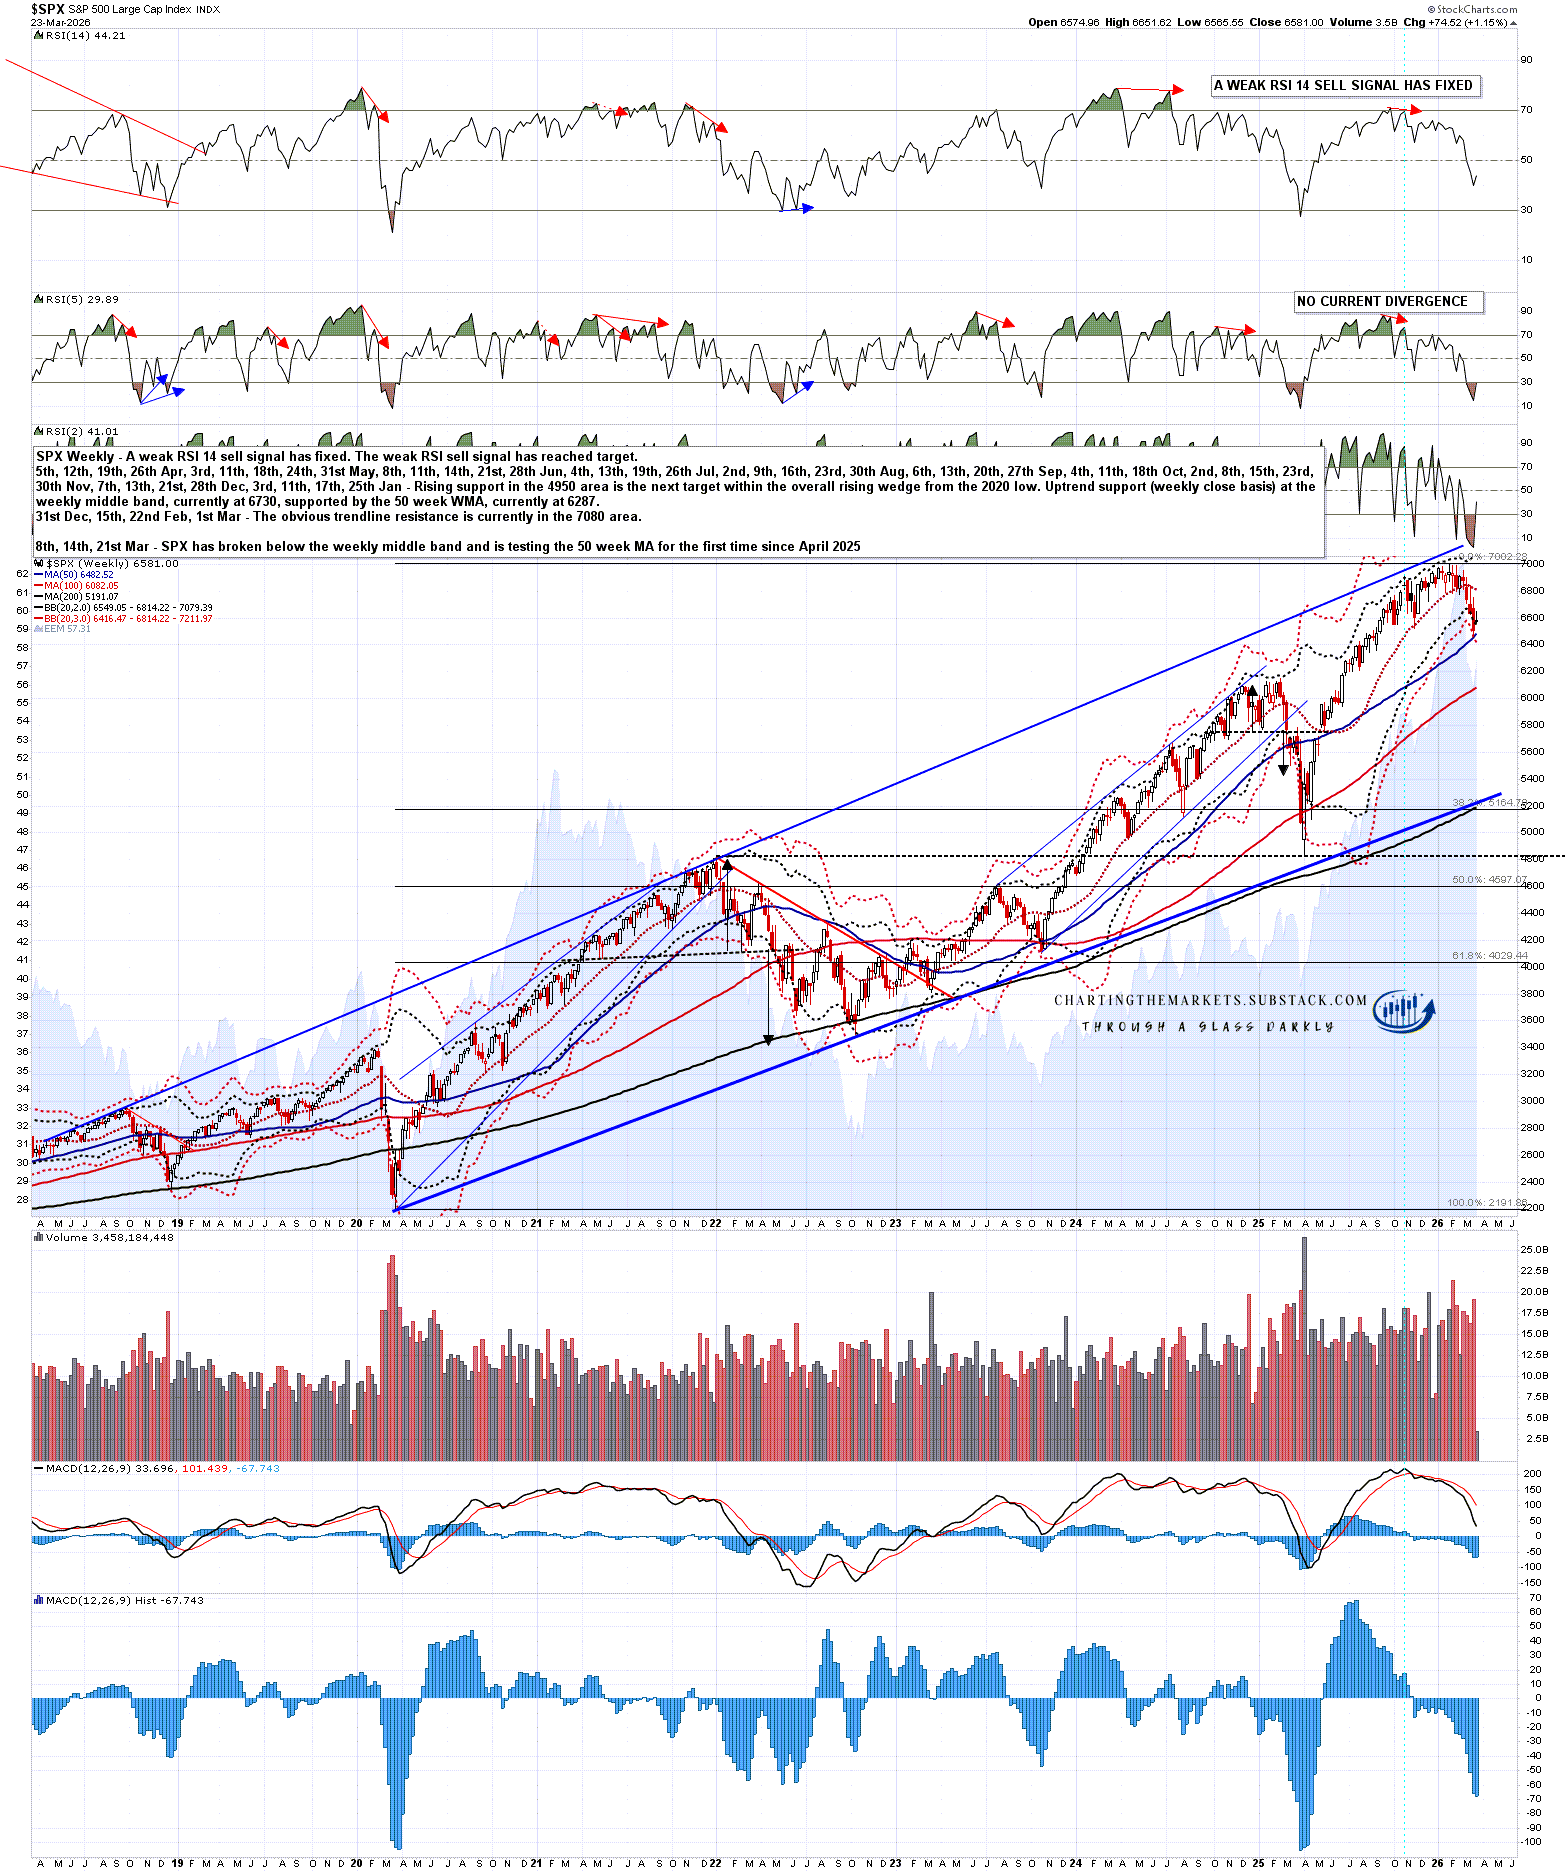
There is another very big level being tested here on the weekly chart and that is the 50 week MA. That is currently at 6483, and the low on Friday was a solid test of this MA, which tends to be a key support area in uptrends and a key resistance area in downtrends.

SPX weekly chart:

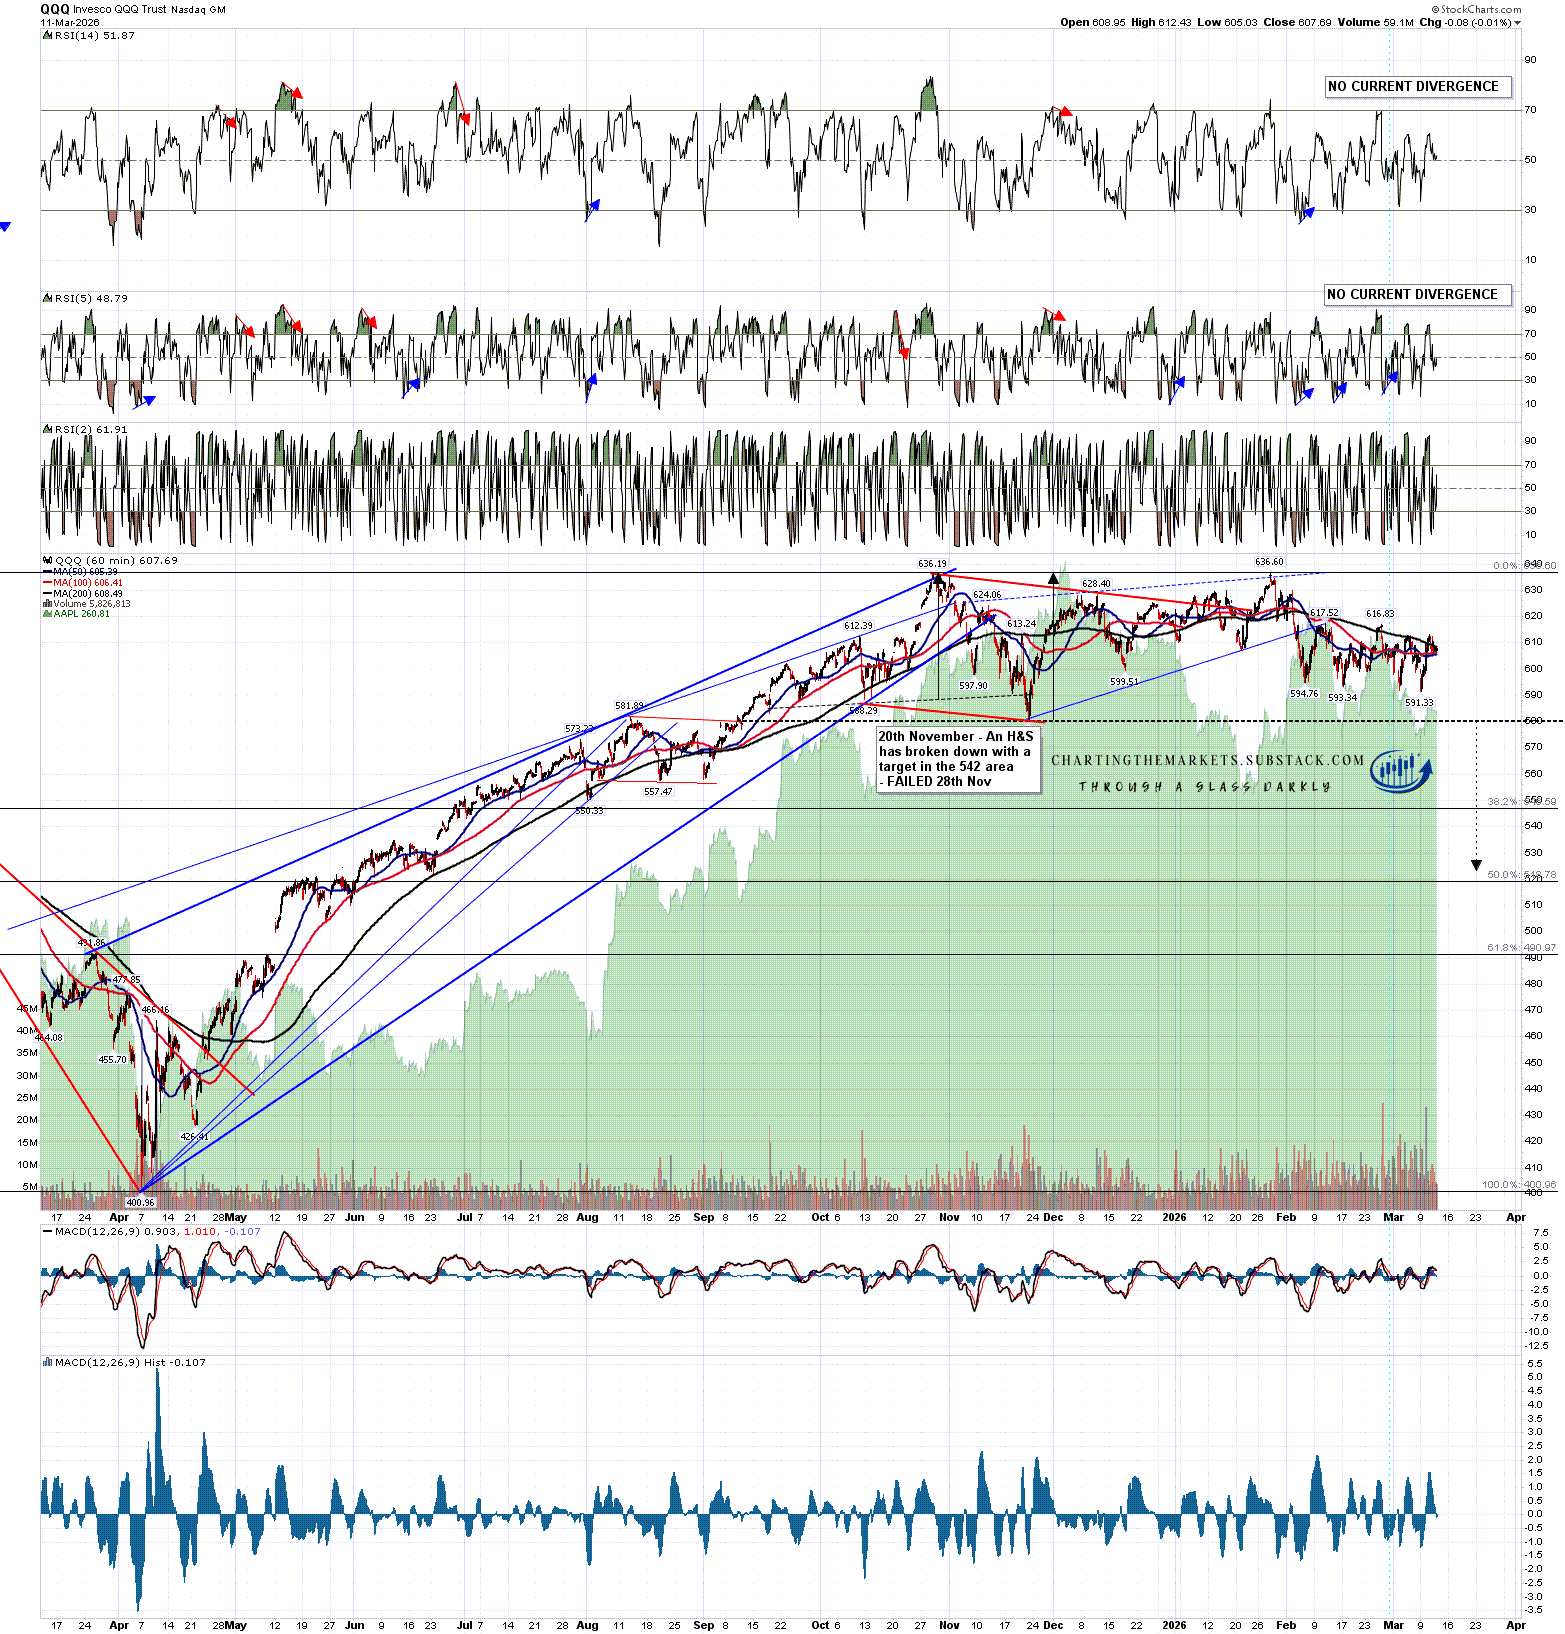
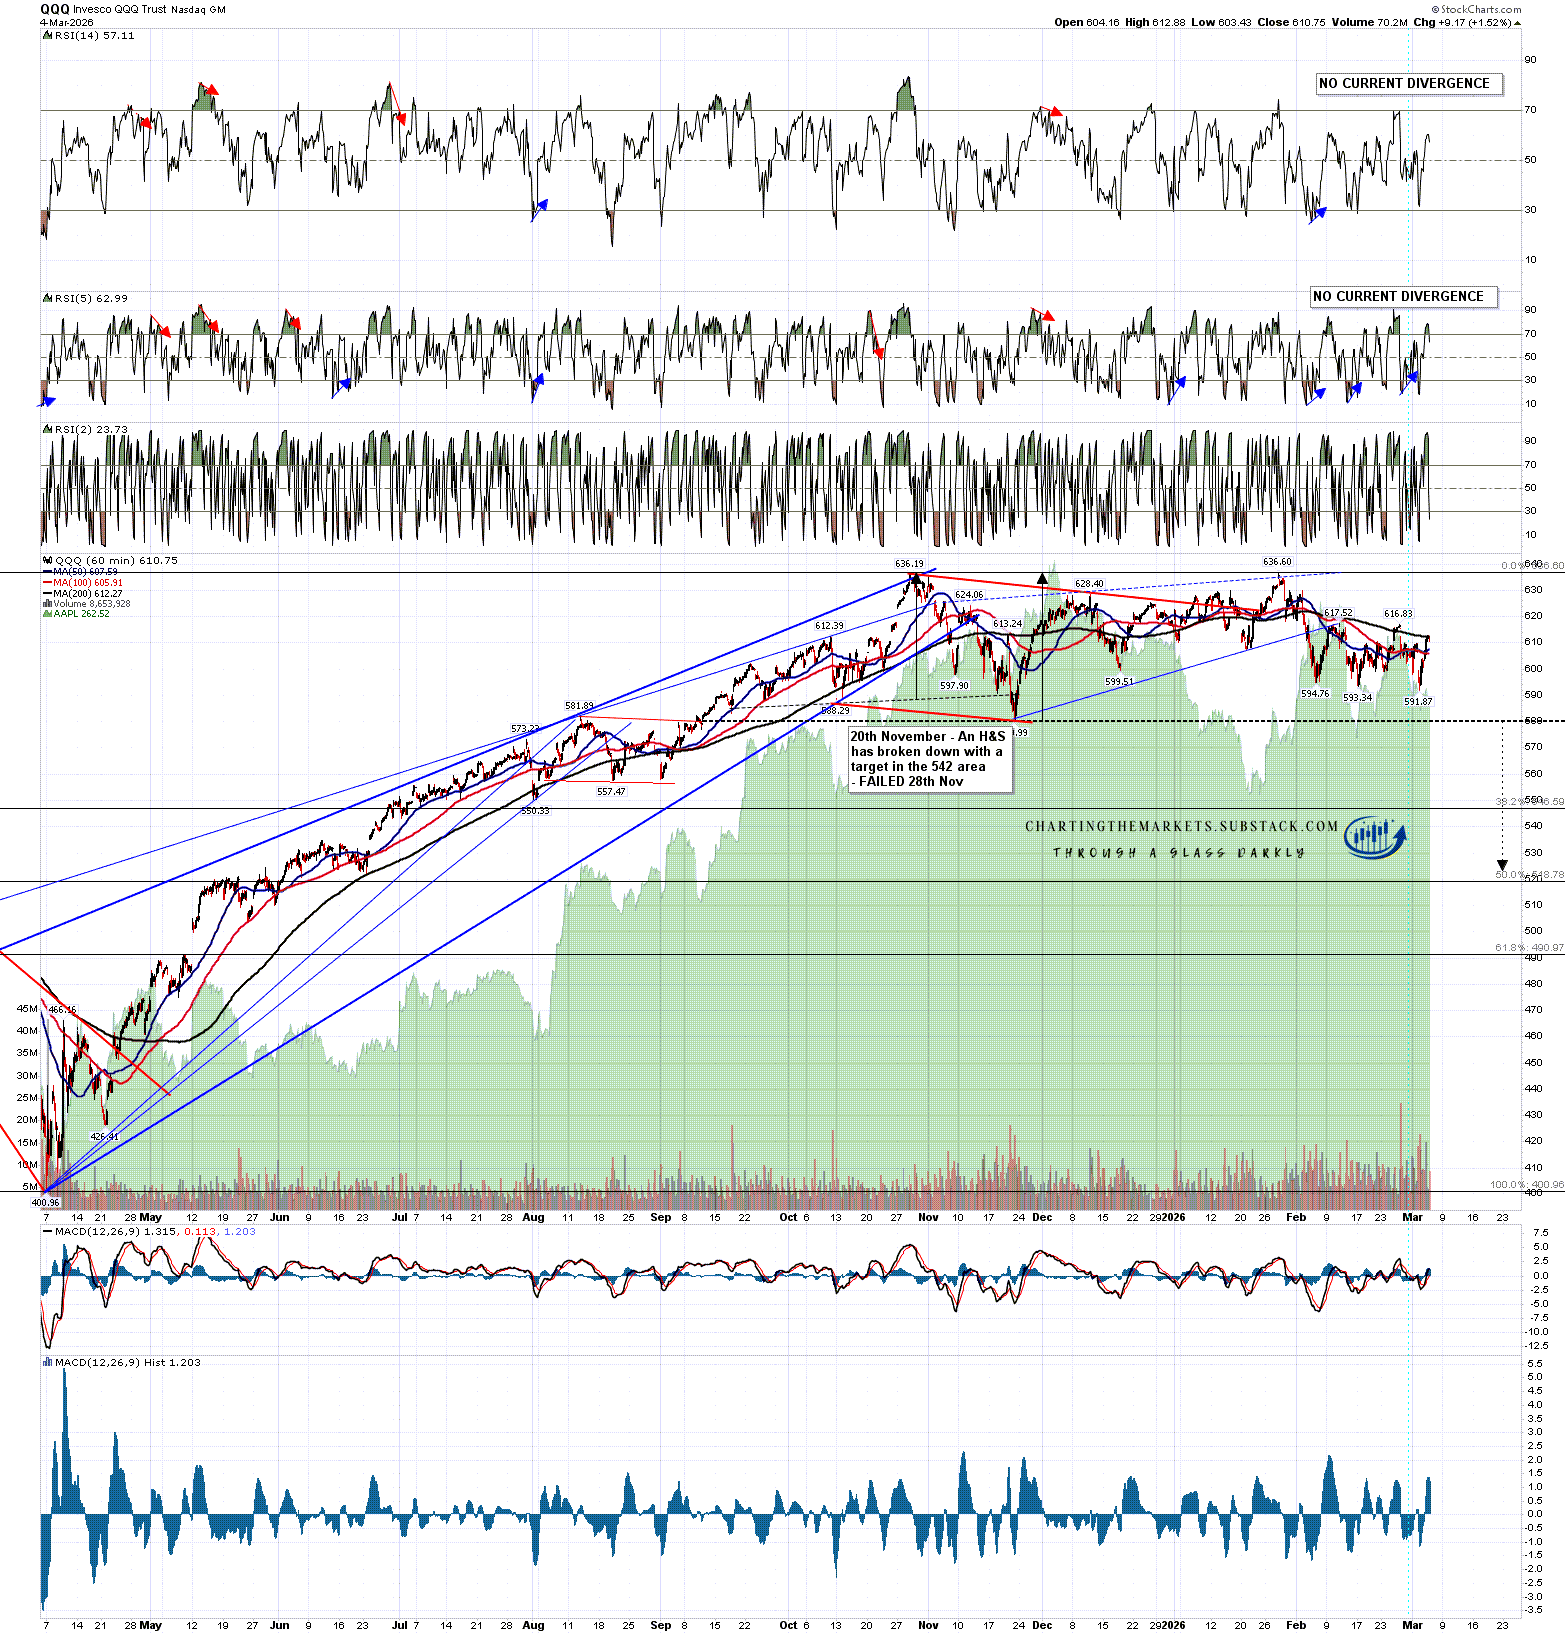
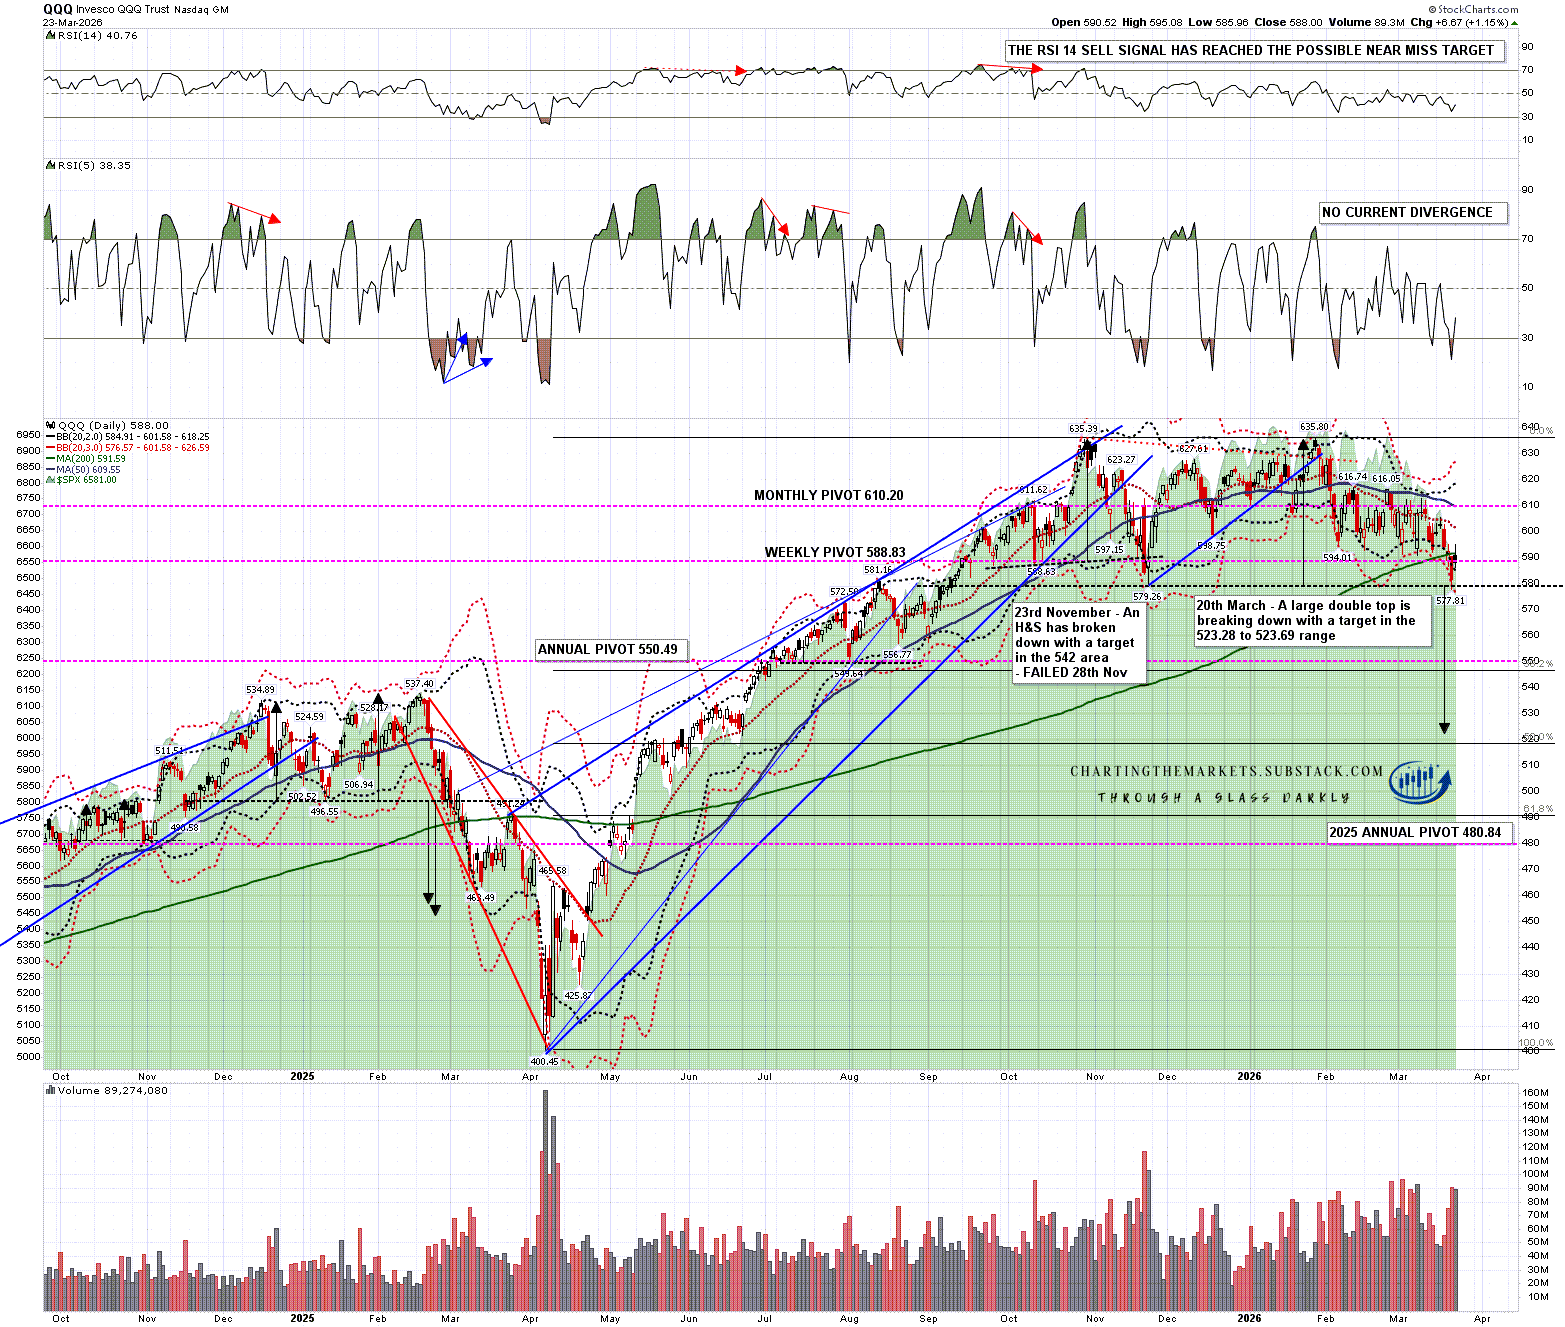
There is further reason to be looking for a bounce here on QQQ, as the 3sd daily lower band was tested at the low on Friday. This will generally deliver a bounce and, if we see one, the daily bands should widen further to allow further and faster downside, as they already have on SPX, DIA and IWM.

If we see that bounce and then further downside I would note that the large double top setup that I mentioned in my last post has now broken down with a target in the 523-4 area.

QQQ daily chart:

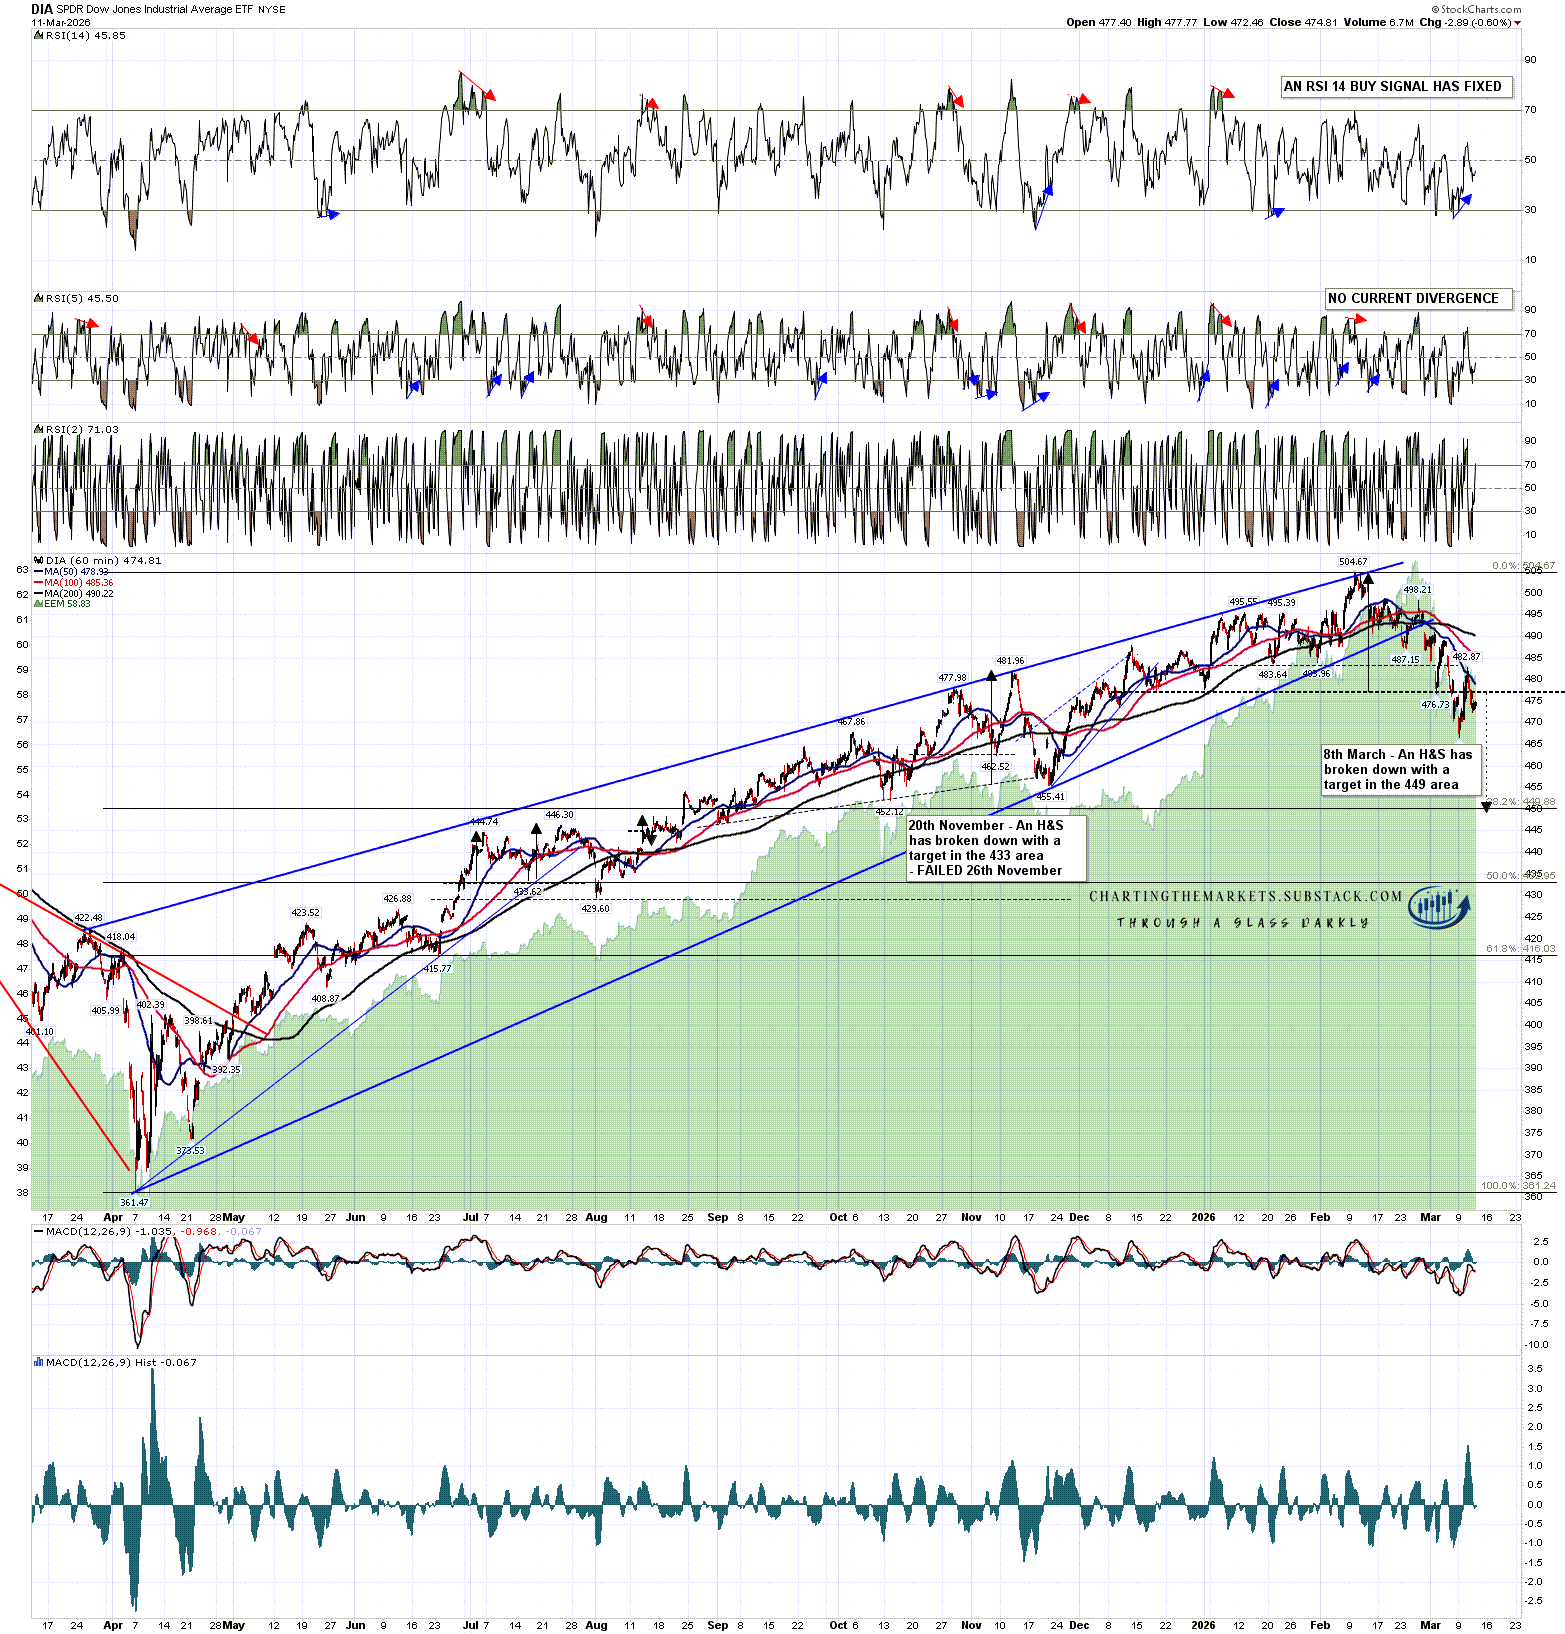
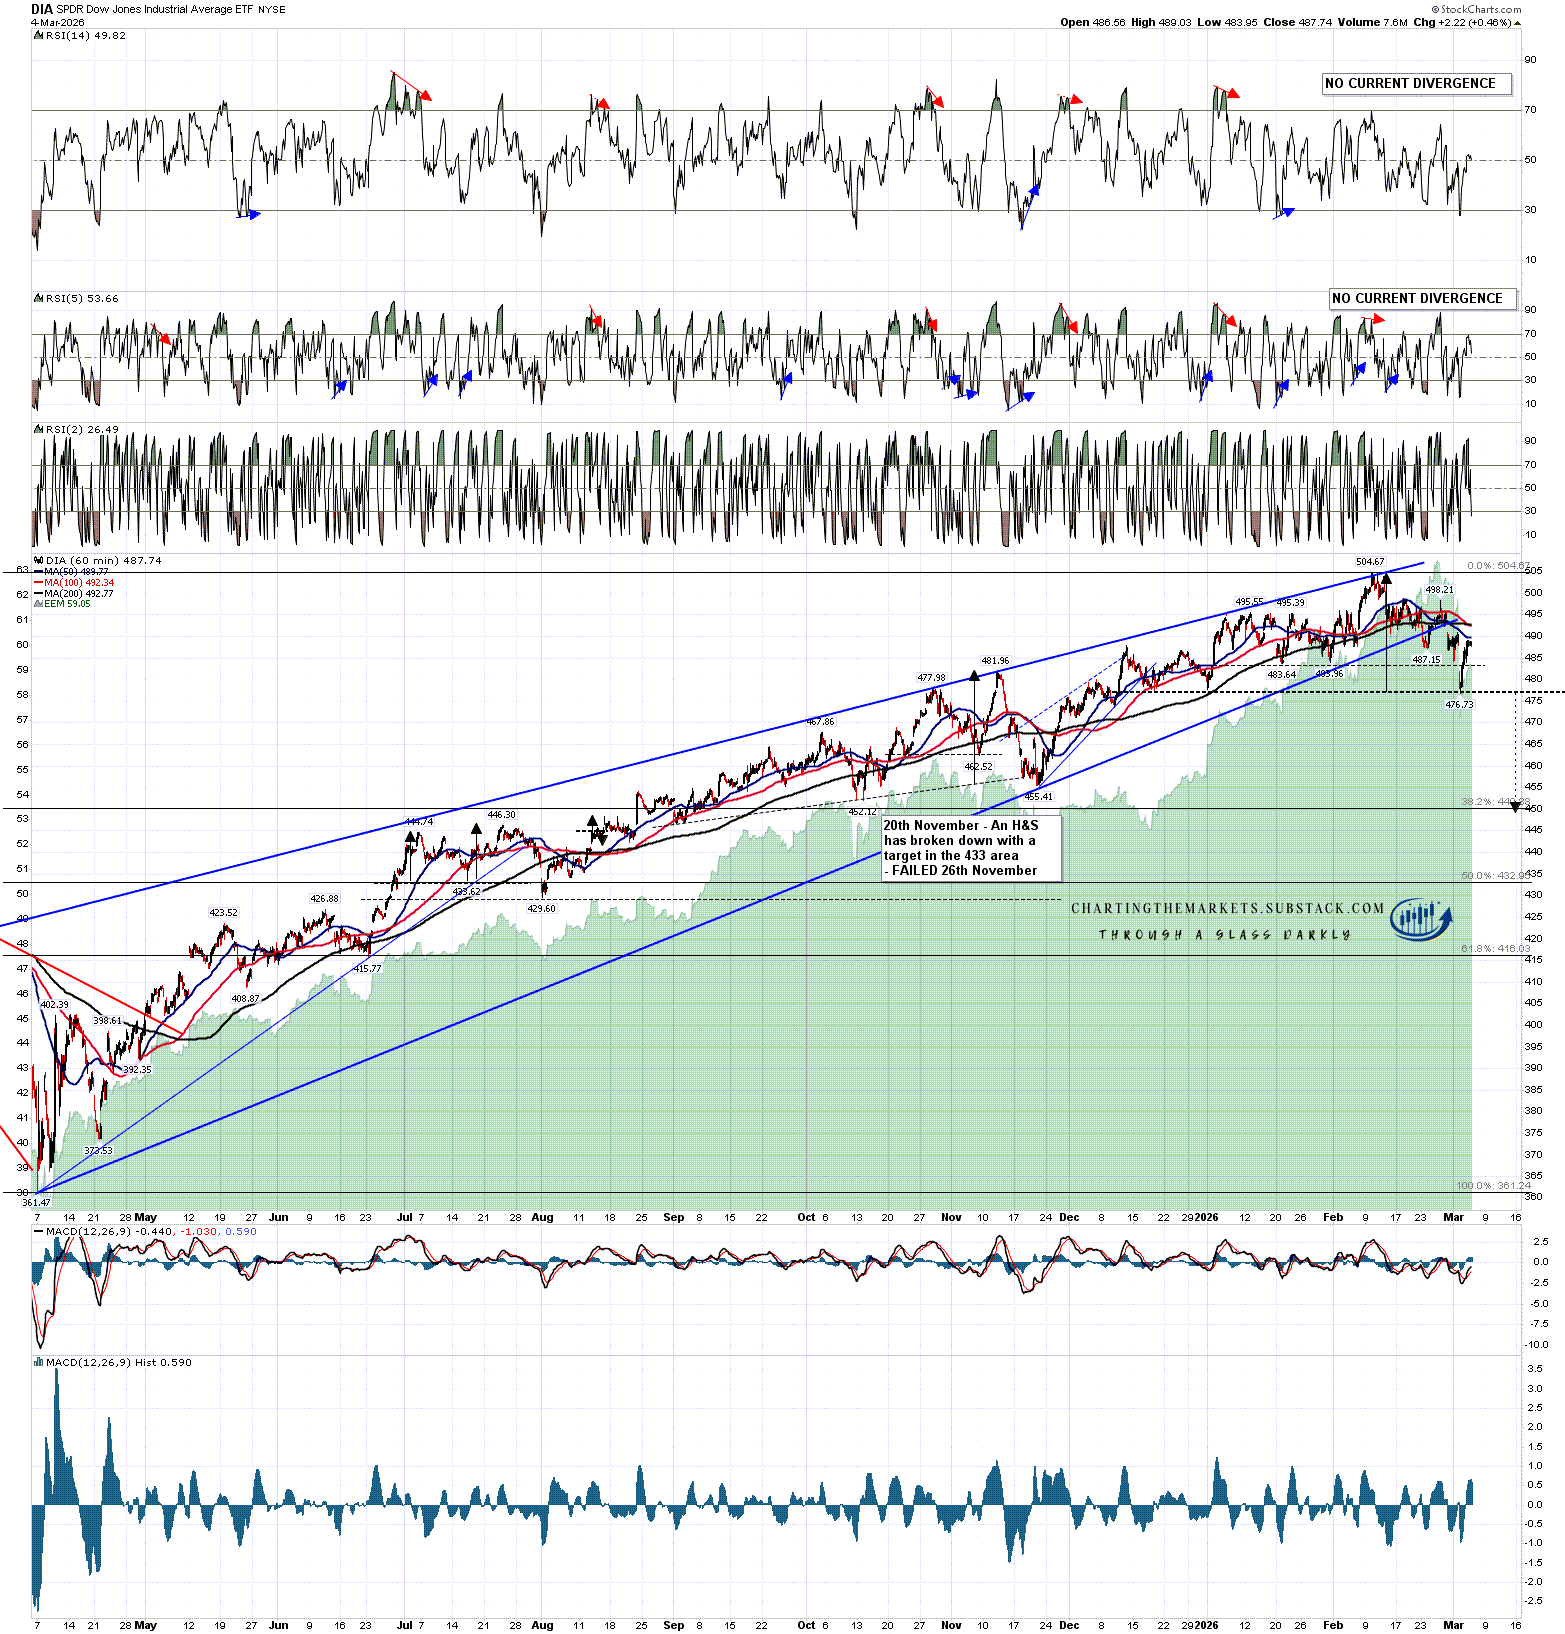
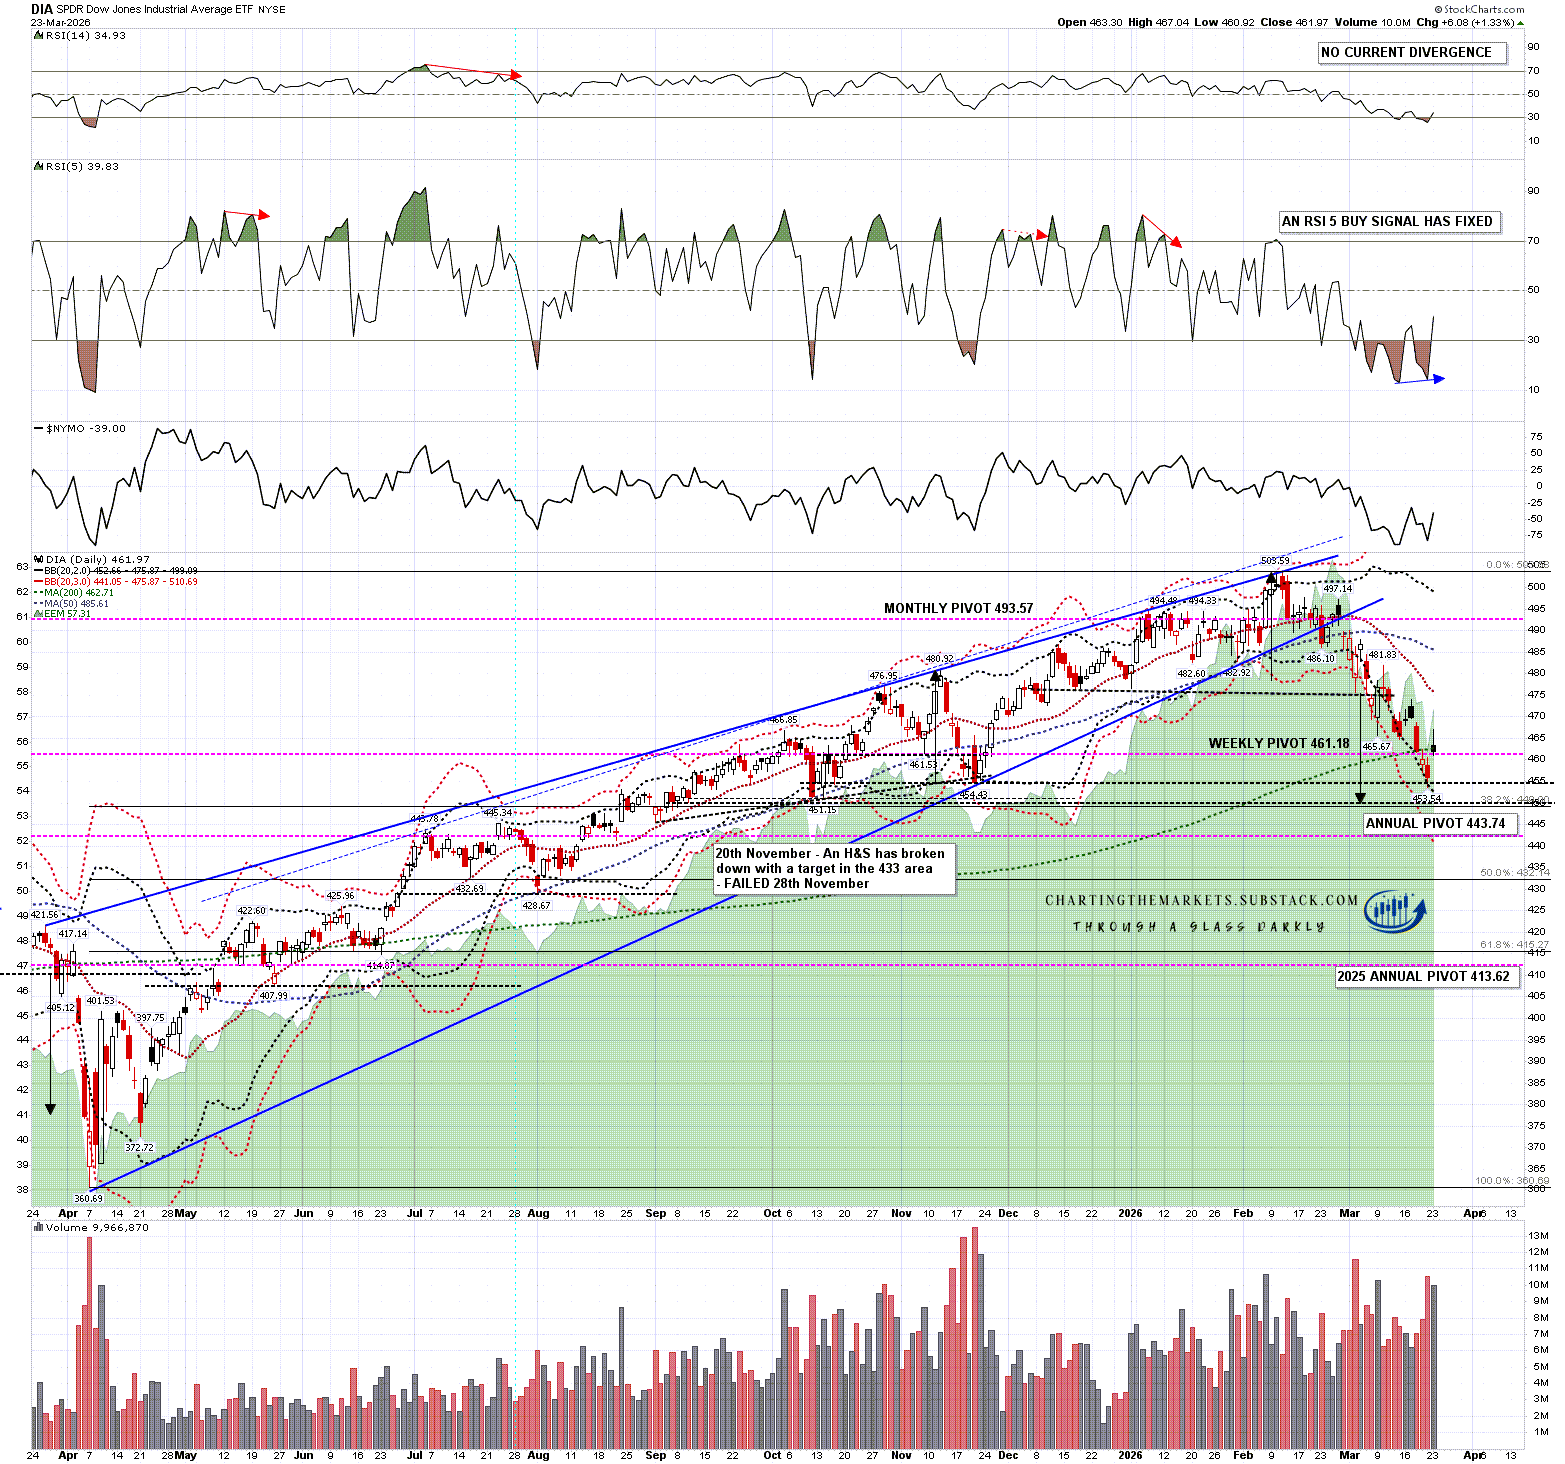
On DIA the H&S that by my last post had already broken down towards a target in the 449.50 area has not yet reached target, but it has reached the 455 area. I have two possible larger H&S necklines on the chart below and they are in the 455 and 451 areas, so the higher neckline has been reached, so a rally from Friday’s low could be a right shoulder forming on a larger H&S that on a break down would look for a target in the 405 area.

Could we make that right shoulder in a week? Probably yes, with an ideal right shoulder high target close to short term resistance at the daily middle band, currently in the 475 area. A daily RSI 5 buy signal also fixed yesterday.

DIA daily chart:

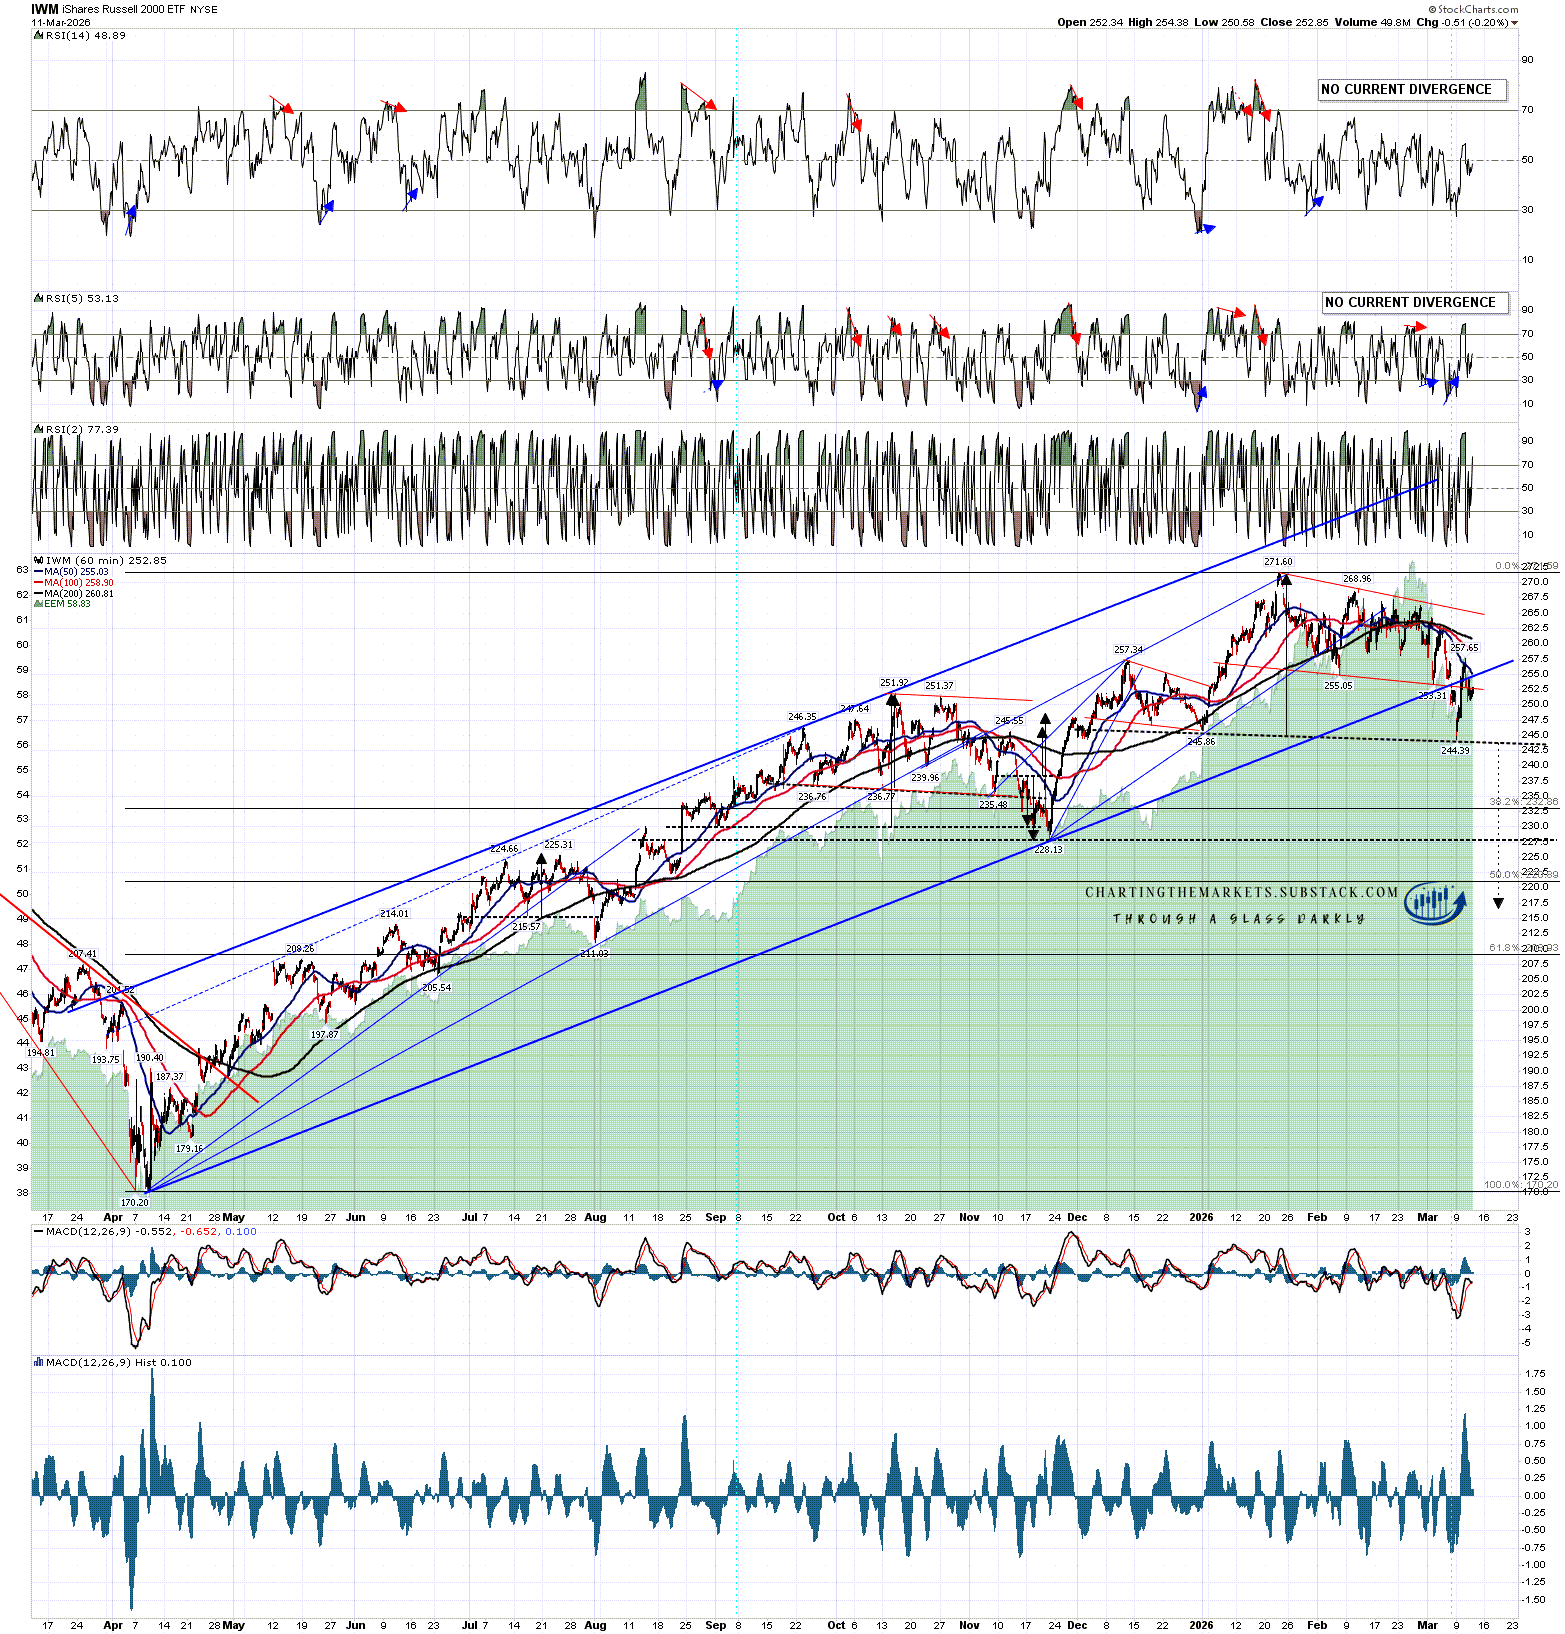
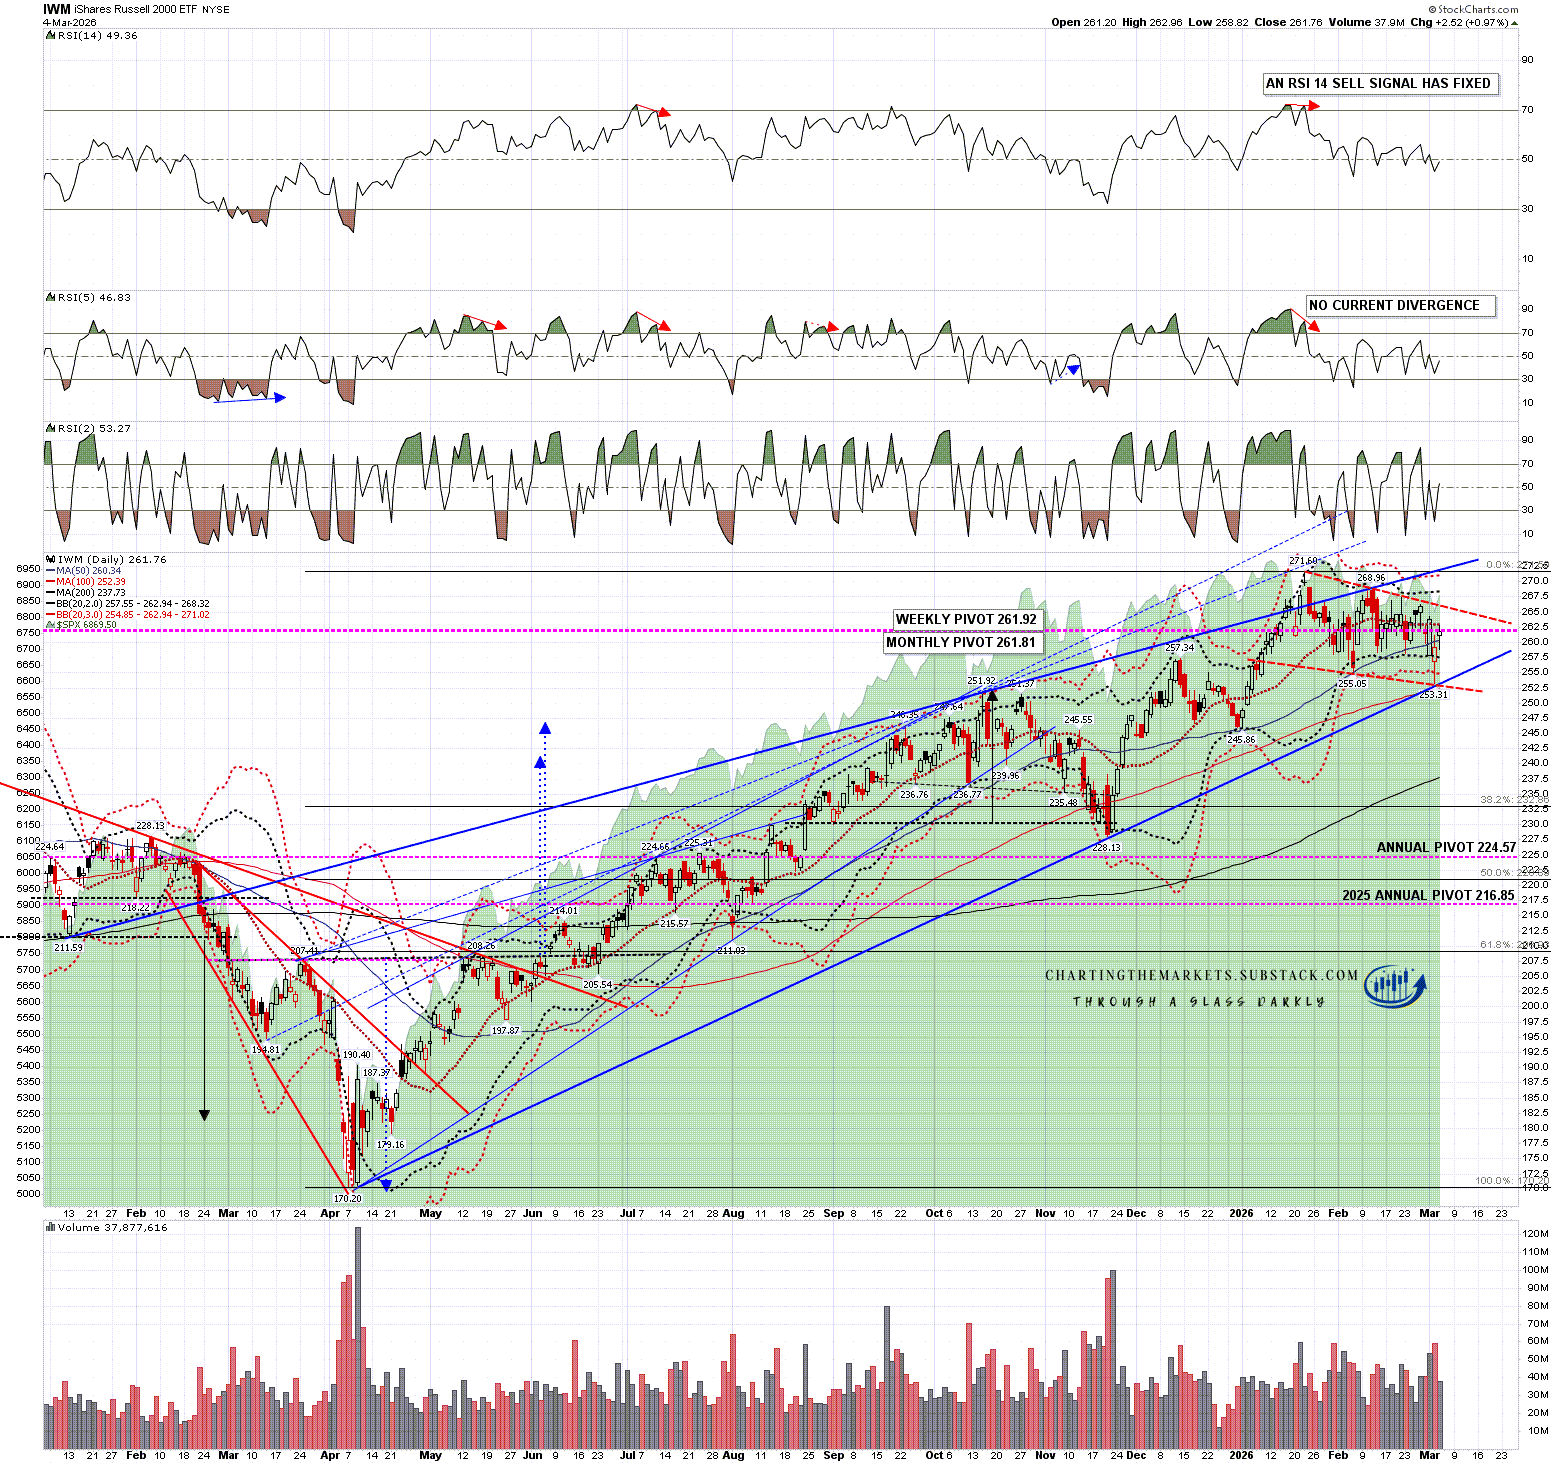
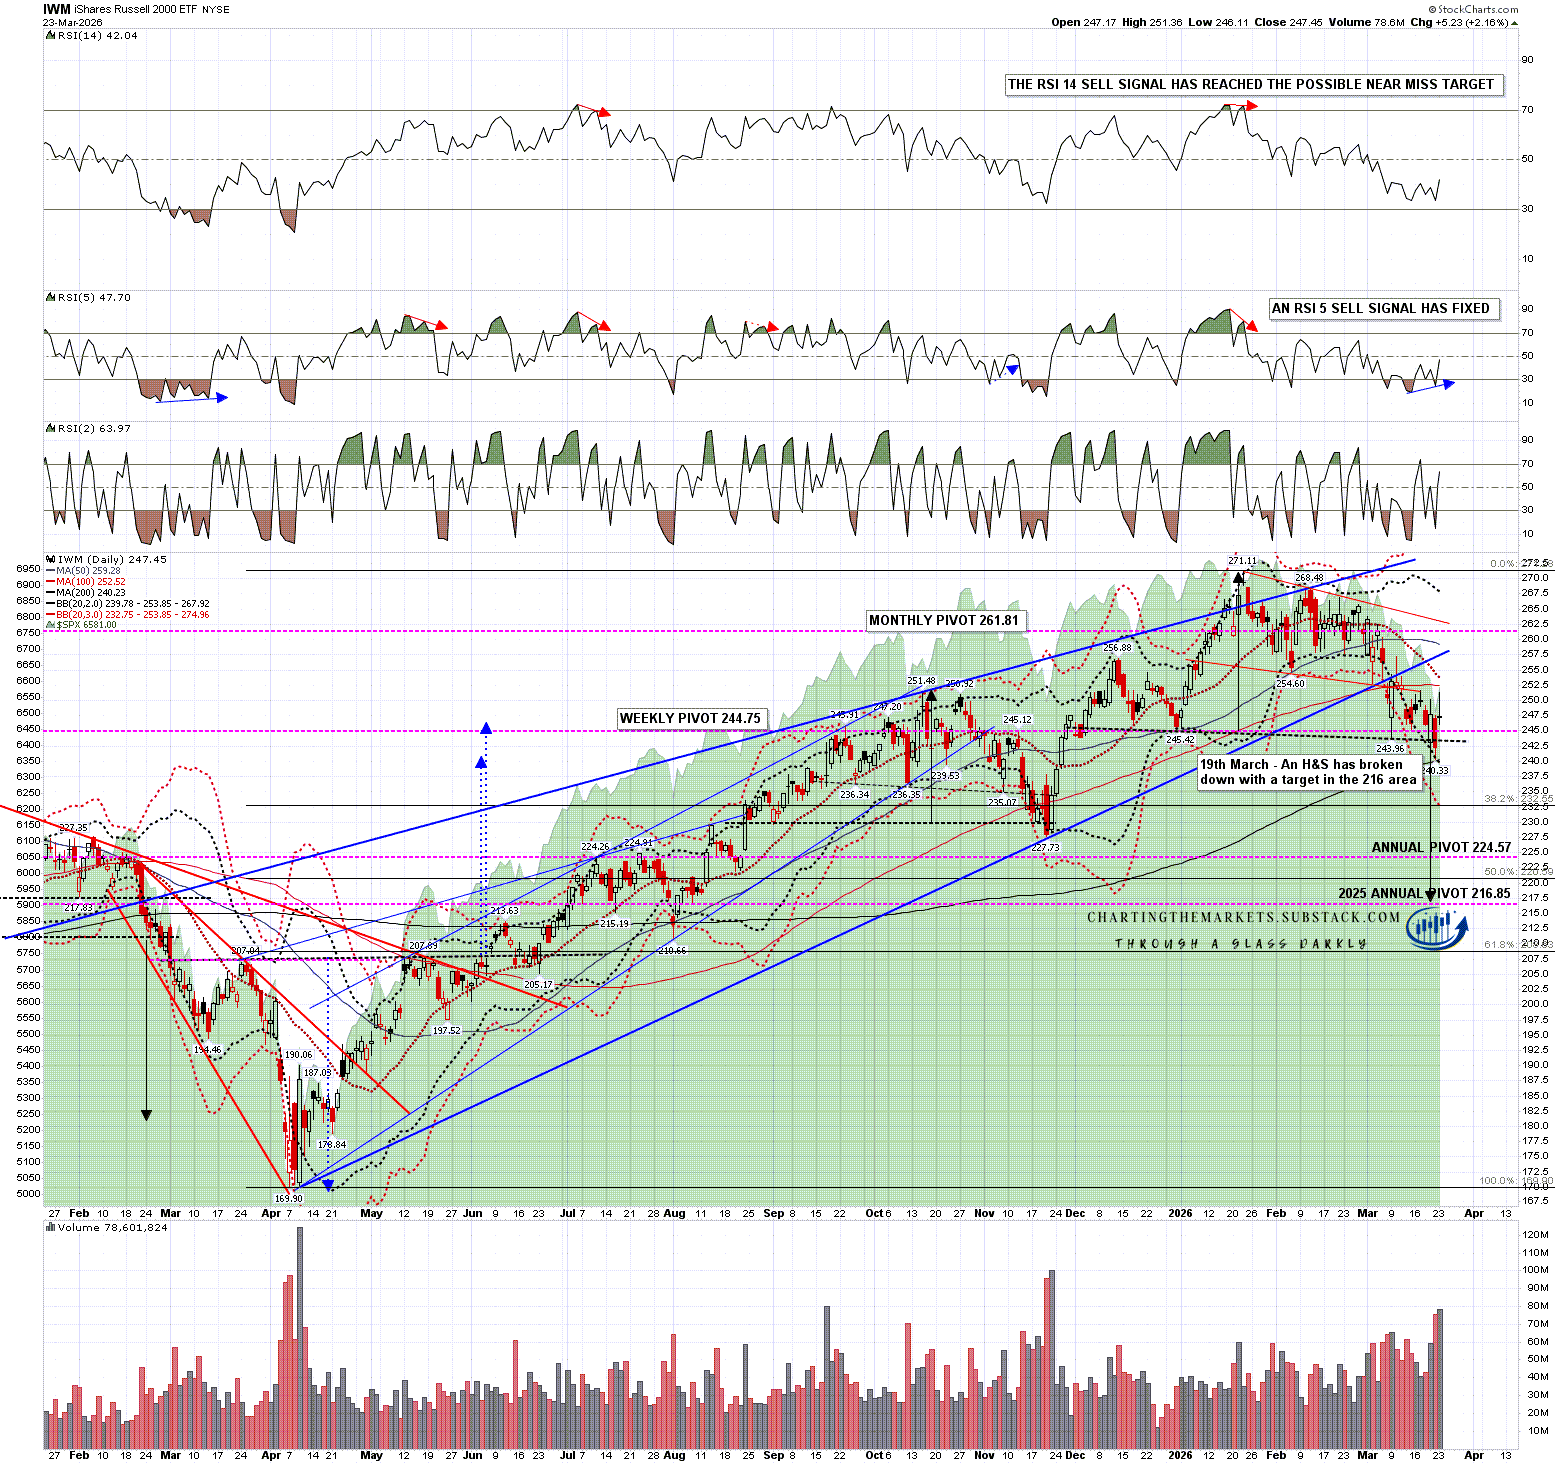
On IWM an H&S has now formed and broke down on Friday with a target in the 216 area. A strong rally after the break down is common but of course a break back over the right shoulder high at 257.19 would invalidate this H&S. A daily RSI 5 buy signal fixed yesterday.

IWM daily chart:

A decent rally this week during Trump’s five day pause could therefore set up all four of these big US equity indices to go a lot lower, and the technical setup for that rally looks very promising.

There are a few potential bumps in the road with this scenario however.

  1. There don’t appear to be any actual ongoing talks between the US and Iran.

  2. Israel is still actively attacking Iran.

  3. Iran is still actively attacking US allies in the Persian Gulf.

  4. I am reading this morning that last night the US and Israel attacked a desalinization plant and a civilian gas line in Iran which are precisely the kind of targets which may escalate this war in the worst possible way.

We’ll see how this develops, but overall I am wondering if we may watching the start of a crash scenario developing here where all of these indices retrace the entirety over their moves up from the April low last year.

If you like my analysis and would like to see more, please take a free subscription at my chartingthemarkets substack, where I publish these posts first. I also do a premarket video every day on equity indices, bonds, currencies, energies, precious commodities and other commodities at 8.45am EST, but only for paying subscribers. Other places to find me are my page on the platform previously known as twitter, and my YouTube channel.

Friday, 13 March 2026

Oil ......... Escalated Quickly, So What Now?

In my last post on oil on Tuesday 3rd March I was laying out the very bullish scenario on oil that had been forming since a series of falling wedges from the 2022 highs on light crude, heating oil and gasoline broke up in June 2025.

The large bottoming patterns on heating oil and gasoline had already started to break up when I wrote that post, and by Sunday night the double bottom on light crude had also broken up, and all of those bottoming patterns had reached target. So what now?

Well I’ve been doing a lot of reading on the Iran conflict over the last few days, and it’s hard to say how long this war might last.

What is certain is that for the war to end Iran will need to agree to end it, and at the time of writing they are refusing to even enter talks about ending this war without guarantees that they will not be attacked again and that the US and Israel will pay them reparations for the recent attacks.

I see three obvious ways that this conflict could end or evolve.

The first of these three main options is that the US knocks out most Iranian oil production and this forces Iran to the table. Knocking out that oil production would be surprisingly easy as 90% of Iran’s oil production flows through Kharg Island, in the Persian Gulf opposite Kuwait. The US has apparently been looking at the possibility of taking over that island and, if that was occupied by the US, the financial consequences could potentially force Iran into talks at a serious disadvantage.

The second of these three main options is that the war continues, but the US allies in the Persian Gulf, Kuwait, Saudi Arabia, Qatar, United Arab Emirates, Oman and perhaps Iraq make a separate peace with Iran. All of these have US bases on their territory and they could either close those bases or agree that the US would not be allowed to attack Iran from these bases.

Iran has offered all of these countries a separate peace if they no longer allow US attacks from their territory and is also offering to open the Strait of Hormuz to their exports.

This is a strong offer for two reasons.

The first is that seven million barrels per day of oil production from these states is currently stopped and much of that which is still happening cannot be exported as it needs to go through the Strait of Hormuz. A lot of natural gas production is also currently shut down and 25% of LNG worldwide is transported through the Strait. This hasn’t had a big effect on natural gas prices in the US yet but if the conflict continues that might well change. It has already had a big effect on natural gas prices in Europe.

The second is that Iran has already attacked the desalinisation plant in Bahrain and is threatening to attack more desalinisation plants. Iran gets about 3% of their water from desalinisation but across these other Gulf States desalinated water is much more important. In terms of drinking water:

  • 3% in Iran

  • Iraq - Unable to find a number but likely lower than any other gulf state excluding Iran

  • 42% in UAE

  • 70% in Saudi Arabia

  • 86% in Oman

  • Over 90% in Kuwait

  • Over 90% in Qatar

  • Over 90% in Bahrain

The availability of desalinised water is therefore an existential threat in most of these gulf states, excluding Iran and maybe Iraq, and sufficient damage to these plants could risk large areas of these states becoming uninhabitable. It is already clear that the US cannot defend these states from these and other threats and, given that many of these plants draw water from the Persian Gulf, there is also a high risk that a large oil spill in the gulf could also compromise some or all of these desalinisation plants.

There is therefore a large possibility that the Persian Gulf states may make a separate peace with Iran and that peace could involve the removal of all US bases in the region.

If the peace involved a reopening of the Strait of Hormuz and a return to full oil and gas production in the gulf states this would likely calm energy markets soon after.

The third of these three main options is that the war continues for an indefinite period with Iran continuing to attack their neighbours in the Persian Gulf even after the current bombing campaign by the US and Israel ends, and the Strait of Hormuz stays closed.

In that event 10% to 20% of world oil production stays off the market, oil and perhaps natural gas markets spike to new all time highs and perhaps a lot higher and there may be an oil shock comparable or bigger than the oil shock of the early 1970s, triggering recession and inflation throughout the developed world.

If there is also a major interruption to desalinisation in the gulf states then their economies might collapse and trigger a historic refugee crisis, as a large proportion of the Middle East becomes effectively uninhabitable due to water shortages.

Of these three options I think the first and second options are the more likely ones, the third is the disaster scenario that the gulf states will likely go to great lengths to avoid, even at the cost of breaking their current alliances with the US.

With these options in mind, let’s move on to the charts.

On light crude oil (WTIC) the double bottom broke up with a target in the 101-2 area on Thursday 5th March and made target at the futures open on Sunday night. The high on Sunday night was at 119.48 and in my ‘The Bigger Picture’ video recorded and posted shortly after the open I was talking (from about the 22.00 to 27.00 min mark) about the possible alternative routes excluding the Strait of Hormuz and the large strategic oil reserves that meant that after this initial spike up we might see a very sharp correction down on oil, which we then saw of course.

TRIGGER WARNING - I would warn that in that segment I was joking about the possibility that Pete Hegseth might in future consider doing his press conferences in a weightlifter’s posing pouch and oiling his muscles to strike poses as he spoke to the press, so if that image is too much for you then you probably shouldn’t watch this.

On all three of WTIC, HOIL (Heating Oil) and GASO (Gasoline) I noted that the falling wedges from the 2022 highs were all potentially bull flags, so we might soon see retests of those highs. In the case of WTIC that high would be at 126.42, still well short of the 2008 all time high at 147.27.

WTIC monthly chart:

On heating oil (HOIL) the IHS broke up with a target in the 3.47 area and made target at the futures open on Sunday night. The high on Sunday night was at 4.02, short of but not far away from the all time high (and bull flag target) made in 2022 at 4.46.

HOIL weekly chart:

On gasoline (GASO) the double bottom broke up with a target in the 2.913 to 3.092 area and made the lower target at the futures open on Sunday night. The high on Sunday night was at 3.15, still well short of the all time high (and bull flag target) made in 2022 at 4.12.

GASO weekly chart:

Iran has stated an aim of keeping the Strait of Hormuz closed indefinitely (if this conflict continues) with the intention of forcing light crude oil (WTIC) prices up to $200 per barrel. If they can keep the Strait closed and if the conflict continues for months then that is potentially doable. In inflation adjusted terms that wouldn’t even be a new all time high on WTIC, as the current all time high was made in 2008 at $147.27 and cumulative US inflation since then is slightly over 51%, so a new all time high in real terms would be in the $225 area.

I’m hoping that doesn’t happen, as the economic pain across the developed world would be high, and the war might well gut the economies of the US allies in the Persian Gulf. That would be a very high price to pay for whatever the objectives of this war might be, though as Donald Trump noted yesterday, as the US is currently the largest oil producer in the world, that wouldn’t be a price that the US as a whole would be paying, though it would make the current affordability crisis for ordinary US citizens a lot worse of course.

If you like my analysis and would like to see more, please take a free subscription at my thebiggerpicture substack, where I publish these posts first and for members (from next week) also bi-weekly videos looking at equity indices, bonds, currencies and commodities. Those videos are posted on my Youtube channel after a seven day delay. Links to all my posts from my charting substacks are also always posted on my twitter.

Thursday, 12 March 2026

It Takes Two To Tango

In my last post on Thursday 5th March I was looking at the possible topping setups on the US indices in the light of the war on Iran that started on Saturday February 28th.

That war is ongoing and while the US is now extending feelers about a ceasefire to the Iranian side, those have so far been rejected. That may be because the initial attacks on Iran were launched while the last peace talks were still ongoing, or it could be that Iran’s new Supreme Leader is still a bit annoyed about his parents, wife, and one of his children being killed in those attacks, but ultimately the problem here is that while one side unilaterally can start a war by attacking, one side unilaterally can only end a war by surrendering. Any other outcome requires at least some cooperation between the warring sides.

Iran has stated that it is settling in for an extended asymmetric war of attrition, and has stated a target for oil prices at $200 per barrel, with the aim of causing an economic crisis in the rest of the world. That’s actually not an unreasonable target, as adjusted for inflation that would be a bit lower than the current all time high at 147.27 made in 2008.

The Strait of Hormuz has been closed since the start of this war and Iran is laying mines in the narrow path that ships must follow to go through the Strait. There is no obvious current reason to think that this crisis is close to an end.

So why have we seen a big rally on equities this week? Well I was talking about this on my ‘The Bigger Picture’ video on Sunday night and noting that the Sunday open was well below the 3sd daily lower band on all four of the US equity indices I follow. I’m talking about this from about three minutes into the video and noting that a punch below the daily 3sd lower band is generally a point where I would be looking for a strong rally unless the news is really dire (Lehman as an example). What we have seen so far this week is that rally.

Rallies like this are often just a dead cat bounce before continuation lower and there’s not much reason to think at the time of writing that this is anything else.

Moving on to the charts, on the SPX daily chart the obvious oversold rally target would be the daily middle band and that has already been tested with a near miss on Tuesday.

The obvious resistance on the QQQ daily chart is the 50dma, which has also been tested. DIA and IWM are both lagging the others so far and have not rallied much above their 2sd lower bands.

SPX daily chart:

On the SPX hourly chart an H&S has broken down with a target in the 6540 area and has rallied back above the neckline but there’s nothing suggesting so far that this H&S will fail to reach target, which is close to a big support area and possible larger H&S neckline in the 6522 area.

SPX 60min chart:

On QQQ there is no equivalent current topping pattern that has broken down but there is of course a large possible double top pattern that on a sustained break below 580 would look for a target in the 523-4 area, close to a 50% retracement of the rising wedge from the April 2025 low.

QQQ 60min chart:

On DIA an H&S has broken down with a target in the 449-50 area, close to a 38.2% retracement of the rising wedge from the April 2025 low.

DIA 60min chart:

I had a very careful look at IWM and discovered that the initial rising wedge from the April 2025 low evolved into a high quality rising channel which broke down this week.

The bull flag that had been forming from the January high also broke down, but this rally has been too strong for that to be a decent topping pattern. Instead a possible H&S right shoulder has been forming this week and on a sustained break down below the H&S neckline currently in the 243.5 area would look for a target in the 216.5 area, slightly below the 50% retracement of the rising channel from the April 2025 low.

IWM 60min chart:

Obviously this is a high news environment but this Iran crisis may well be running on for a while and could get a lot worse. The US and Israel started this war without any input from Iran but to end it they will need Iran’s agreement. As with dancing the Tango, making peace is something that requires some cooperation and there is currently little indication that Iran is prepared to cooperate.

I wrote a post last week about the setups on oil and am planning to publish a follow-up to that later today, so look out for that if you’re interested in where oil might go if this war doesn’t end soon.

If you like my analysis and would like to see more, please take a free subscription at my chartingthemarkets substack, where I publish these posts first. I also do a premarket video every day on equity indices, bonds, currencies, energies, precious commodities and other commodities at 8.45am EST, but only for paying subscribers. Other places to find me are my page on the platform previously known as twitter, and my YouTube channel.

Thursday, 5 March 2026

War is Peace

The conflict in Iran is only a few days old, and as yet it is hard to see how it will develop, and there seems little agreement as to whether it counts as a war. Both Trump and Hegseth have referred to it repeatedly as a war, but as only Congress has the constitutional authority to declare war in the US, there have also been numerous explanations from administration officials and the Speaker of the House as to why it is not actually a war. I think President Trump described it as a ‘Special Military Operation’ at one point yesterday and for a number of reasons perhaps that is the best way to describe it.

I wrote a post on Tuesday looking at the possible major disruption in oil markets that could happen if Iran can close the Strait of Hormuz to commercial traffic and the US is trying to prevent that, but we’ll have to see how that goes.

The key question here is what happens next in Iran. Obviously the aerial bombardment has been going well, but the US does not have full control of Iranian airspace. If it did there would not be Iranian missiles and drones exploding across the Middle East.

In the background of course is the fact that since the Russians invaded Ukraine in 2022 in their own ‘Special Military Operation’, the face of modern warfare has changed dramatically, with drones emerging as likely the biggest revolution in the way war is waged since the inception of modern air warfare in the 1930s.

The US, while undeniably very strong militarily, is just getting started in drone warfare and only two nations, Ukraine and Russia, have much experience in waging this kind of warfare. It is worth noting though that Russia’s Shaheed drone was designed in and initially imported from Iran, so the only other nation with any significant claim to experience in this kind of warfare is Iran. At minimum they are certainly very capable of building large quantities of cheap and deadly military drones.

Iran is not so far showing any inclination to surrender, and it seems possible at the time of writing that this campaign by Israel ands the US may actually unite much of the Iranian population behind the regime. If this ‘Special Military Operation’ continues over months, and possibly years, then we have yet to see how well Iran can leverage their expertise in making cheap and effective drones into closing the Strait of Hormuz and causing chaos across the Middle East.

I would also note though that in effect the modern drone is a kamikaze plane that does not require a human pilot to be in the flying bomb. Kamikaze planes in WW2 sank several dozen US warships and killed thousands of US naval personnel. In the Black Sea since 2022 Ukraine has devastated the Russian fleet with just drones, to the extent that Russia has withdrawn the remnants of that fleet to a safe distance where it is no longer supporting the Russian invasion. Sinking the Iranian Navy may not give the US control of the Strait of Hormuz, and potentially may lead to cheap Iranian drones sinking very expensive and fully crewed US warships. We’ll see.

If all does not go well then I have already written that post on Tuesday about how closure of the Strait of Hormuz could potentially send oil markets to new all time highs, showing the setups that might deliver that which have already started to play out.

On equity markets the effect has so far been muted, and markets seem to be waiting to see how this develops. If all goes well then there may be no significant fallout on equity markets, but today I’ll be looking at the setup here in the event that all does not go well.

To start with I’d note that there is considerable history of large drawdowns on equity markets in US midterm years. I posted the chart below earlier this week as my ‘Chart of the Day’ on my premarket post and it shows the intra-year drawdowns in midterm years over the last century. I noted then that of the 25 midterm years listed, 11 had drawdowns over 20% and 14 had drawdowns over 18%:

In terms of topping setups on equities here, there are some decent ones formed from the patterns that developed from the April 2025 lows.

On SPX the rising wedge from April peaked in October and broke down in November. Since then SPX has essentially traded sideways and I’ve been watching a possible H&S that has been forming and broke down at the start of this week with a target in the 6540 area. That target is close to a possible larger H&S neckline, or asymmetric double top support, in the 6522 area This is a possible overall setup for a strong decline that could target the 6040 - 6120 area:

On QQQ the rising wedge from April peaked in October and broke down in November. Since then QQQ has essentially traded sideways and I’ve been watching a possible double top that has been forming since that October high. I would note that while this is a lovely double top on QQQ it is less nice on NDX as the second high there was just shy of a new all time high. If this double top was to break down under 580 the target would be in the 523 - 4 area, close to a 50% retracement of the move up from the April low:

On DIA the rising wedge from April peaked in October and broke down in November before a return to wedge resistance in February that expanded the original wedge. A possible H&S is forming that on a sustained break below the low this week at 476.73 would look for a target in the 450 area:

On IWM the rising wedge from April peaked and broke down in October before a return and overthrow of wedge resistance in January that expanded the original wedge. That expanded wedge hasn’t broken down yet, there is no obvious topping pattern formed, and the obvious pattern established from the January high so far is a bull flag in the form of a falling wedge.

There are two obvious options for forming a topping pattern on IWM. The first is that the bull flag delivers a retest of the all time high and establishes a double top setup. The second is that the bull flag breaks down, as happens perhaps 30% of the time, towards a target in the 235 area. By definition though, bull flags lean strongly bullish until demonstrated otherwise. I would note that a daily RSI 14 sell signal fixed at the last all time high, and hasn’t reached target yet, though daily RSI 5 sell signals are both more common and more reliable:

It may be that the Iran war/conflict/operation/whatever all goes well and there is no serious blowback on equities as a result, but the history of US wars in the Middle East and elsewhere since 1946 suggests that there is at least a significant probability that it develops into an asymmetric quagmire. We’ll see how that goes, but in the event that all does not go well, these are the patterns that I am watching.

If you like my analysis and would like to see more, please take a free subscription at my chartingthemarkets substack, where I publish these posts first. I also do a premarket video every day on equity indices, bonds, currencies, energies, precious commodities and other commodities at 8.45am EST, but only for paying subscribers. Other places to find me are my page on the platform previously known as twitter, and my YouTube channel.

Tuesday, 3 March 2026

The Bigger Picture on ... Oil

Over the last year on my The Bigger Picture videos I’ve been watching a potentially very bullish setup form across the oil markets and I was planning a post on that this week before the expected attack on Iran. That attack happened earlier than I expected on Saturday so I’m doing that today.

Before I look at that though, I’ll go through the reason why this conflict in Iran could cause a really serious problem in world oil markets in coming weeks and perhaps months.

World oil demand is currently about 105 million barrels per day. In the absence of major supply issues there is currently a surplus of two to three million barrels per day in oil supply above that demand level which is the reason that prices have been soft and kicking around the big support area at $50 to $55 in recent months.

Of that supply Iran has been exporting about two million barrels a day in recent years, so an interruption to that supply wouldn’t obviously disrupt oil markets much, but the real problem would be disruption to oil being shipped through the Strait of Hormuz.

The Strait of Hormuz is one of the most strategically important choke points in the world, as the only sea passage out of the Persian Gulf into the open ocean, and has never been closed for an extended period during Middle East conflicts, but Iran has made preparations to close it before and is planning to close it now. In the event of an extended conflict now the Strait may be closed to shipping for months. As of right now almost all shipping through the Strait of Hormuz was stopped over the weekend after Lloyds of London has shifted to wartime insurance rates for all shipping through the Strait. Iran has stated that has closed the Strait of Hormuz and will fire on any shipping attempting to go through it.

How much oil is shipped through the Strait of Hormuz? Well I’ve read estimates ranging between 13 to 20 million barrels per day and Wikipedia is stating that 25% of seaborne oil and 20% of liquefied natural gas is shipped annually through the Strait of Hormuz. Most of this oil can only be shipped through the Strait so if this is disrupted for more than a few days then that would likely cause a major supply disruption that could trigger a major price spike.

This could cause an issue in natural gas markets too of course, but in terms of oil markets I’ve been watching a very bullish setup form over the last year that may now be about to play out over the next few weeks.

The bullish setup on the three oil markets I watch isn’t quite the same but they rhyme strongly enough that they are in effect variants on the same setup.

On WTIC (light crude oil) there was a big high in 2022 at 126.42. From there a decent quality falling wedge formed and broke up in mid-2025 to a high at 78.40. The wedge low at 56.06 was retested in late 2026, establishing a high quality double bottom setup.

WTIC monthly chart:

On GASO (gasoline) there was a big high in 2022 at 4.12. From there a decent quality falling wedge formed and broke up in mid-2025 to a high at 2.38. The subsequent move down reached and slightly underthrew wedge support so I redrew it as a larger falling wedge, noting on the chart on 12th October that there was possible setup going much lower but I much preferred the bullish falling wedge setup. The updated falling wedge broke up again in February with a decent quality double bottom setup

GASO monthly chart:

On HOIL (heating oil) there was a big high in 2022 at 4.46. From there a decent quality falling wedge formed and broke up in mid-2025. Since then a high quality inverted head and shoulders has formed which broke up last week with a target in the 3.47 area.

HOIL weekly chart:

On the WTIC daily chart a smaller double bottom broke up on 1st February with a target in the 68.90 to 70 range and that target was reached last night. There is a larger double bottom setup that on a sustained break up over 78.40 would have a target in the 10.72 to 101.82 area.

It is also possible that the falling wedge from the 2022 high might well be a bull flag, in which case the move might extend higher into a retest of that 2022 high at 126.42.

WTIC daily chart:

On the GASO daily chart there is a smaller medium quality IHS that I have not marked in that has broke up last week with a target in the 2.36 area and reached target yesterday. The main reversal pattern however is the large double bottom broke up yesterday over 2.384 with a target in the 2.9 to 3.09 range.

It is also possible that the falling wedge from the 2022 high might well be a bull flag, though it retraced over 61.8% from that high which has lowered the pattern quality, in which case the move might extend higher into a retest of that 2022 high at 4.12.

GASO daily chart:

On the HOIL daily chart a good quality IHS formed and then broke up last June before failing in December. That evolved into a larger good quality IHS that broke up last week with a target in the 3.47 area.

It is also possible that the falling wedge from the 2022 high might well be a bull flag, though it retraced over 61.8% from that high which has lowered the pattern quality, in which case the move might extend higher into a retest of that 2022 high at 4.46.

HOIL daily chart:

What’s the bottom line here? In the event of a serious supply disruption in oil markets, which may well now be caused by the Strait of Hormuz being closed to commercial traffic for several weeks or months, there is a clear setup here that could take oil prices back to the major highs made in 2022, and potentially to new all time highs across the board.

The current all time highs on were made at the 2022 highs on Heating Oil at 4.46, and Gasoline at 4.12, and at the 2008 high on Light Crude at 147.27, though the 2022 lower high at 126.42 would be the bull flag target.

Was I expecting this? No, I was expecting a big price shock on oil markets in the next year or two but was leaning towards that coming from a collapse of the government in Russia, which is clearly losing the war with Ukraine and is running low on money and morale. I’m still thinking we may well see that in a year or two. Russia has been supplying about 9 million barrels per day into world oil markets.

In the short term any extended supply squeeze on oil is good news for Russia and would likely extend the war in Ukraine.

If you like my analysis and would like to see more, please take a free subscription at my thebiggerpicture substack, where I publish these posts first and for members (from next week) also bi-weekly videos looking at equity indices, bonds, currencies and commodities. Those videos are posted on my Youtube channel after a seven day delay. Links to all my posts from my charting substacks are also always posted on my twitter.