
In my last post on oil on Tuesday 3rd March I was laying out the very bullish scenario on oil that had been forming since a series of falling wedges from the 2022 highs on light crude, heating oil and gasoline broke up in June 2025.
The large bottoming patterns on heating oil and gasoline had already started to break up when I wrote that post, and by Sunday night the double bottom on light crude had also broken up, and all of those bottoming patterns had reached target. So what now?
Well I’ve been doing a lot of reading on the Iran conflict over the last few days, and it’s hard to say how long this war might last.
What is certain is that for the war to end Iran will need to agree to end it, and at the time of writing they are refusing to even enter talks about ending this war without guarantees that they will not be attacked again and that the US and Israel will pay them reparations for the recent attacks.
I see three obvious ways that this conflict could end or evolve.
The first of these three main options is that the US knocks out most Iranian oil production and this forces Iran to the table. Knocking out that oil production would be surprisingly easy as 90% of Iran’s oil production flows through Kharg Island, in the Persian Gulf opposite Kuwait. The US has apparently been looking at the possibility of taking over that island and, if that was occupied by the US, the financial consequences could potentially force Iran into talks at a serious disadvantage.
The second of these three main options is that the war continues, but the US allies in the Persian Gulf, Kuwait, Saudi Arabia, Qatar, United Arab Emirates, Oman and perhaps Iraq make a separate peace with Iran. All of these have US bases on their territory and they could either close those bases or agree that the US would not be allowed to attack Iran from these bases.
Iran has offered all of these countries a separate peace if they no longer allow US attacks from their territory and is also offering to open the Strait of Hormuz to their exports.
This is a strong offer for two reasons.
The first is that seven million barrels per day of oil production from these states is currently stopped and much of that which is still happening cannot be exported as it needs to go through the Strait of Hormuz. A lot of natural gas production is also currently shut down and 25% of LNG worldwide is transported through the Strait. This hasn’t had a big effect on natural gas prices in the US yet but if the conflict continues that might well change. It has already had a big effect on natural gas prices in Europe.
The second is that Iran has already attacked the desalinisation plant in Bahrain and is threatening to attack more desalinisation plants. Iran gets about 3% of their water from desalinisation but across these other Gulf States desalinated water is much more important. In terms of drinking water:
3% in Iran
Iraq - Unable to find a number but likely lower than any other gulf state excluding Iran
42% in UAE
70% in Saudi Arabia
86% in Oman
Over 90% in Kuwait
Over 90% in Qatar
Over 90% in Bahrain
The availability of desalinised water is therefore an existential threat in most of these gulf states, excluding Iran and maybe Iraq, and sufficient damage to these plants could risk large areas of these states becoming uninhabitable. It is already clear that the US cannot defend these states from these and other threats and, given that many of these plants draw water from the Persian Gulf, there is also a high risk that a large oil spill in the gulf could also compromise some or all of these desalinisation plants.
There is therefore a large possibility that the Persian Gulf states may make a separate peace with Iran and that peace could involve the removal of all US bases in the region.
If the peace involved a reopening of the Strait of Hormuz and a return to full oil and gas production in the gulf states this would likely calm energy markets soon after.
The third of these three main options is that the war continues for an indefinite period with Iran continuing to attack their neighbours in the Persian Gulf even after the current bombing campaign by the US and Israel ends, and the Strait of Hormuz stays closed.
In that event 10% to 20% of world oil production stays off the market, oil and perhaps natural gas markets spike to new all time highs and perhaps a lot higher and there may be an oil shock comparable or bigger than the oil shock of the early 1970s, triggering recession and inflation throughout the developed world.
If there is also a major interruption to desalinisation in the gulf states then their economies might collapse and trigger a historic refugee crisis, as a large proportion of the Middle East becomes effectively uninhabitable due to water shortages.
Of these three options I think the first and second options are the more likely ones, the third is the disaster scenario that the gulf states will likely go to great lengths to avoid, even at the cost of breaking their current alliances with the US.
With these options in mind, let’s move on to the charts.
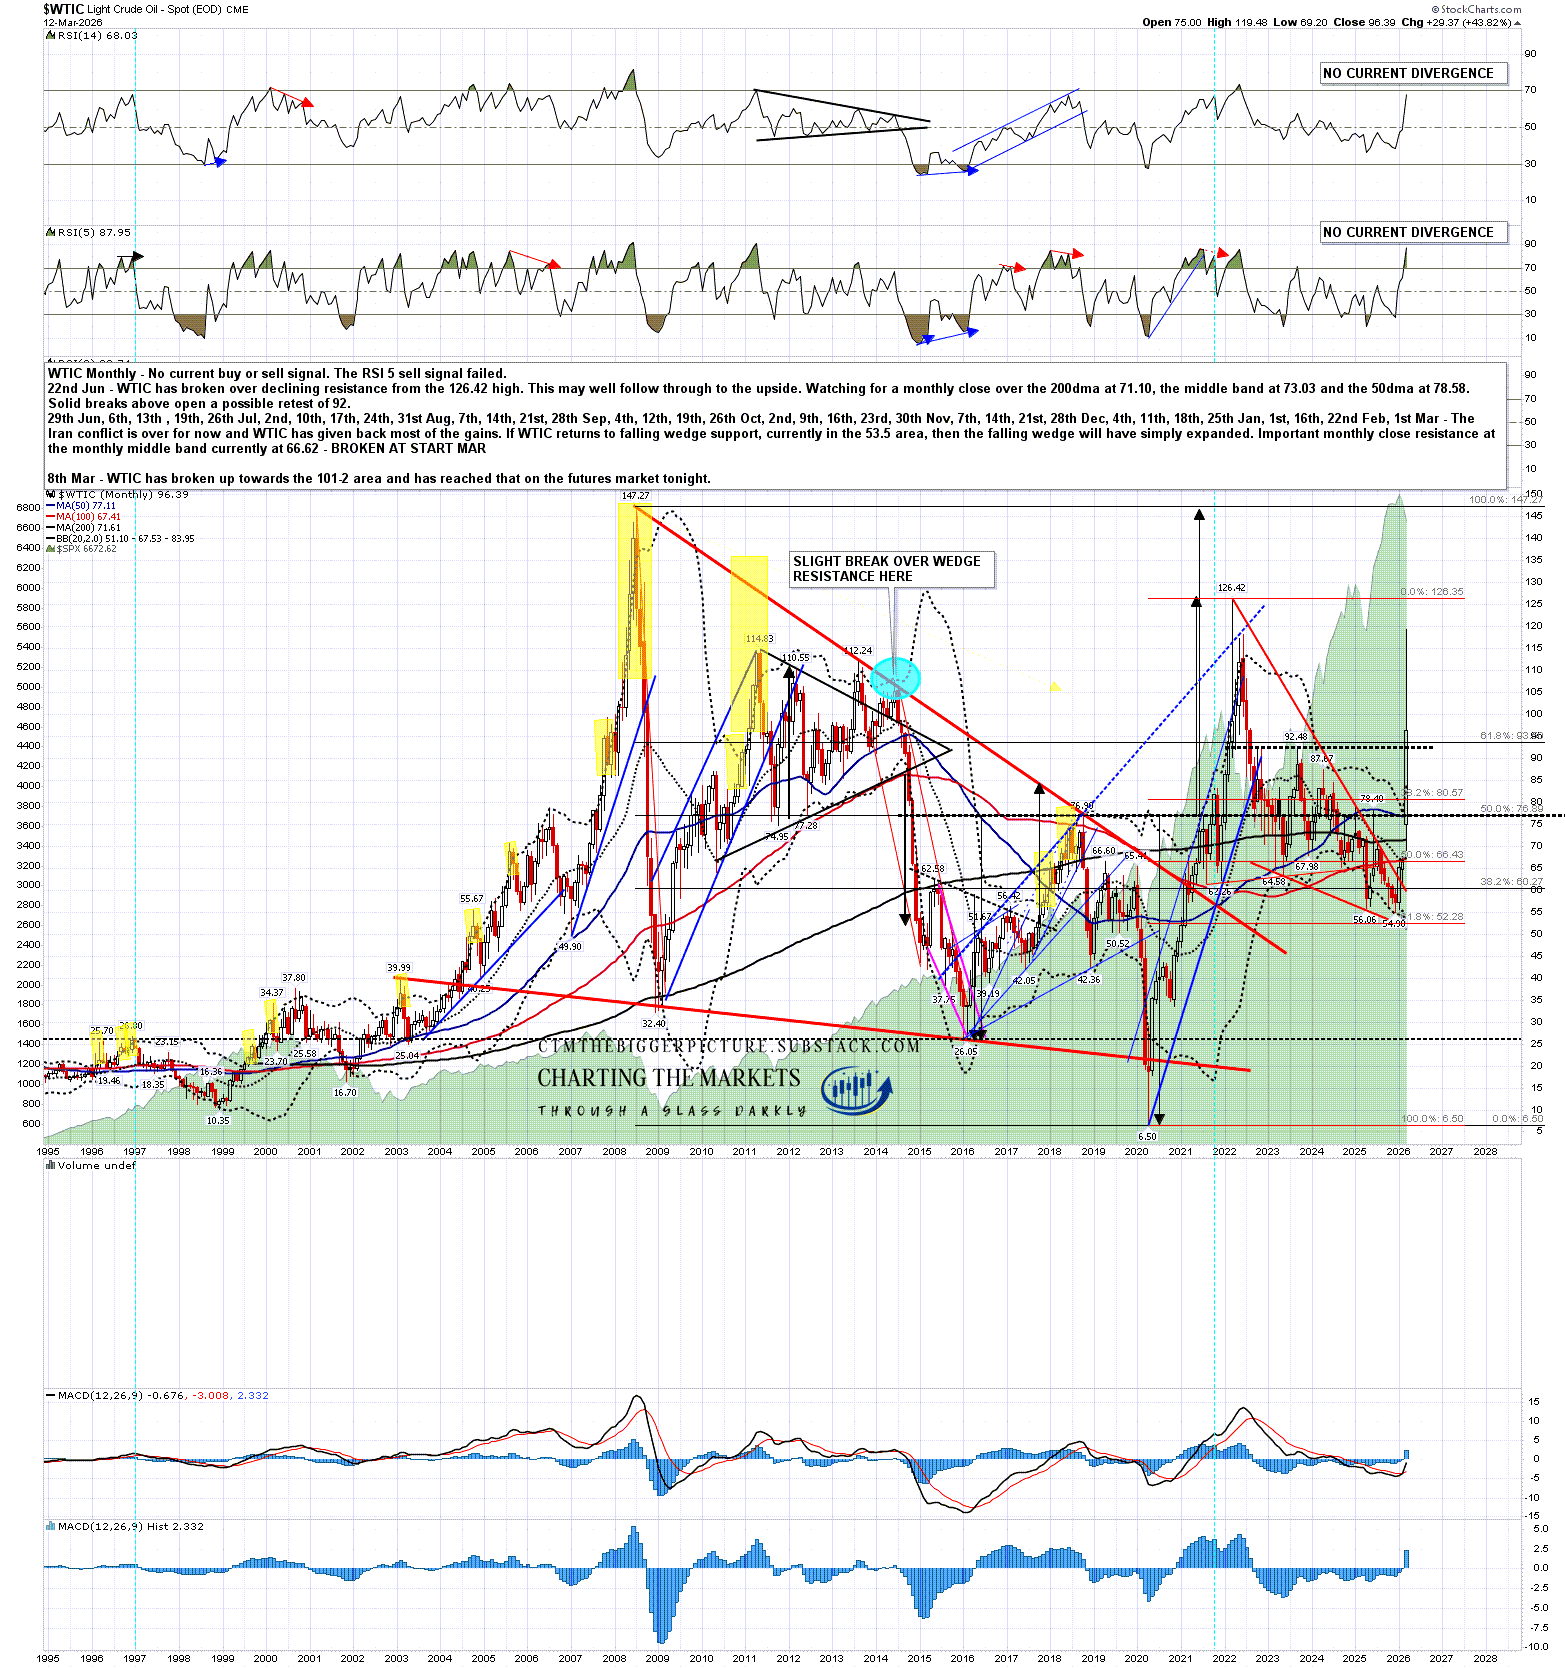
On light crude oil (WTIC) the double bottom broke up with a target in the 101-2 area on Thursday 5th March and made target at the futures open on Sunday night. The high on Sunday night was at 119.48 and in my ‘The Bigger Picture’ video recorded and posted shortly after the open I was talking (from about the 22.00 to 27.00 min mark) about the possible alternative routes excluding the Strait of Hormuz and the large strategic oil reserves that meant that after this initial spike up we might see a very sharp correction down on oil, which we then saw of course.
TRIGGER WARNING - I would warn that in that segment I was joking about the possibility that Pete Hegseth might in future consider doing his press conferences in a weightlifter’s posing pouch and oiling his muscles to strike poses as he spoke to the press, so if that image is too much for you then you probably shouldn’t watch this.
On all three of WTIC, HOIL (Heating Oil) and GASO (Gasoline) I noted that the falling wedges from the 2022 highs were all potentially bull flags, so we might soon see retests of those highs. In the case of WTIC that high would be at 126.42, still well short of the 2008 all time high at 147.27.
WTIC monthly chart:
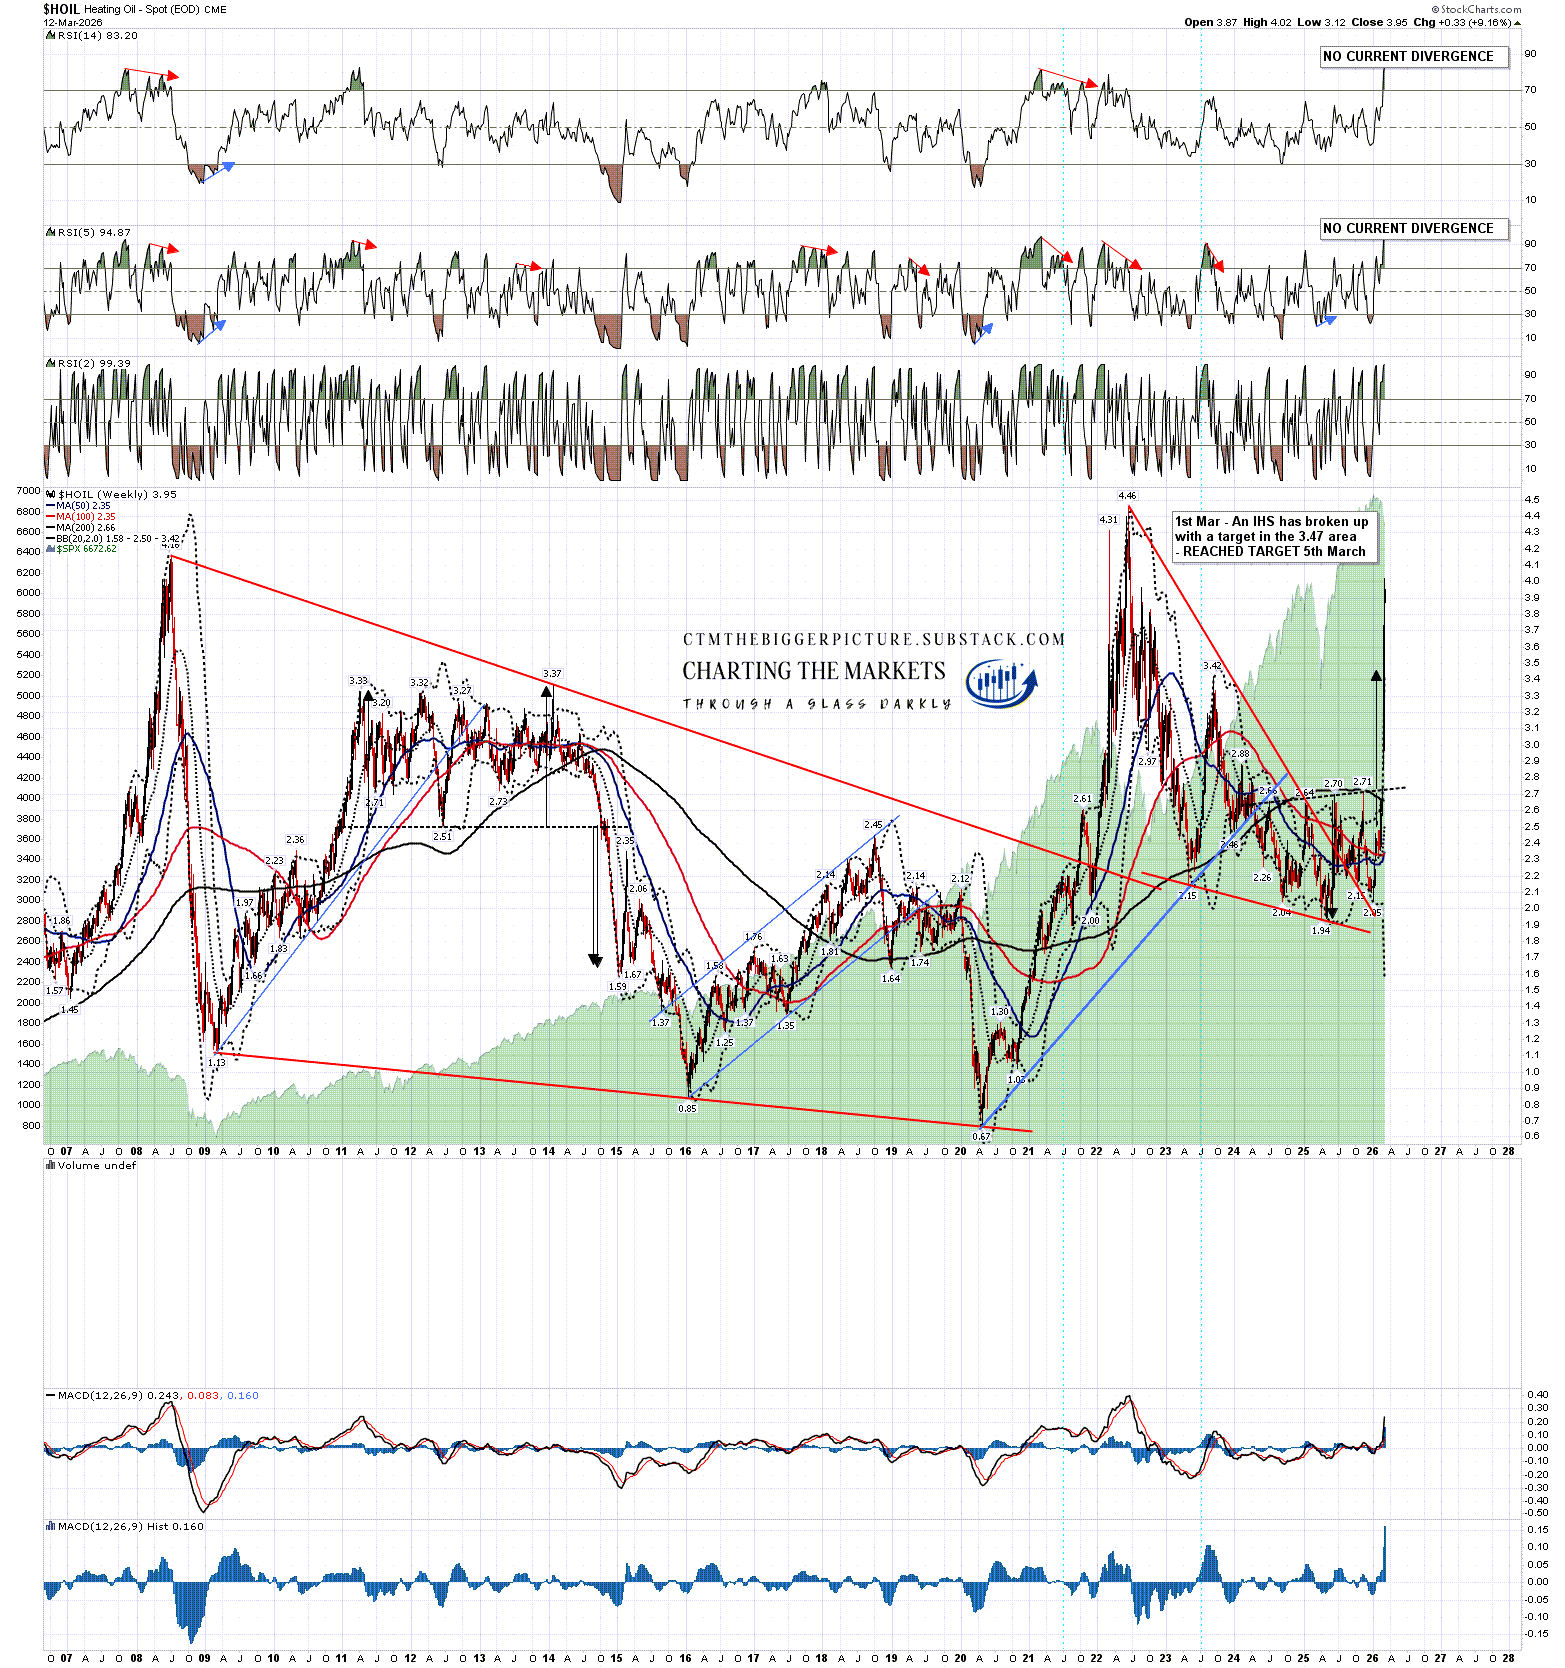
On heating oil (HOIL) the IHS broke up with a target in the 3.47 area and made target at the futures open on Sunday night. The high on Sunday night was at 4.02, short of but not far away from the all time high (and bull flag target) made in 2022 at 4.46.
HOIL weekly chart:
On gasoline (GASO) the double bottom broke up with a target in the 2.913 to 3.092 area and made the lower target at the futures open on Sunday night. The high on Sunday night was at 3.15, still well short of the all time high (and bull flag target) made in 2022 at 4.12.
GASO weekly chart:

Iran has stated an aim of keeping the Strait of Hormuz closed indefinitely (if this conflict continues) with the intention of forcing light crude oil (WTIC) prices up to $200 per barrel. If they can keep the Strait closed and if the conflict continues for months then that is potentially doable. In inflation adjusted terms that wouldn’t even be a new all time high on WTIC, as the current all time high was made in 2008 at $147.27 and cumulative US inflation since then is slightly over 51%, so a new all time high in real terms would be in the $225 area.
I’m hoping that doesn’t happen, as the economic pain across the developed world would be high, and the war might well gut the economies of the US allies in the Persian Gulf. That would be a very high price to pay for whatever the objectives of this war might be, though as Donald Trump noted yesterday, as the US is currently the largest oil producer in the world, that wouldn’t be a price that the US as a whole would be paying, though it would make the current affordability crisis for ordinary US citizens a lot worse of course.
If you like my analysis and would like to see more, please take a free subscription at my thebiggerpicture substack, where I publish these posts first and for members (from next week) also bi-weekly videos looking at equity indices, bonds, currencies and commodities. Those videos are posted on my Youtube channel after a seven day delay. Links to all my posts from my charting substacks are also always posted on my twitter.
No comments:
Post a Comment