
In my last post on Monday I gave 10% odds that a deal with Iran was reached by the time that Trump’s deadline expired yesterday evening, and no deal was reached, but Trump nonetheless said that the Iran’s existing ten point point proposal to end the war was a sufficient basis to start to negotiate a deal over the next two weeks, during which time there would be a ceasefire. US equity markets have rallied and oil prices have dropped hard on that news.
Iran’s ten point plan is as follows:
A guarantee that Iran will not be attacked again.
A permanent end to the war, not just a ceasefire.
An end to Israeli strikes in Lebanon and against Iranian allies.
Lifting of all US sanctions in Iran.
Reopening of the Strait of Hormuz with a transit fee of $2 million per ship.
Continuation of Iran’s control over the Strait of Hormuz.
Acceptance of Iran’s right to enrich uranium for its nuclear program.
Compensation for war damages to Iran.
Withdrawal of US combat forces from the region.
End to all UN and IAEA resolutions targeting Iran.
Obviously this is the same ten point plan that Iran presented days into the war as a precondition for talks and had previously been dismissed as an unrealistic demand for a humiliating surrender by the US, but it seems likely that the US will be trying to negotiate a variant on these ten points that would allow Trump to save some face.
In the short term there are a few issues:
The US has not explicitly accepted these ten points in full, so Iran will need to be flexible about negotiating without these having first all been agreed.
Israel has refused a ceasefire in Lebanon, and Iran may not accept the rest of the ceasefire without this.
US Gulf allies are very unhappy with a new status quo that would likely leave Iran much more powerful in the region after this war.
It is unclear to what extent the Strait of Hormuz will be open during these negotiations. Before the war 100 to 200 vessels per day passed through the Strait and so far Iran only seems to have agreed to allow ten to fifteen vessels through the Strait, and it currently seems unclear whether that would be per day or in total during the two week negotiation window.
In the meantime Iranian crowds are celebrating complete victory over the US, while Trump has declared complete victory over Iran.
Will these negotiations be brought to a successful conclusion? Hard to say but given that Trump’s rhetoric yesterday seemed to be suggesting that Iran might be destroyed with nuclear weapons over the rest of this week, pretty much anything else seems like good news.

Do we likely have a pause in the Iran War that could last at least until the end of this week? Yes, and that brings us back to the US equity markets, where a series of bottoming patterns broke up yesterday afternoon and overnight.
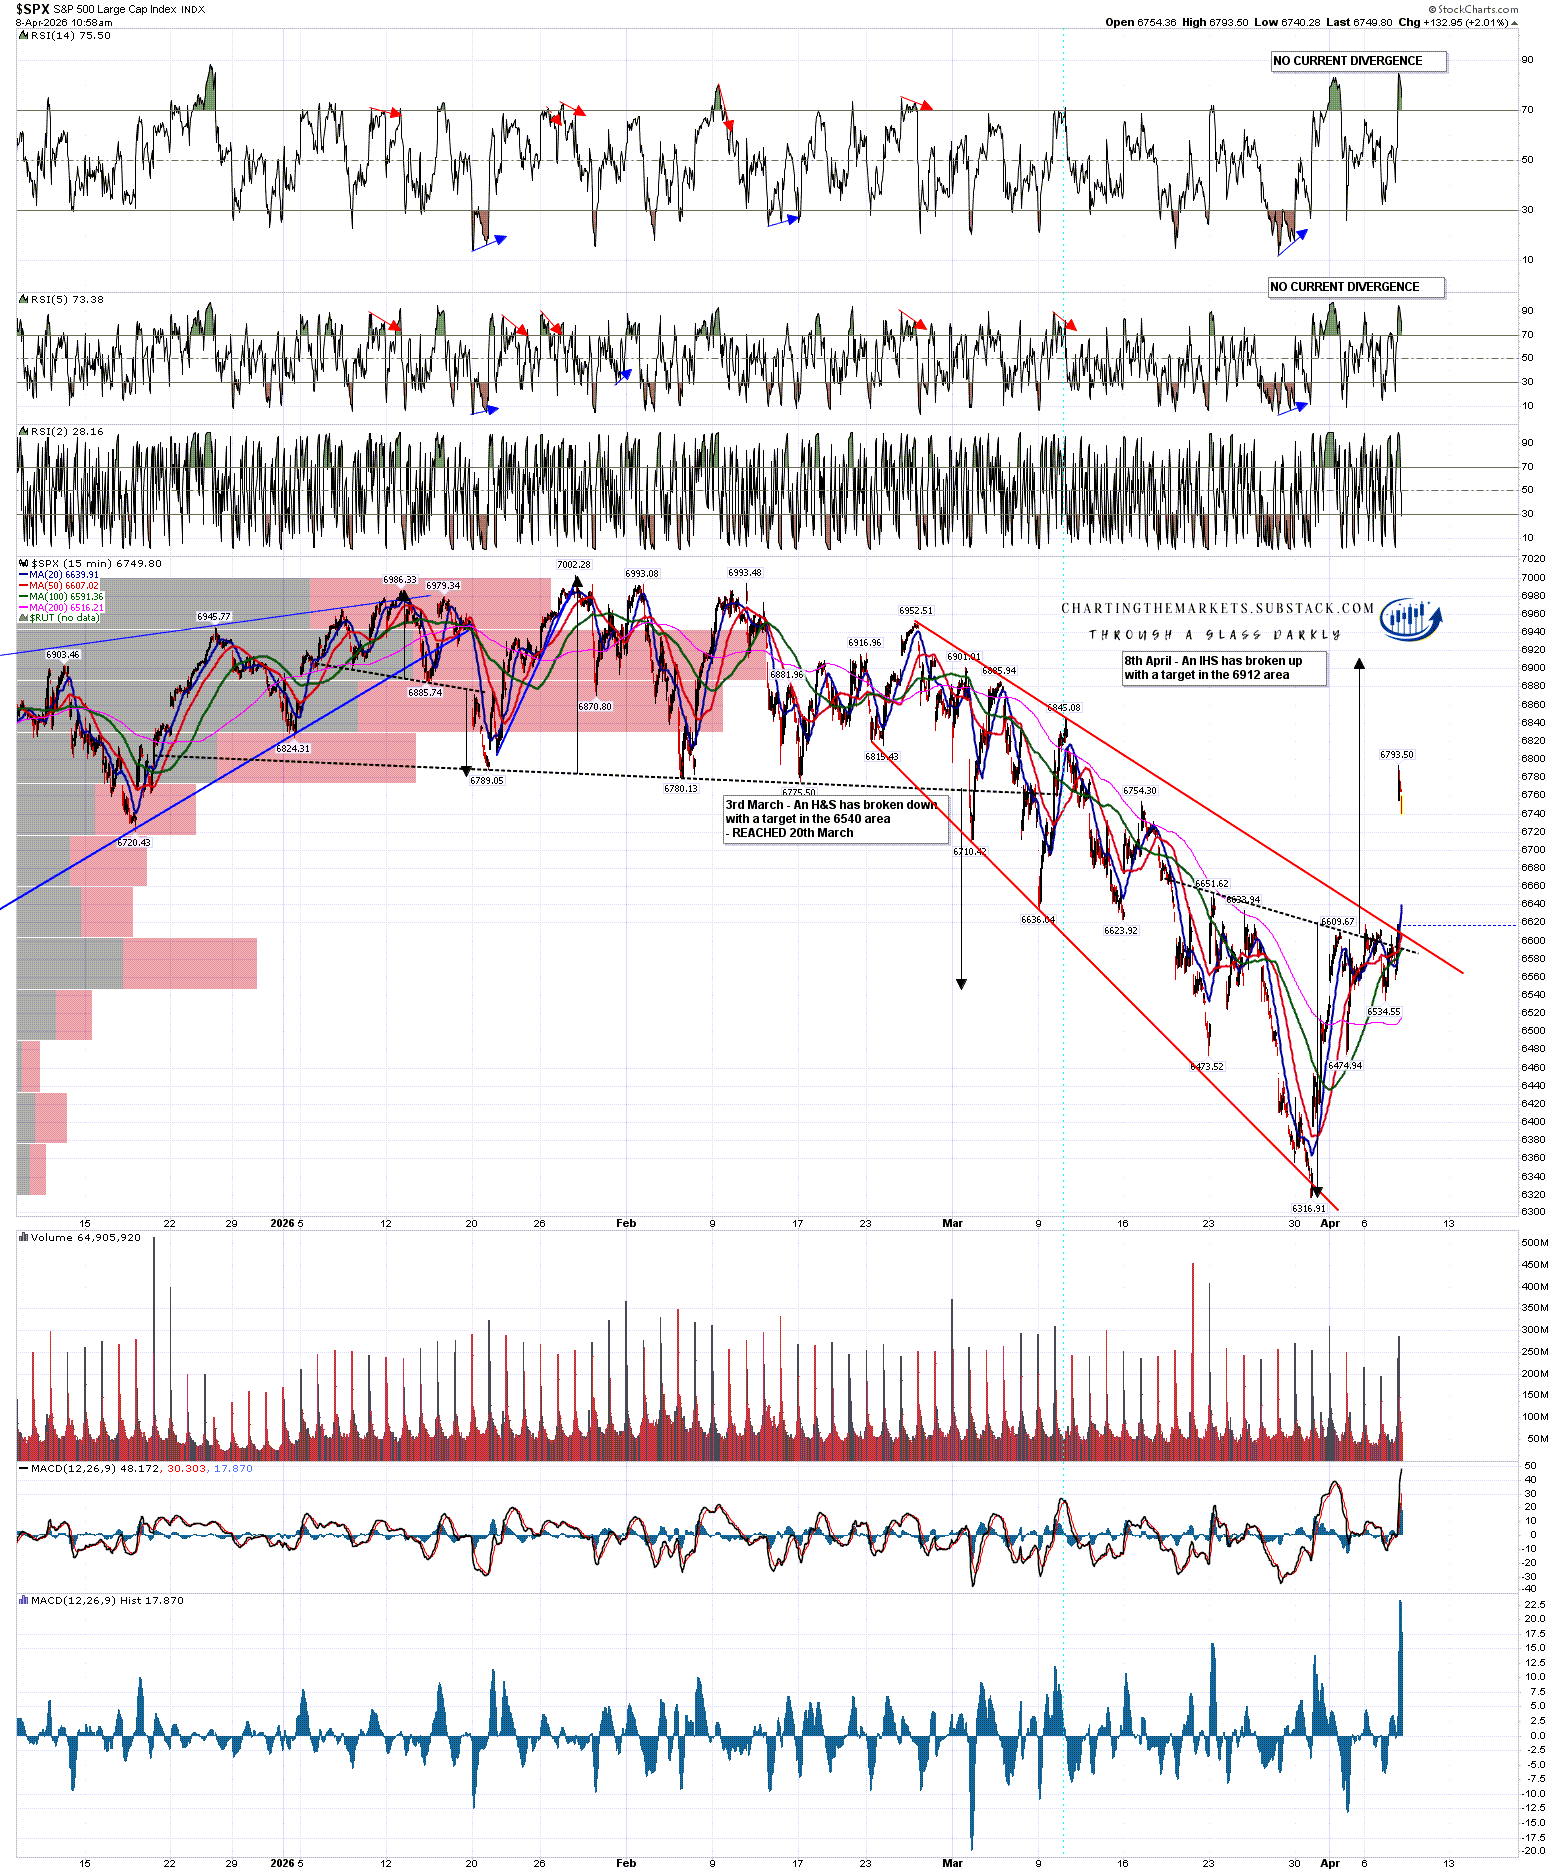
On SPX an IHS has broken up with a target in the 6912 area:
SPX 15min chart:
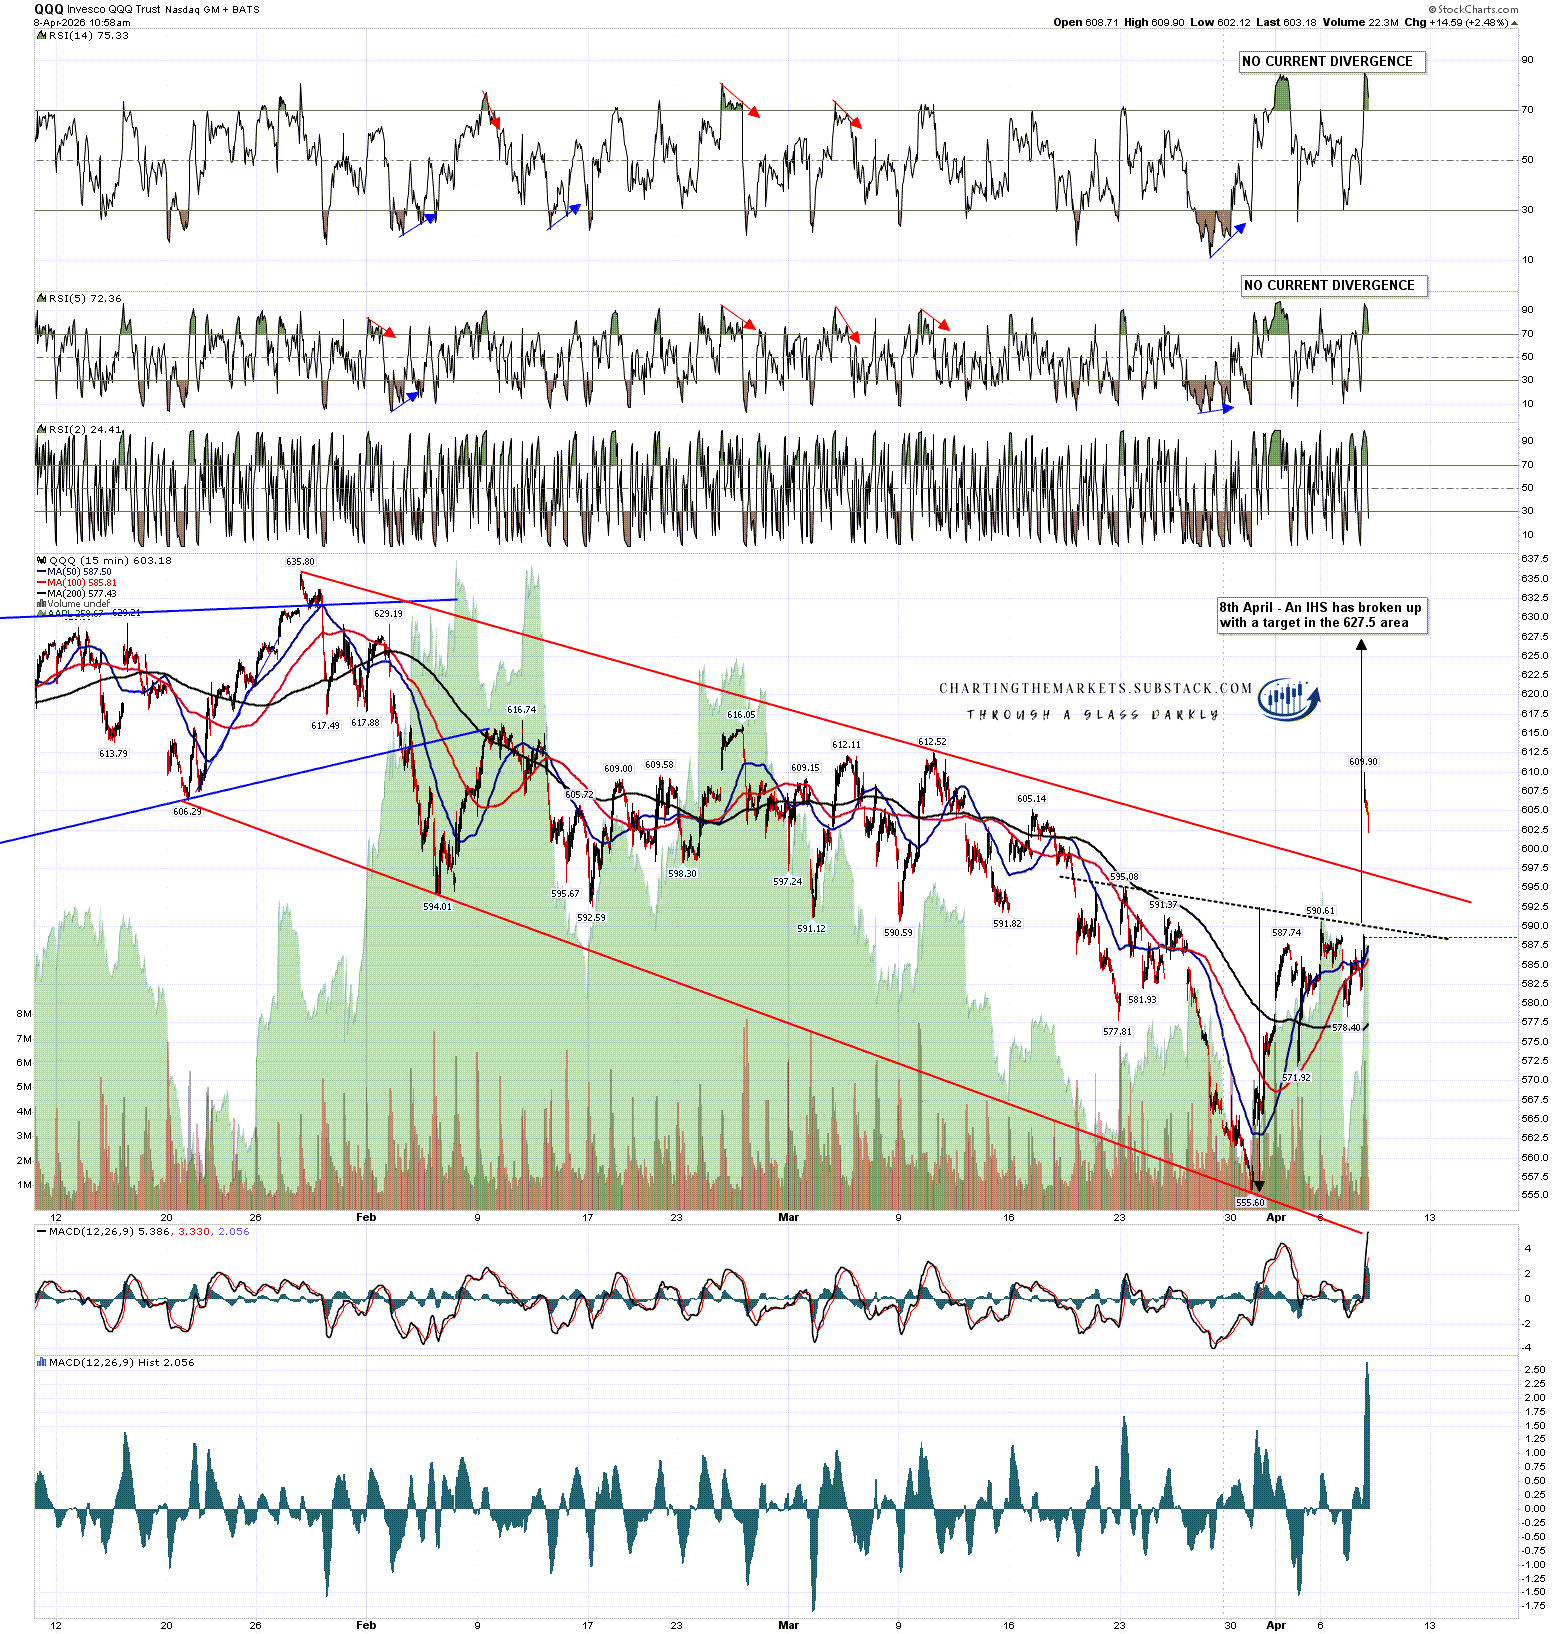
On QQQ an IHS has broken up with a target in the 627.50 area:
QQQ 15min chart:
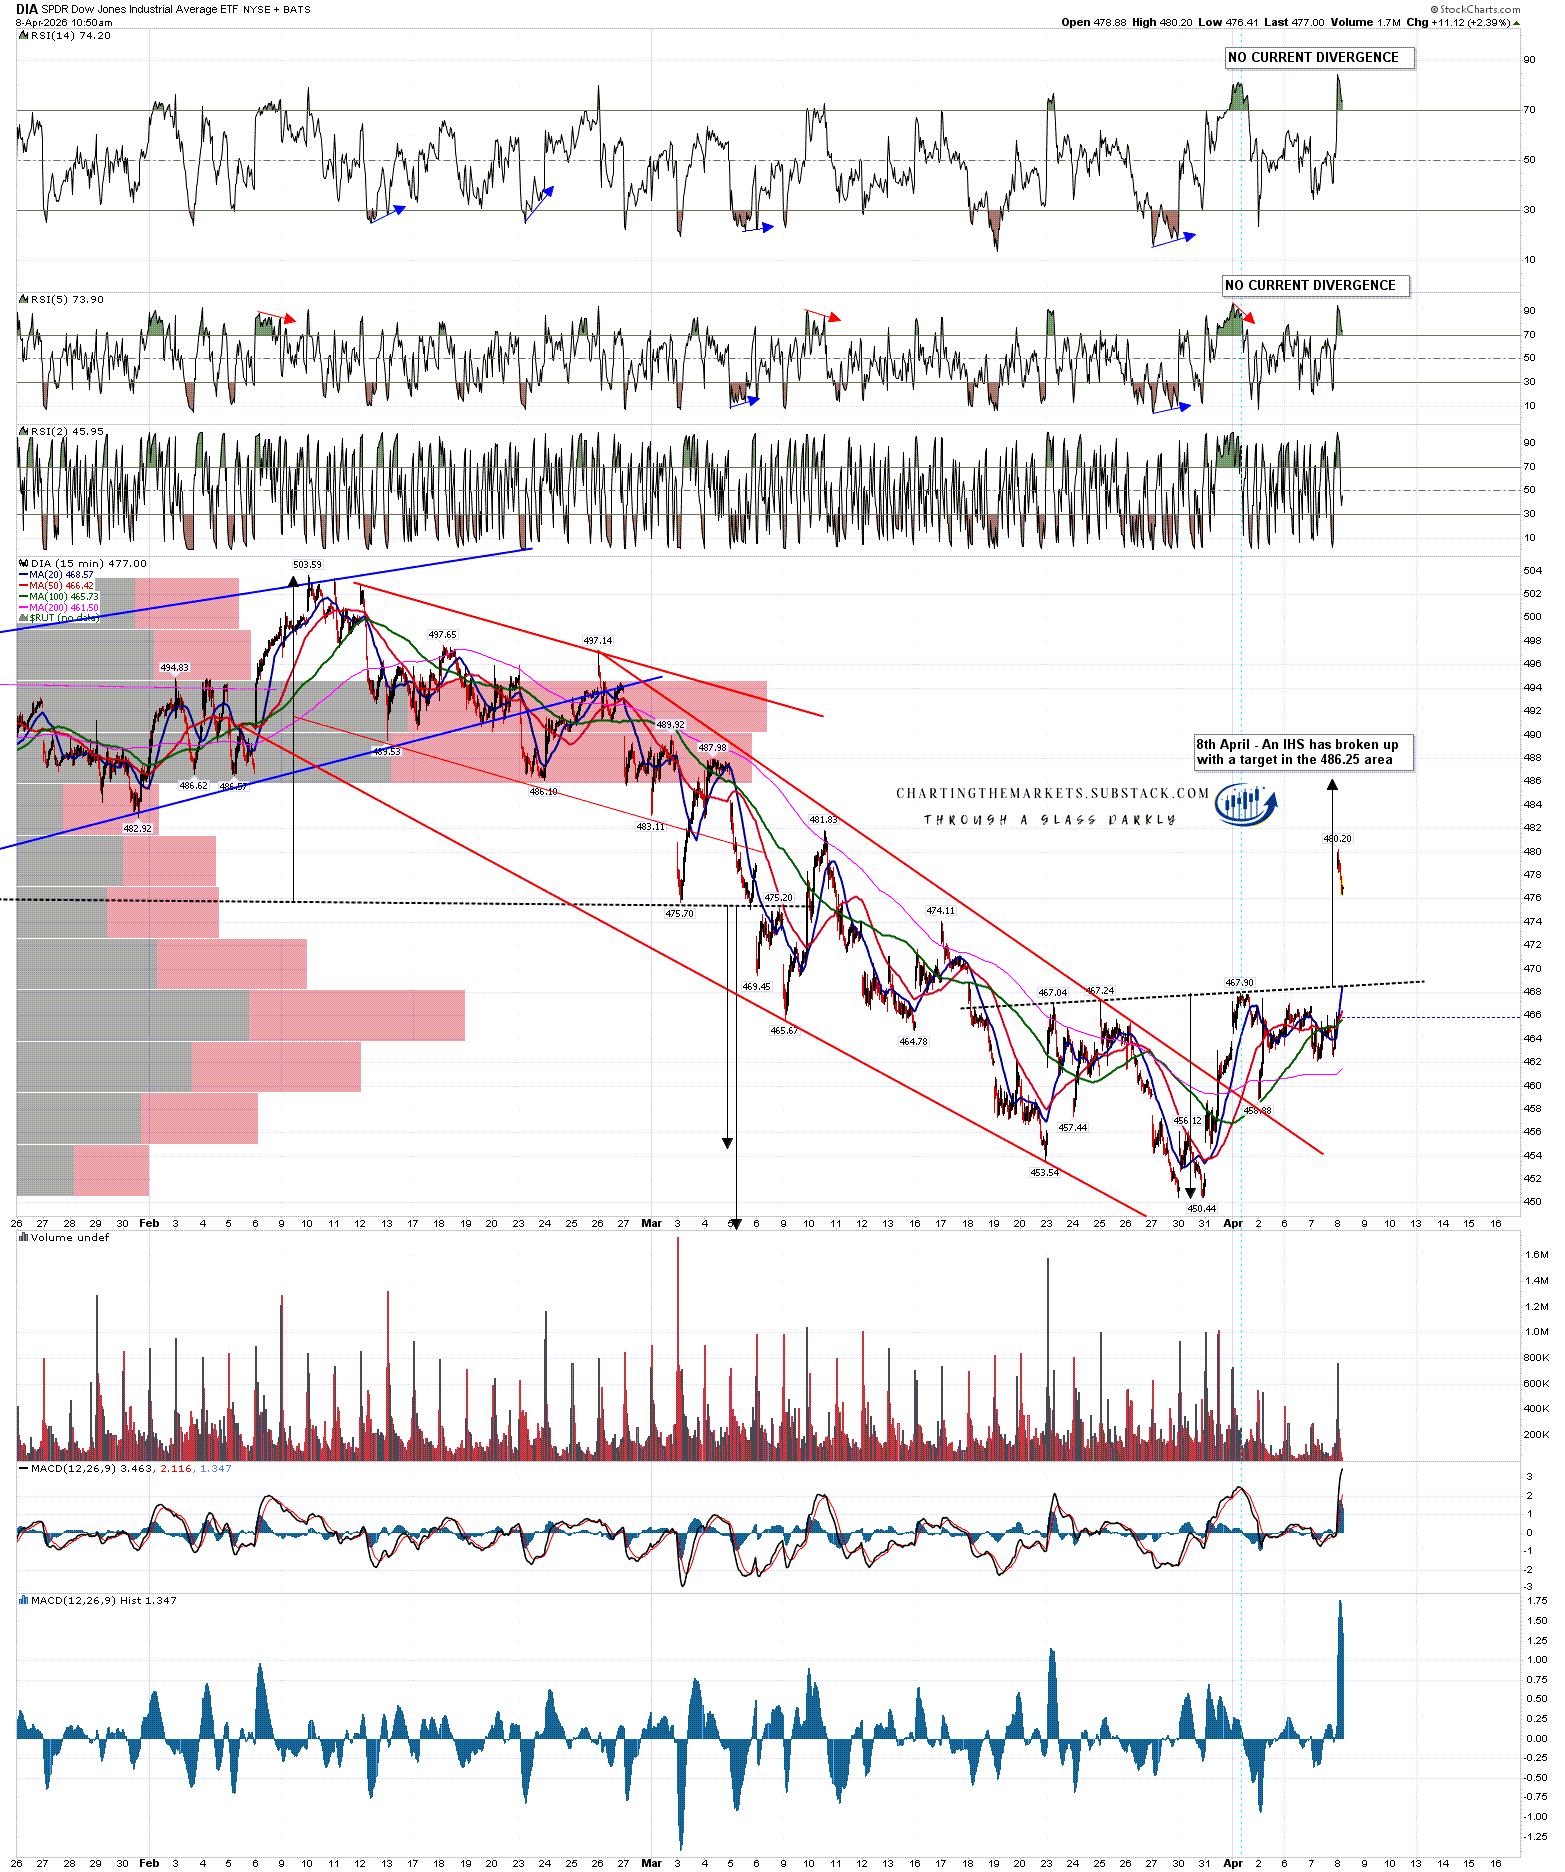
On DIA an IHS has broken up with a target in the 486.25 area:
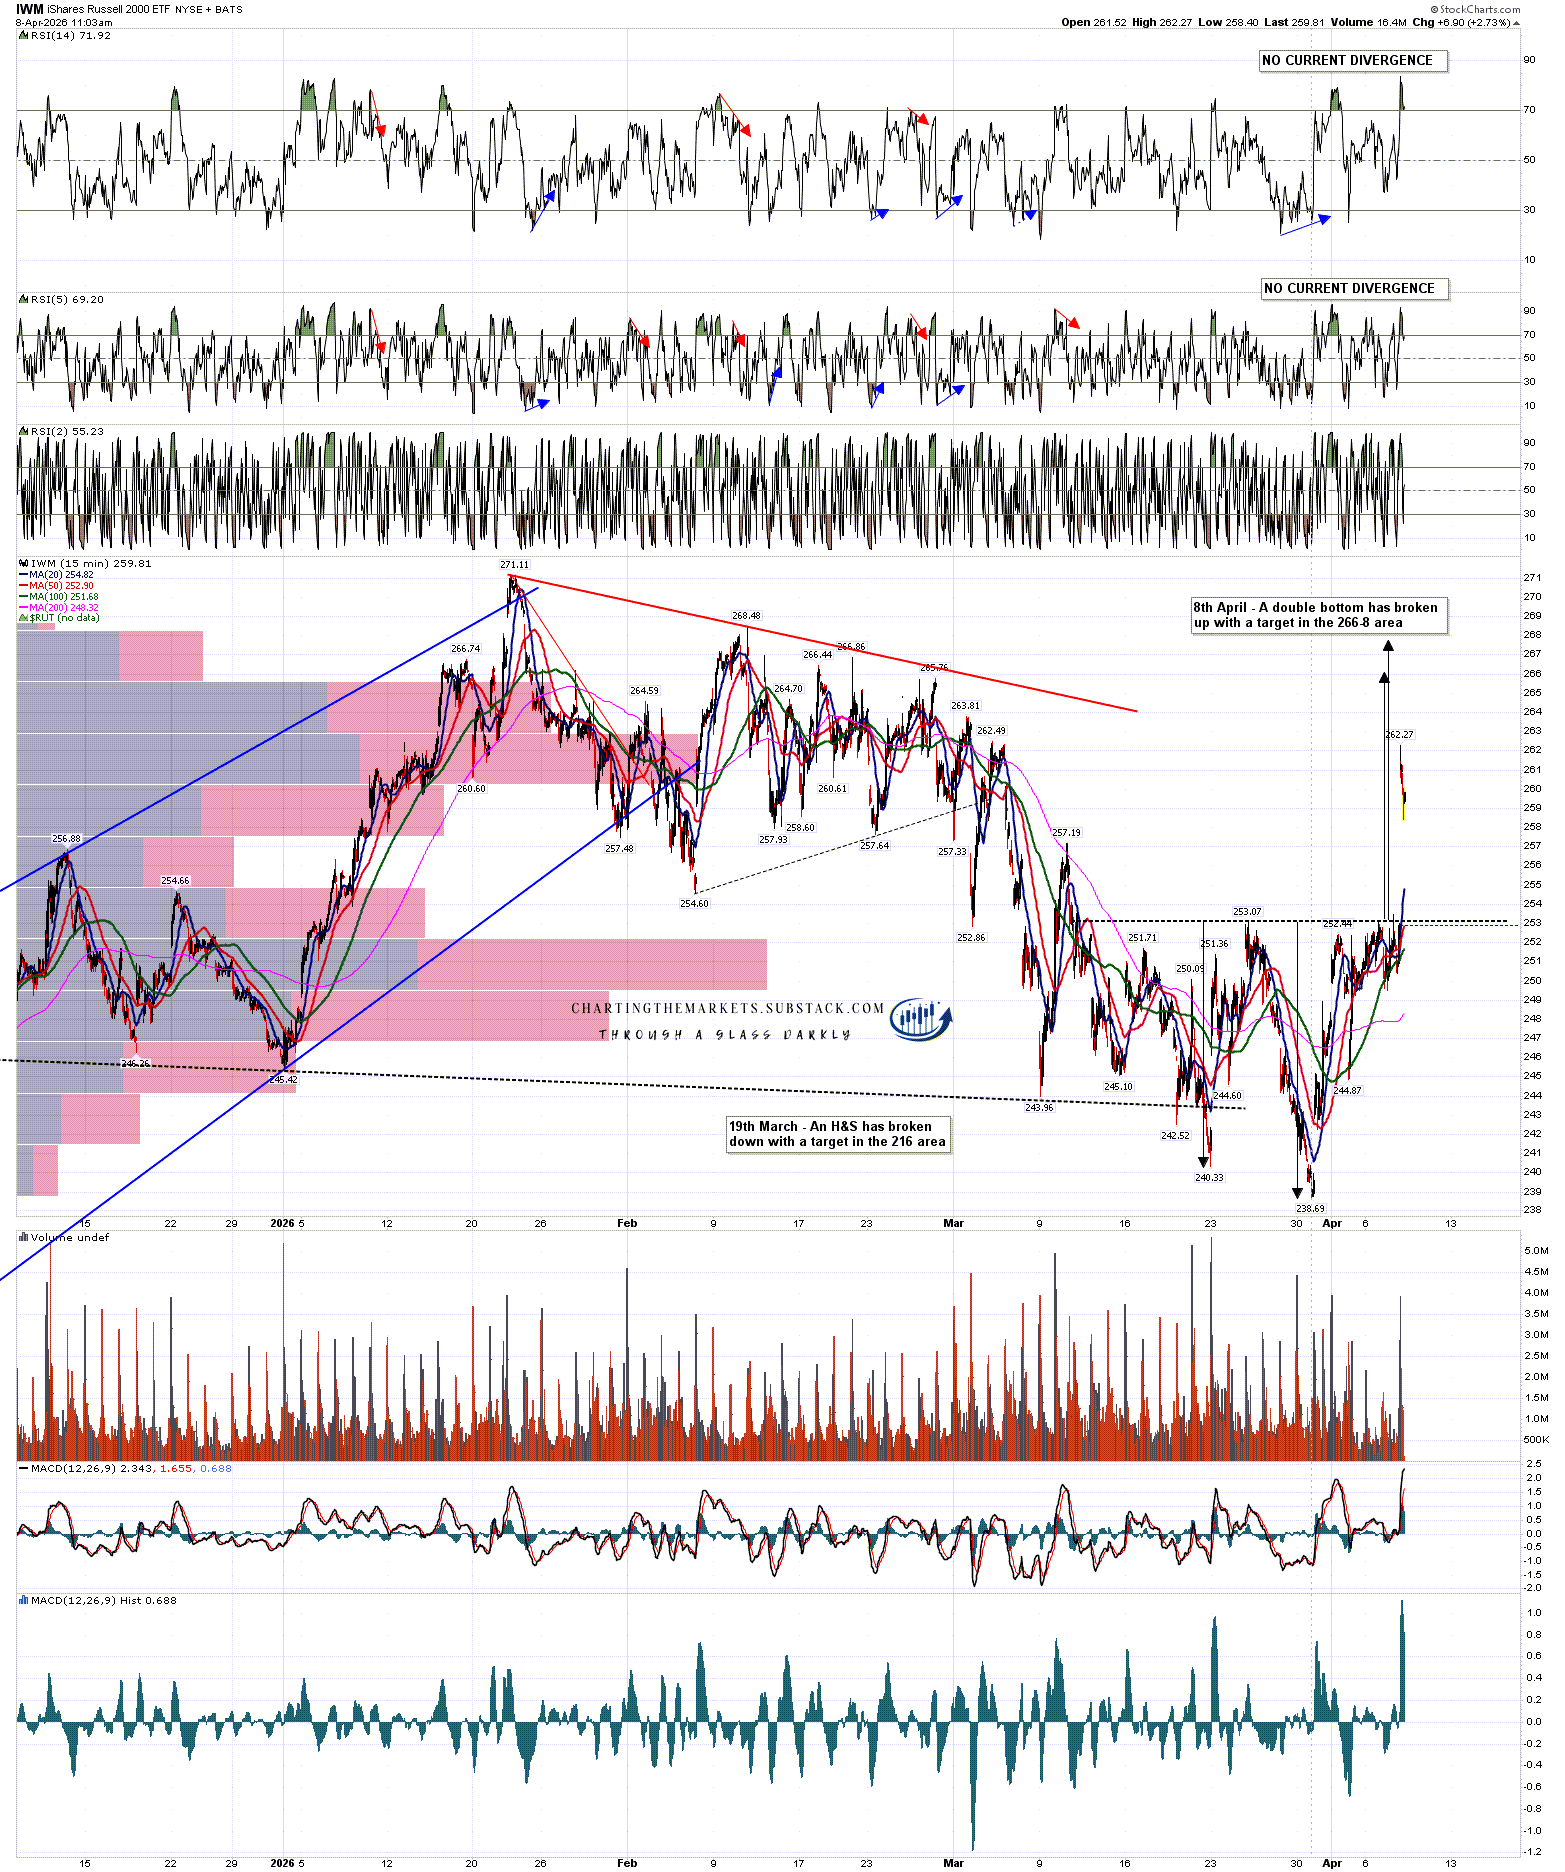
On IWM a double bottom has broken up with a target in the 266-8 area:
IWM 15min chart:
At minimum it seems likely that we should see at least a few days pause in this war, and even if the warring parties can’t reach agreement then the pause itself gives some time for things to develop in a positive way.
There’s an old story about a man who delayed a death sentence by promising to teach a king’s horse to sing within one year. As he persevered in this task day after day he was asked by a passer-by why he he had agreed to do this. He replied that a lot of things could happen in a year, the king could die, the horse could die, he himself could die, and who knew, perhaps the horse might even learn to sing.
In the meantime all these pattern targets on the four indices above look doable, and I am wondering about possible all time high retests. If negotiations then fail any high retests might then set up much larger topping patterns for the next leg down.
If you like my analysis and would like to see more, please take a free subscription at my chartingthemarkets substack, where I publish these posts first. I also do a premarket video every day on equity indices, bonds, currencies, energies, precious commodities and other commodities at 8.45am EST, but only for paying subscribers. Other places to find me are my page on the platform previously known as twitter, and my YouTube channel.
No comments:
Post a Comment