- WE'RE JUST RANDOM SPECKS OF DUST IN A TORNADO TO THE MARKETS .......
- CHARTISTS MUST PUT ALL BIAS ASIDE AND LET THE CHARTS DO THE TALKING OR WE'LL SEE ONLY WHAT WE WANT TO SEE
- This blog has a copy of all header posts that I publish anywhere, so that those interested in seeing what my thoughts are on the markets can find them easily.
- I will be answering questions and responding to comments, so feel free to respond to any posts and I will see your comment even if it is not on the most recent post.
- If you're interested in seeing any intraday charts I post, I do that on twitter, and my twitter handle is @shjackcharts.
- The charts in the posts are as large as I can practically make them. if you would like to look at one more closely, click on it, and the link will take you to a larger version at screencast. If you click on that again, you will get a full page version, and can use the resizing function on your browser to enlarge parts of interest further.

Wednesday 24 November 2010

Selling the Rips

We saw some major trendline breaks yesterday, and while I don't entirely trust this decline yet, the obvious next move for SPX seems to be towards the 1130s and there's a significant chance that this could go further. On the USD chart the declining channel was broken with considerable confidence yesterday, and the next triangle target is in the 85 to 87 area. There is a potential reversal area in the 80.5 to 81 area, and if USD starts to look really bullish, then the next reversal target would be at 83.5, for the neckline of a potential H&S pattern:


There are still a couple of key levels I'd like to see broken to complete the short term USD bull, equities bear picture. USD has broken declining resistance but EURUSD has not yet broken rising support. That's in the 1.323 area and may be tested today, as EURUSD has dipped below 1.33 while I've been writing. I can't capture a chart for that today but I'll be watching that level for a reversal.

The other level I'd like to see broken is the lower trendline of the rising channel on Nasdaq. This has been tested hard in recent days but has held so far. I'd like to see a move below 2100 in trading hours today ideally:


On SPX the rising channel is now broken. There's a neckline for a possible H&S in the 1173 area but I wouldn't necessarily expect a bounce there as the H&S would complete on reaching it:


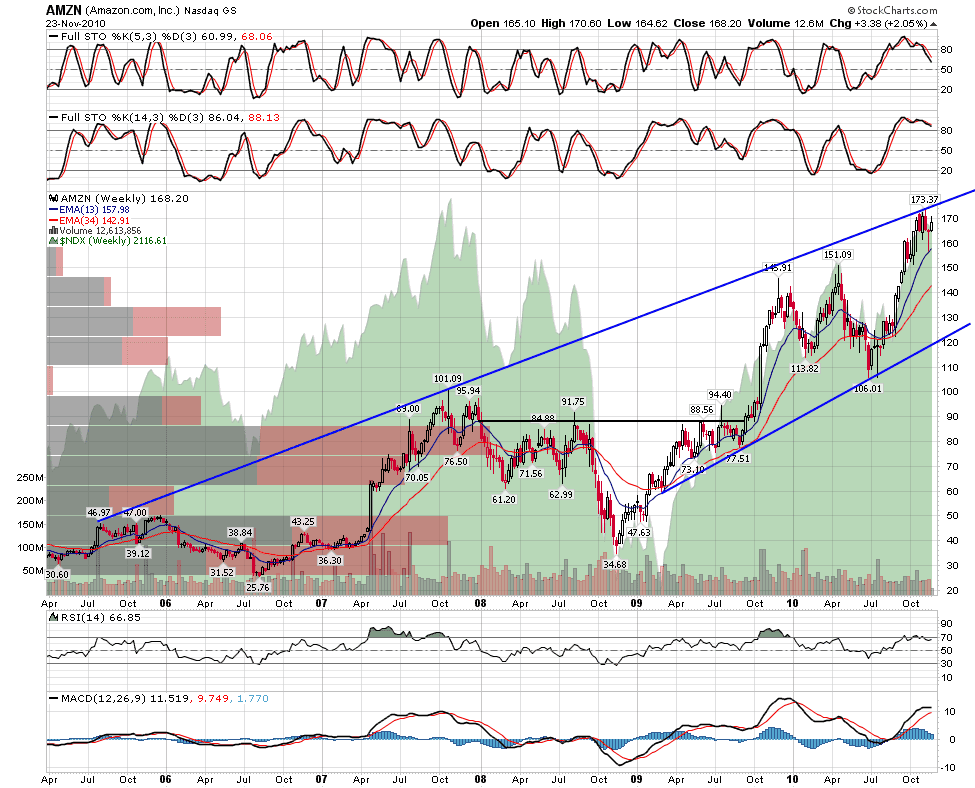
I posted some charts of individual stocks at the weekend to illustrate how significant the resistance level at the last high was on many charts. One of those was AMZN, and the chart gives a sense of how far this retracement could go if it picks up some speed. Thought-provoking:


Hard to say how much further downside we can can expect in the remainder of the week in this holiday trading. I'd be expecting serious falls to happen next week. If so then we may well find that both EURUSD and ES bounce if EURUSD hits support today.

No comments:

Post a Comment