
I was looking at the inflection point setting up here in my post yesterday and it is now fully set up and looking good. At this stage I am looking for either a break up towards a retest of the all time highs on both SPX and NDX, or a hard fail that delivers new retracements lows, though we could see a limited retracement here that preceded the break up.
On the SPX daily chart there is no current divergence but SPX is now testing and slightly over the daily upper band.
SPX daily chart:
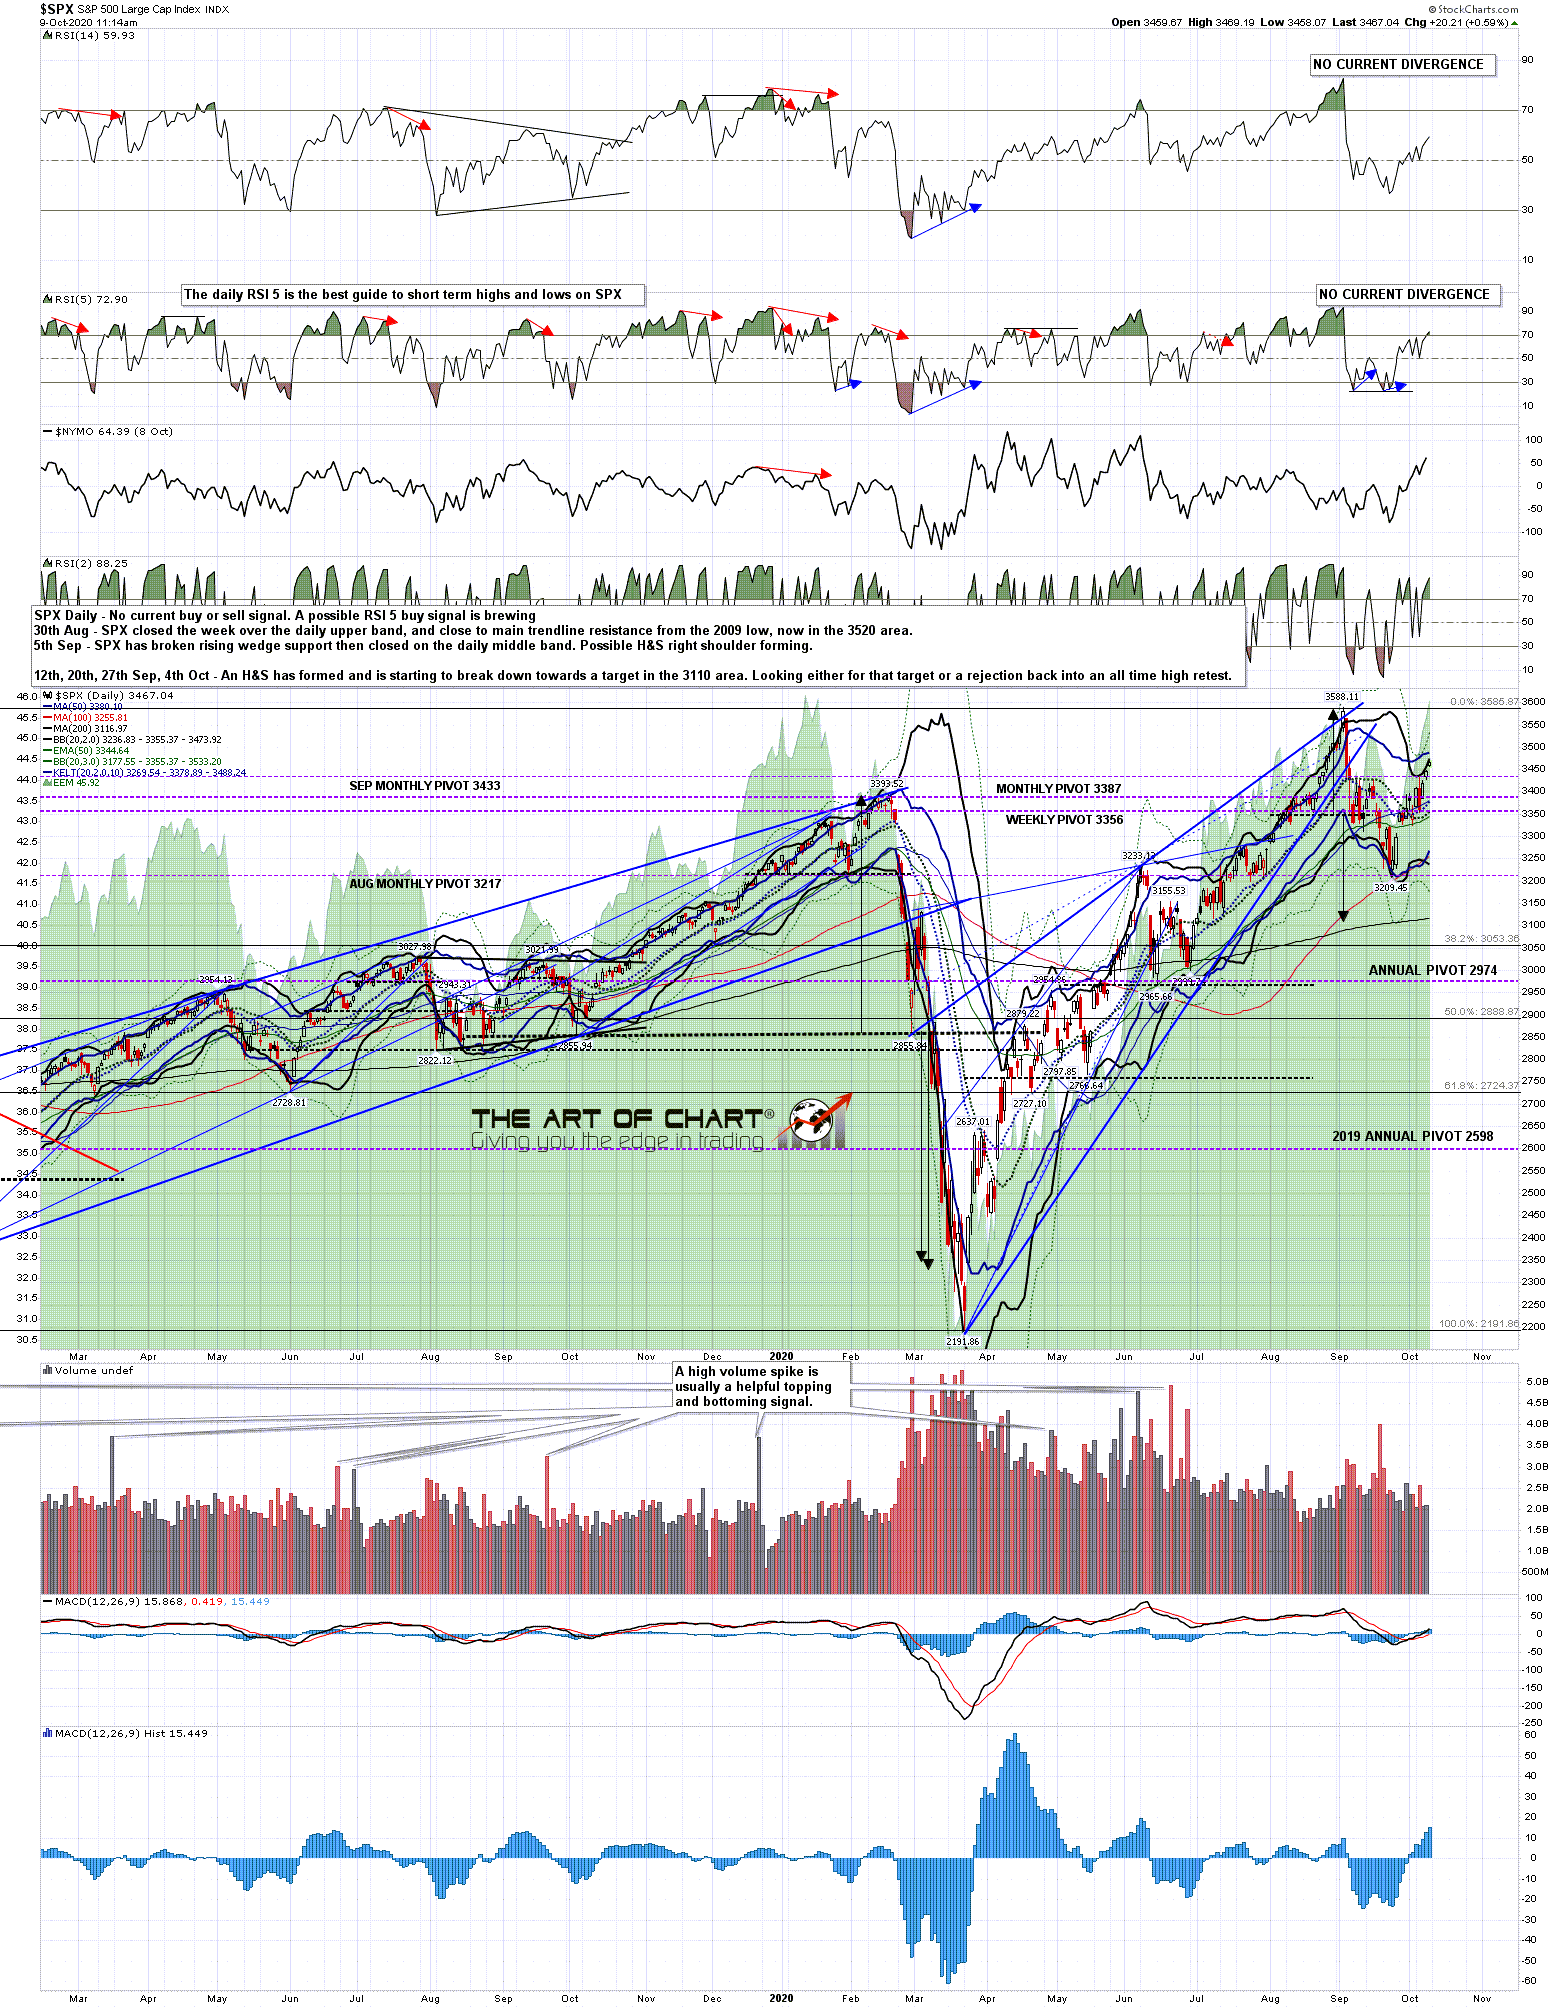
SPX has gapped up over rising wedge resistance at the open this morning. There is a possible alternate resistance trendline just above but if this is a wedge overthrow then it should reject downwards soon. If it doesn't reject soon, either today or Monday morning ideally, then the all time high retest on SPX and NDX is the obvious next target.
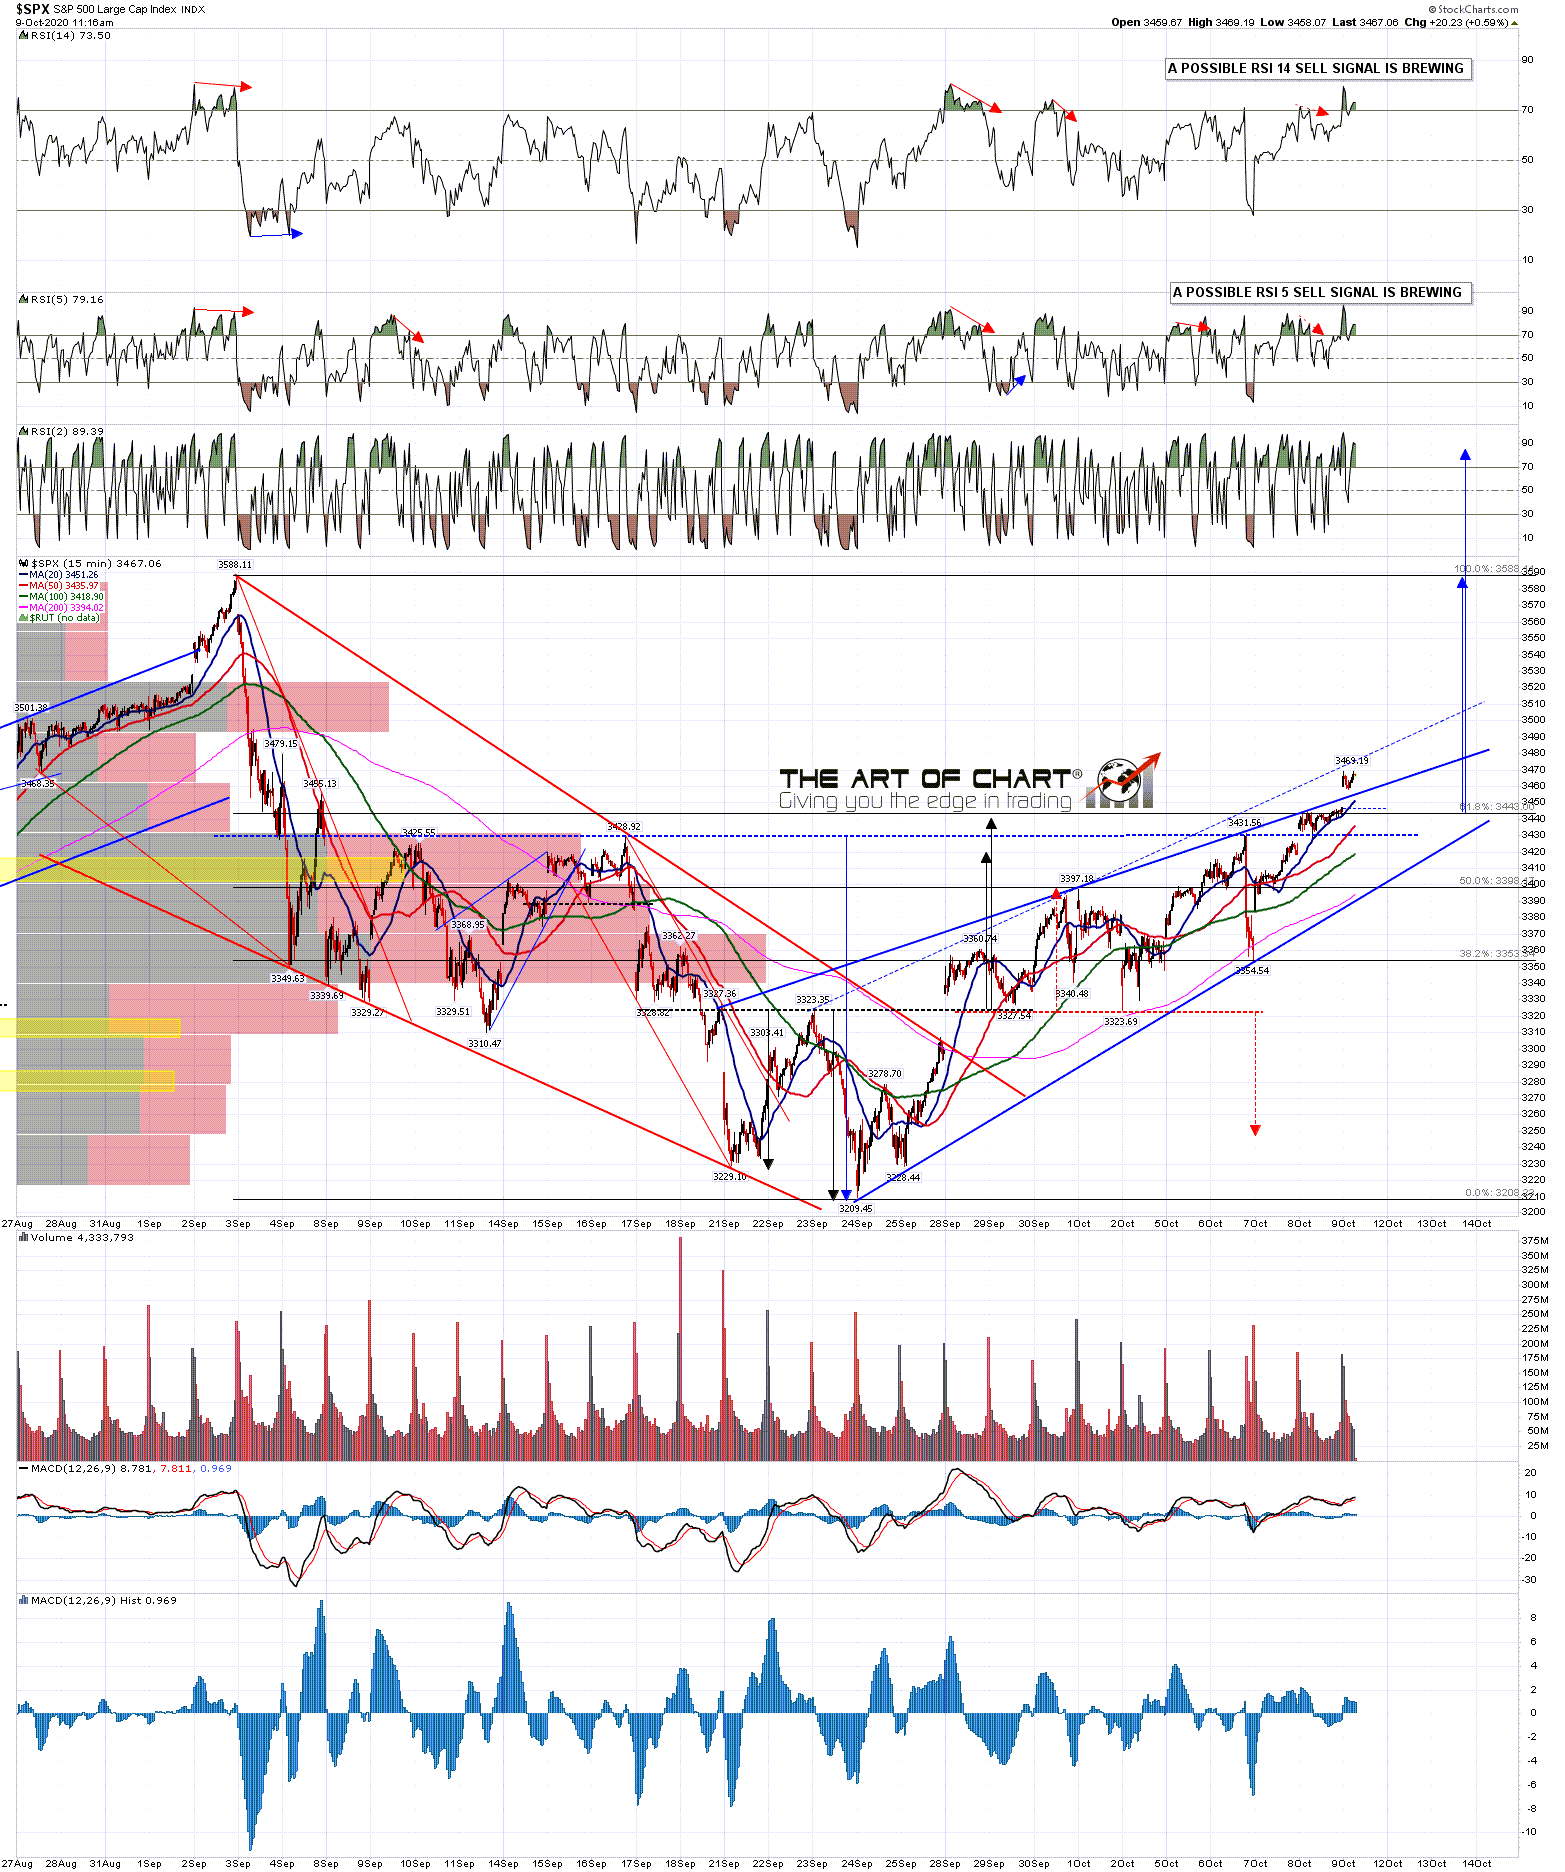
SPX 15min chart:
On the NDX daily chart, the daily upper band is also being tested and a possible daily RSI 5 sell signal is brewing.
NDX daily chart:

The IHS on NDX has finished forming and broken up and, if NDX is going to reject back down, then this is the ideal area to do that. We'll see how that goes.
NDX 15min chart:

This is a very decent inflection point setup and SPX and NDX could well fail back down here. On the overall setup here I'd be leaning towards 50/50 on whether it does though I'd add that in the event of a rejection into a lower low I'd be seeing that as a likely expanded bull flag retracement that would then probably deliver the high retests that would otherwise have been delivered directly from here. This is the sort of setup where the rejection might well get started on the back of bad news over the weekend, so I'll be keeping an eye on that too. Everyone have a great weekend. :-)
No comments:
Post a Comment