
There's been quite a bit of speculation about a possible bear market low having just been made at the last low, and that is technically possible, though I think rather unlikely. More likely is the possibility that SPX is returning to retest the all time highs to make a second high on a huge double top pattern looking for a retest of the 2020 lows, but even that is doubtful in my view. I think that if the high had been going to get a retest then the rally that ended at 4326.28 would likely have continue higher into that then.
What is there to support a low for 2022 low here? Well if this was just a correction or technical bull market then the low SPX just made at the 200 week moving average would definitely be the right place to make that low, with the lows in 2011, 2016 and 2018 all made there, so this is at least definitely the right place to see that.
There is also a theory I've heard a lot over the years that as bonds become less attractive then money flows into equities and bonds are really looking unattractive here. I've seen little evidence in the past though that this theory has any credibility, and with ten year bond yields having more than doubled so far this year, while at the same time SPX is down almost 25% from high to low over the same period, that is a very slender thread of hope to hang a major reversal on.
Everyone remembers the great bull runs that followed the big lows in the last fifteen years, and many would love to see another of those here, but the winds really have changed, and while I'm keeping an open mind, I think this is just a rally before the 200 week moving average breaks.
SPX weekly chart:

On the SPX daily chart SPX is reaching the first real resistance at a backtest of the daily middle band, which closed yesterday at 3816. There is a very possible fail setting up here, but if that breaks and converts to support then that opens up the next level at declining resistance from the rally high at 4325, now in the 3915 area, and backstopped by the next big levels at the weekly middle band, now at 3953, and the psychologically important 4000 level.
If SPX can break and convert 4000 then I will start to take the 3584 low more seriously, though it will only look really impressive on a break over SPX falling channel resistance in the 4220 area. If that breaks then a possible all time high retest will be on the table.
In terms of the open buy signals the daily RSI 5 buy signal has reached the possible near miss target, so that minimum level has also been reached.
SPX daily chart:

There is a potential hard fail setup right here, and that is because across the US indices credible IHS right shoulders formed yesterday and all of those IHS patterns broke up at the close. The one below shown on the SPX 15min chart has broken up with a target in the 4000 area.
Why is this a possible hard fail setup? When a pattern like this breaks up, then then one of two things is very likely to happen. The first is that the pattern makes target, and the second is that the pattern fails, rejecting back into a retest of the prior low. If SPX breaks back below yesterday's IHS right shoulder low at 3722.66 then the IHS will have failed and that will fix a target back at the prior low at 3584.13.
SPX 15min chart:

Dow has been leading this market from a pattern perspective and there is a very decent looking IHS there too that has broken up with a target in the 31950 area.
INDU 15min chart:

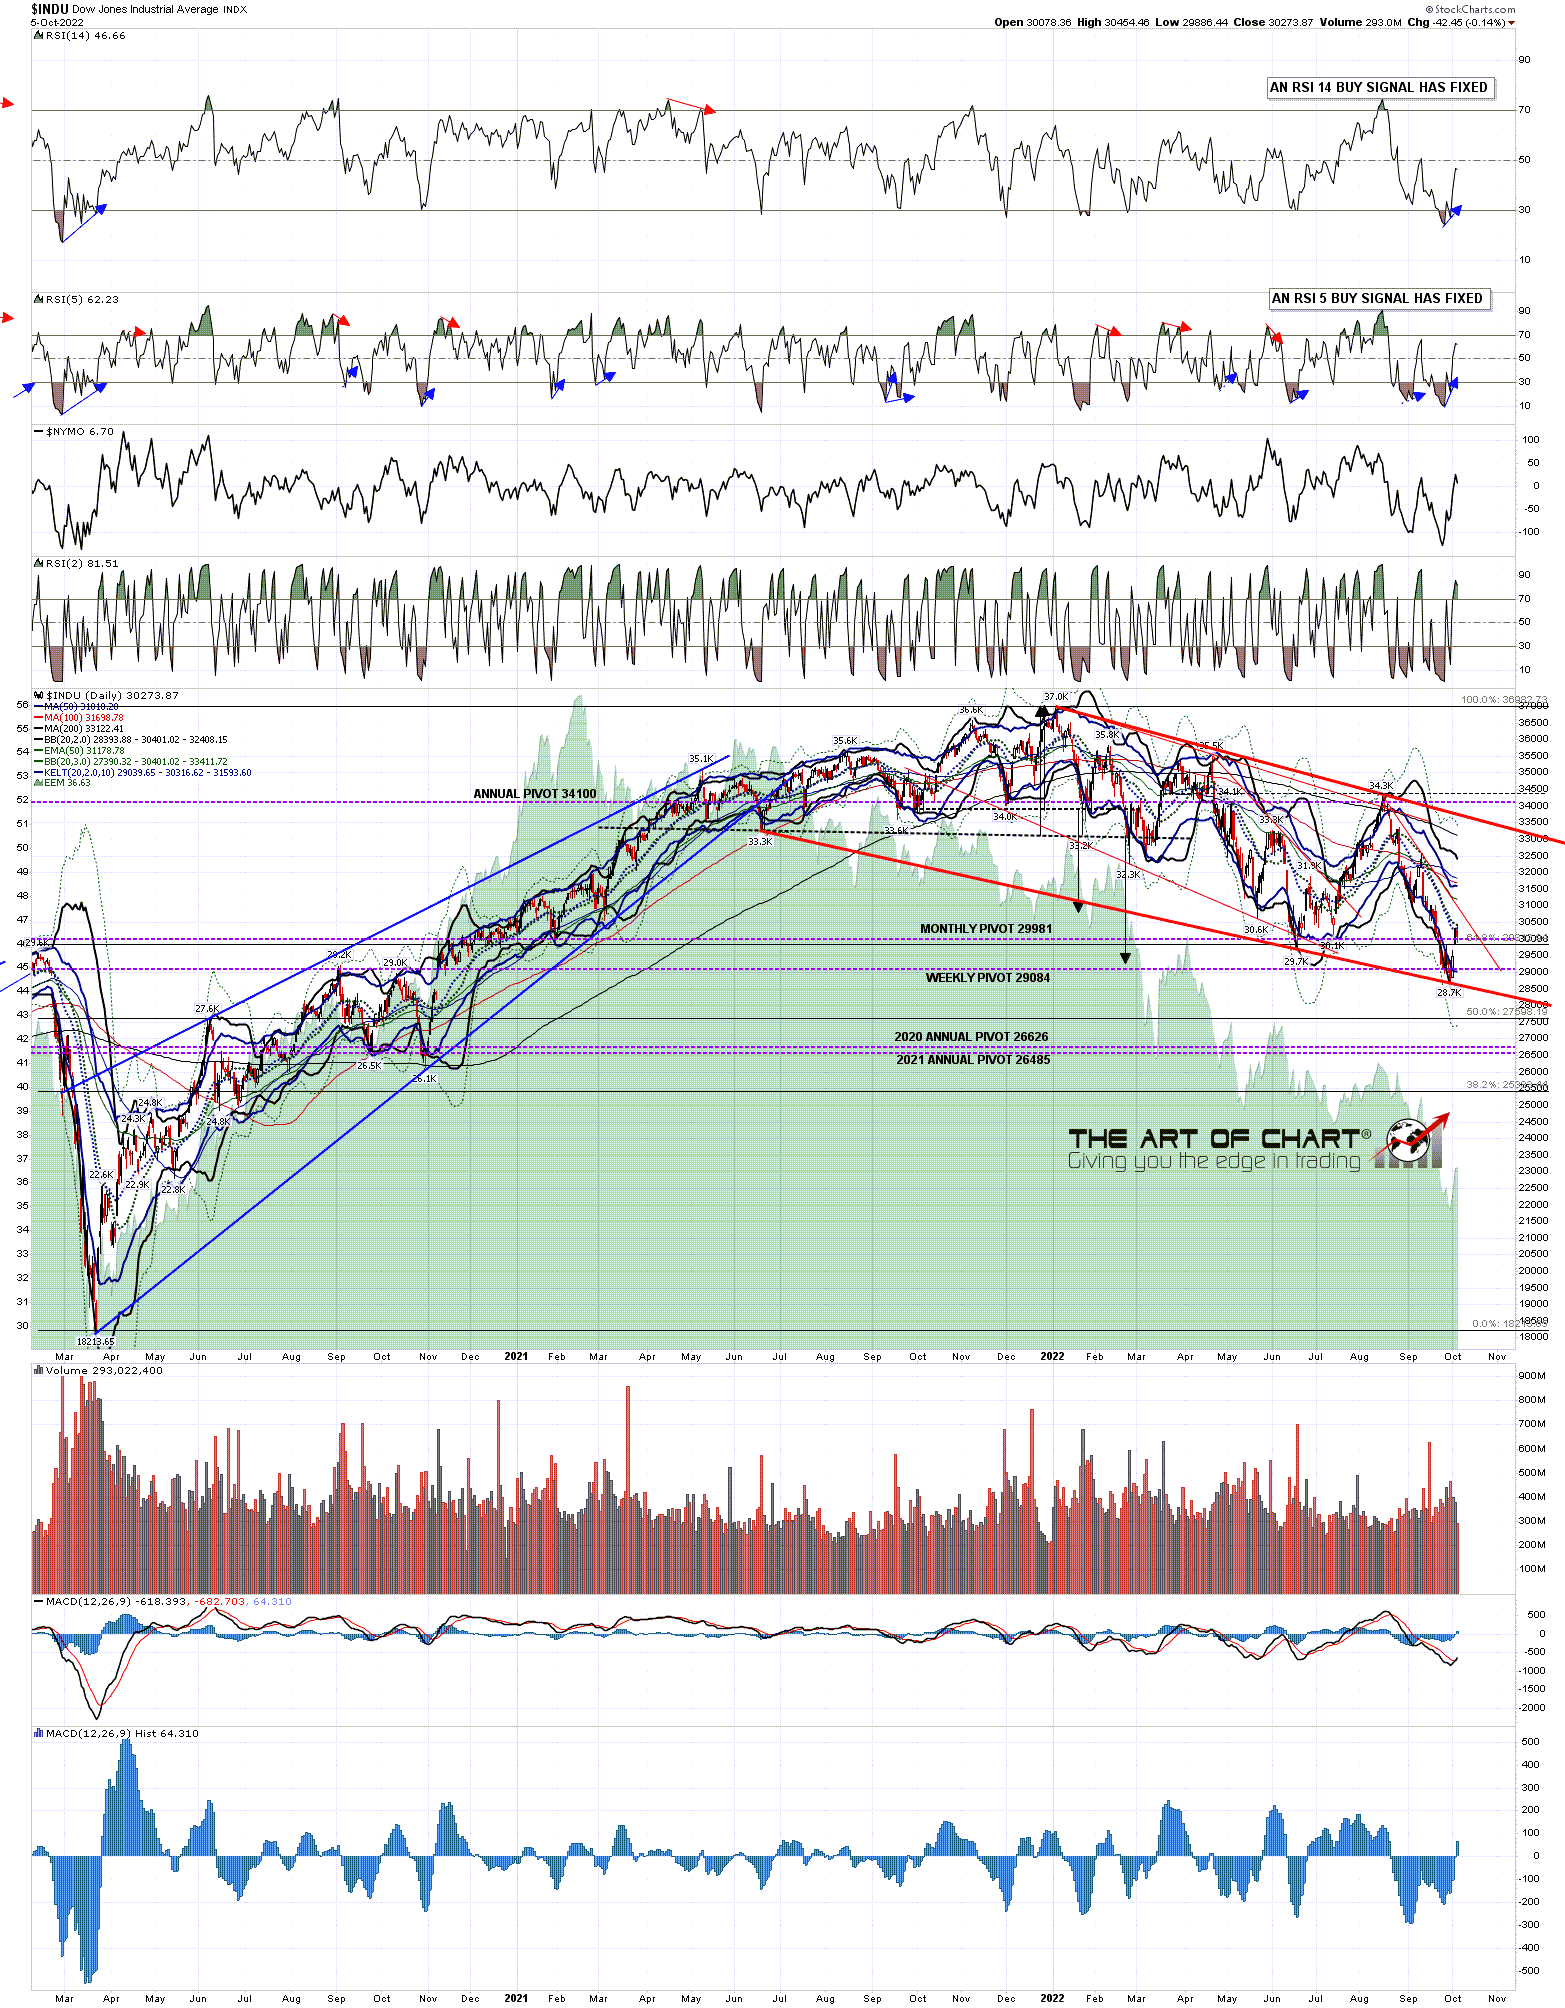
There are a couple of things worth noting from the Dow daily chart. The first is that the daily RSI 14 buy signal that just fixed is the first one since the 2020 low, which is at the least encouraging for surviving bulls.
The second is that there is a still a very decent looking potential bull flag from the all time high, though the support trendline isn't quite as perfect as I like. If we were to see a break over flag resistance now in the 33900 area then I would start taking this flag seriously.
INDU daily chart:
I liked the rally setup here and it delivered. That has now reached the minimum level I would expect and may fail here. Will it go higher? Well the market needs to make that decision, but a strong break up would look for a test of the 4000 area.
Our monthly free public Chart Chat at theartofchart.net is at 4pm EDT on Sunday and it should be interesting. If you'd like to see that you can register for that here or on our October Free Webinars page.
My next post should be on tomorrow or Monday before the open. If I don't post tomorrow then everyone have a great weekend. :-)
No comments:
Post a Comment