
The projection of the larger bull flag that I posted on Thursday morning delivered like a champ, with a perfect touch of the channel support followed by a break up that almost reached the target at a retest of the flag high on Friday afternoon. The full target should be made at the open today. So what now?
SPX 5min chart:

Well the Three Day Rule says that we see a retest of the 3491.58 low before a retest of the 3806.91 high, so unless this is going to fail for the first time in almost sixteen years, further upside is very limited and SPX should fail in this area, starting the move back to 3491.58.
Would I be astounded if the Three Day Rule fails to deliver here? Not really. As I have said, there is no such thing as a perfect stat, so a fail is inevitable at some point, and really I'm amazed that we haven't seen one before. That said, it has delivered the last 150 or so times over almost sixteen years, and there is no particular reason to think that it would fail here and now.
Has SPX come this close to a retest of the Three Day Rule before playing out in the past? Yes, only three or four times I think, but definitely. The odds are that it will deliver again today.
SPX daily 5dma chart:

The daily middle band, now at 3671 is now well established as short term support, and the daily upper band closed Friday at 3799. Unless the Three Day Rule is going to fail here that's about as high as I expect SPX to go today.
SPX daily BBs chart:

I mentioned that if we do see a fail on the Three Day Rule today then that would open a possible target higher in the 3900 area, and that would be the weekly middle band, which closed Friday at 3899.
SPX weekly chart:
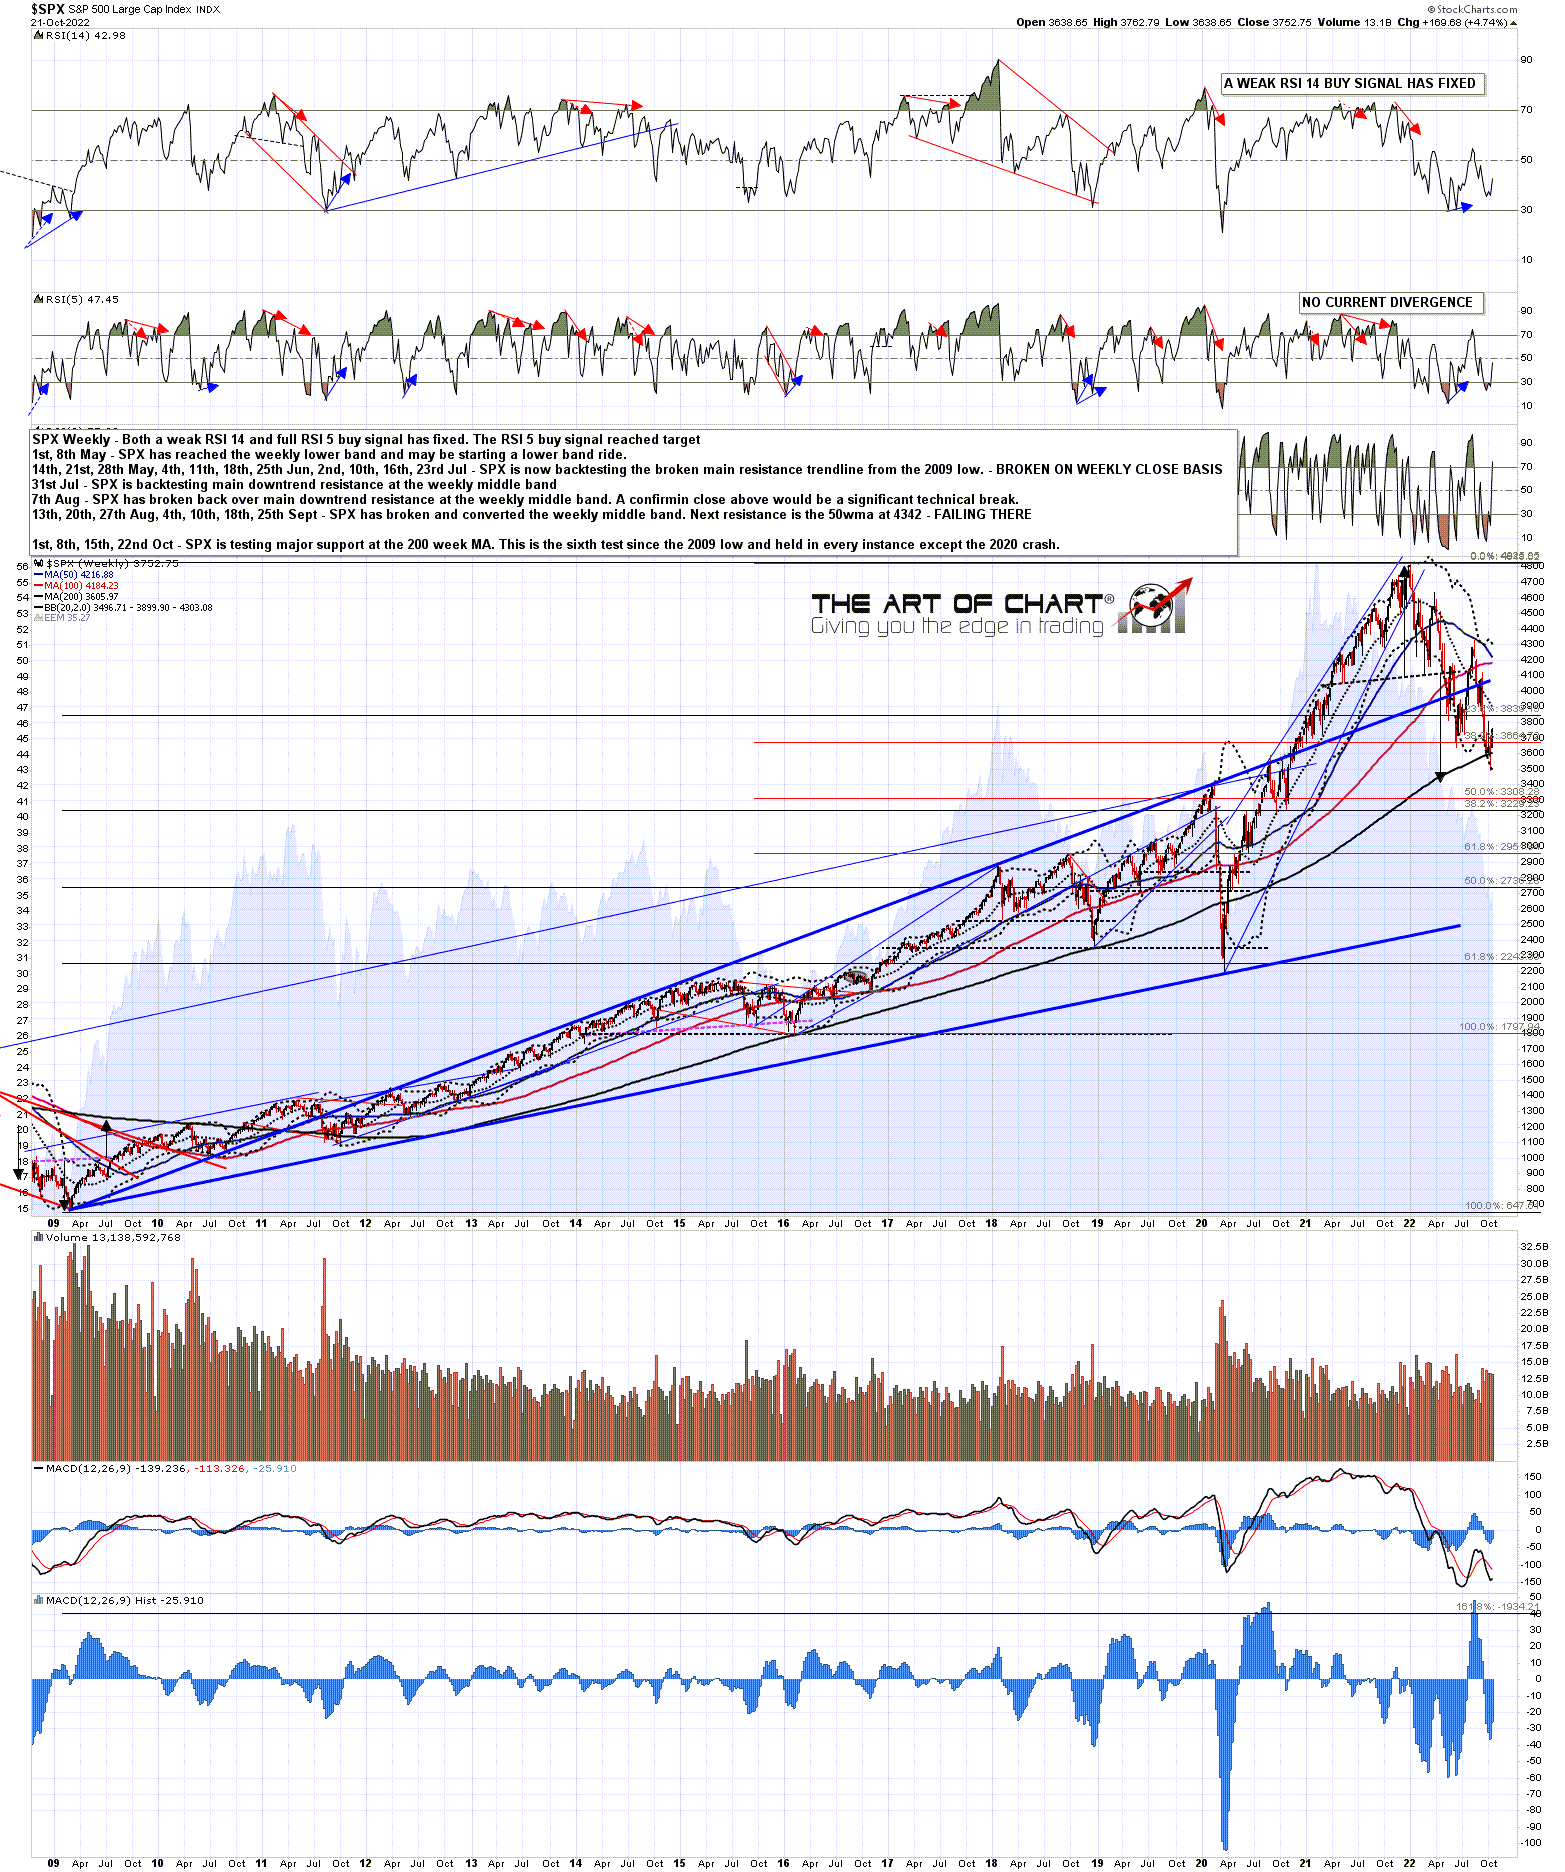
I do now also have an established rising channel on SPX from 3491, and if we see the fail I expect here then that is a likely bear flag. Even if we do see a break up here then this may be a bear flag channel, and I'll be watching channel resistance, now in the 3865 area and rising at about 25 handles per trading day.
SPX 15min chart:

We are doing two public webinars at theartofchart.net this week after the closes on Wednesday and Thursday. On Wednesday we are doing our monthly Trading Commodities webinar, at which we will be designing three options trades. If you'd like to attend you can sign up for that here. On Thursday we will be doing our usual monthly public webinar of FAANG stocks and key sector ETFs. If you'd like to attend you can sign up for that here.
My next post should be on Thursday or Friday before the open.
No comments:
Post a Comment