I'm in the throes of moving house at the moment and am struggling to get posts out so there may be just one a week or so until I've finished in three or four weeks. It looks like I may actually need to take a whole week off at the end of the month which would be the kind of holiday where I do no charting at all for a full week. That would be the first time in a long long time but might be a good thing, even if I'm not really a holiday person.
Just to mention before I get started, we are holding our Black Friday sale at theartofchart.net on annual memberships. This means that instead of the usual two month discount, for the duration of the sale there is a four month discount. If you're interested the sale page is here and it is important to remember to use the blackfriday coupon code when checking out, though if you forget we can fix that afterwards. On to the markets.
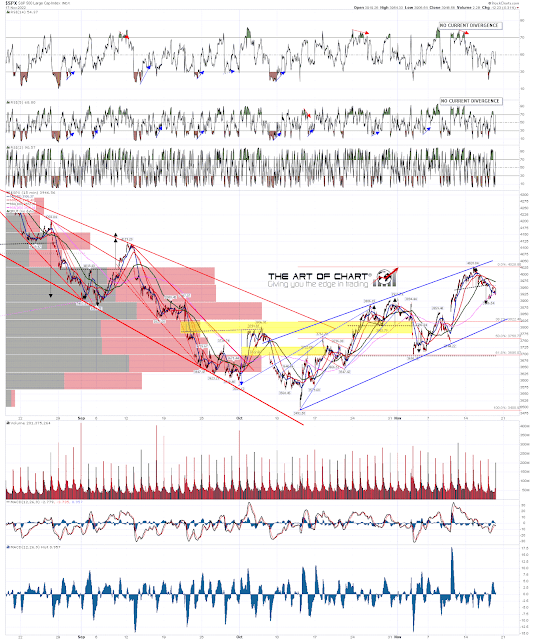
I'm still keeping an open mind on direction here, but there are now two good quality candidate bear flag rising wedges formed from the lows on SPX and Dow. I'm watching these with great interest to see what happens now.
In the short term I have marked in a small H&S on the SPX 15min chart that broke down yesterday and could be failing here. On a break back over the right shoulder high at 4002.19 we would likely see a retest of the short term high at 4028.84 and perhaps make the second high of a larger double top there.
A new high with confidence would likely take SPX to the next major resistance levels, which are the SPX 200dma now at 4069.91, and main falling channel (and possible bull flag) resistance from the high, now in the 4105 area.
SPX 15min chart:
There is still a fixed RSI 14 sell signal on the SPX hourly chart, and generally I would expect these to make target, but if we see a short term high retest the signal would likely survive that. If the H&S pattern does make target then that is in the 3885 area, and possible bear flag wedge support now in the 3810 area.
SPX 60min chart:
SPX last tested the daily upper band on Wednesday, so the daily upper band ride has finished for now and if the H&S does make target, or a subsequent double top breaks down, the next big support level would be at the daily middle band now at 3855/6.
SPX daily BBs chart:
The other high quality possible bear flag wedge is on Dow, and there is another H&S that broke down there. I captured the chart below before the open but this H&S failed at the open, and that may well be an indicator that the H&S on SPX will fail too. Watching that with interest.
INDU 15min chart:
There is more on the Dow daily chart though. The current short term high has established a possible falling channel from the high, but a new high with any confidence would eliminate that. That wouldn't be a huge fail, but in the absence of that there is certainly a decent argument that Dow has already broken up from a bull flag wedge looking for a retest of the all time highs. The small retracement that we saw yesterday was a backtest of that broken flag resistance. We'll see.
On the bear side there are possible RSI 14 and RSI 5 sell signals brewing on the Dow daily chart. If we do see a break to the downside then those will fix and bolster the bear case here.
INDU daily chart:
We'll see how it goes on the flag setups here. This includes the possible bear flags from the lows and also of course the possible bull flags here from the all time highs. It may be that we will need a test of the bigger resistance levels above and, if so, the main decision on direction will be made there.
We are doing our monthly free big 5 and key sectors webinar at theartofchart.net on Thursday 24th November at 5pm EST and it should be interesting. If you'd like to attend you can register for that here, or on our November Free Webinars page.
One last thing to mention is that as of last weekend our free Weekly Call service at theartofchart.net is up 60% YTD and up 763% since inception in Q4 2016. That can be followed with auto-trades at our partner Striker Securities if you are a subscriber on the Daily Video Service or Triple Play services at theartofchart.net. Either of those also includes access to our private twitter feed and my premarket videos every day, and also access to the auto-trade option on our Follow The Leader service, up 168% so far this year last time I checked. Just sayin'.
Descriptions of all our services can be found here, and as I mentioned, we are running a Black Friday sale on annual memberships at the moment.
My next post should be on Monday or Tuesday before the open. Everyone have a great weekend. :-)


No comments:
Post a Comment