
My apologies for this being the first post this week. I'm moving very soon and am very busy with that.
As of the close yesterday the bear setup here to get SPX back to double falling channel support in the 3340 area was looking very nice indeed. The smaller falling channel wasn't broken by the last bounce, and at the close yesterday another Three Day Rule signal fixed looking for a retest of the last low at 3698.15 before any retest of the last high at 3911.75. Now the last Three Day Rule failed, but as that was the only fail of likely over 150 of these signals fixed since the start of 2007, I was thinking that it would likely be a long while before the next fail.
That changed this morning with the better than expected CPI news, with first an opening gap up over channel resistance for the falling channel from the rally high at 4325.28. After that SPX then broke back over 3911.79, delivering the second Three Day Rule fail since the start of 2007, just a few days after the first fail.
This has done some serious damage to the short term bear bear case here and at minimum significantly reduces the odds that SPX makes it back to the 3340 area on the next leg down.
SPX daily 5dma chart:

On the daily chart there have been two clear closes below the daily middle band in recent days, and both delivered a rejection back over the middle band the next day. That is two failed breaks down and now SPX is doing the obvious next thing, which is to retest the previous high at 3911.79, and the key resistance there at the weekly middle band, now at 3904 SPX.
You can see the broken falling channel from 4325 on the daily chart below and I would also note that there is still an open daily RSI 14 buy signal. If we do see a decent break higher, I would also note that the next big resistance levels would be the 200dma, currently at 4082, and main falling channel resistance from the all time high, currently in the 4100 area.
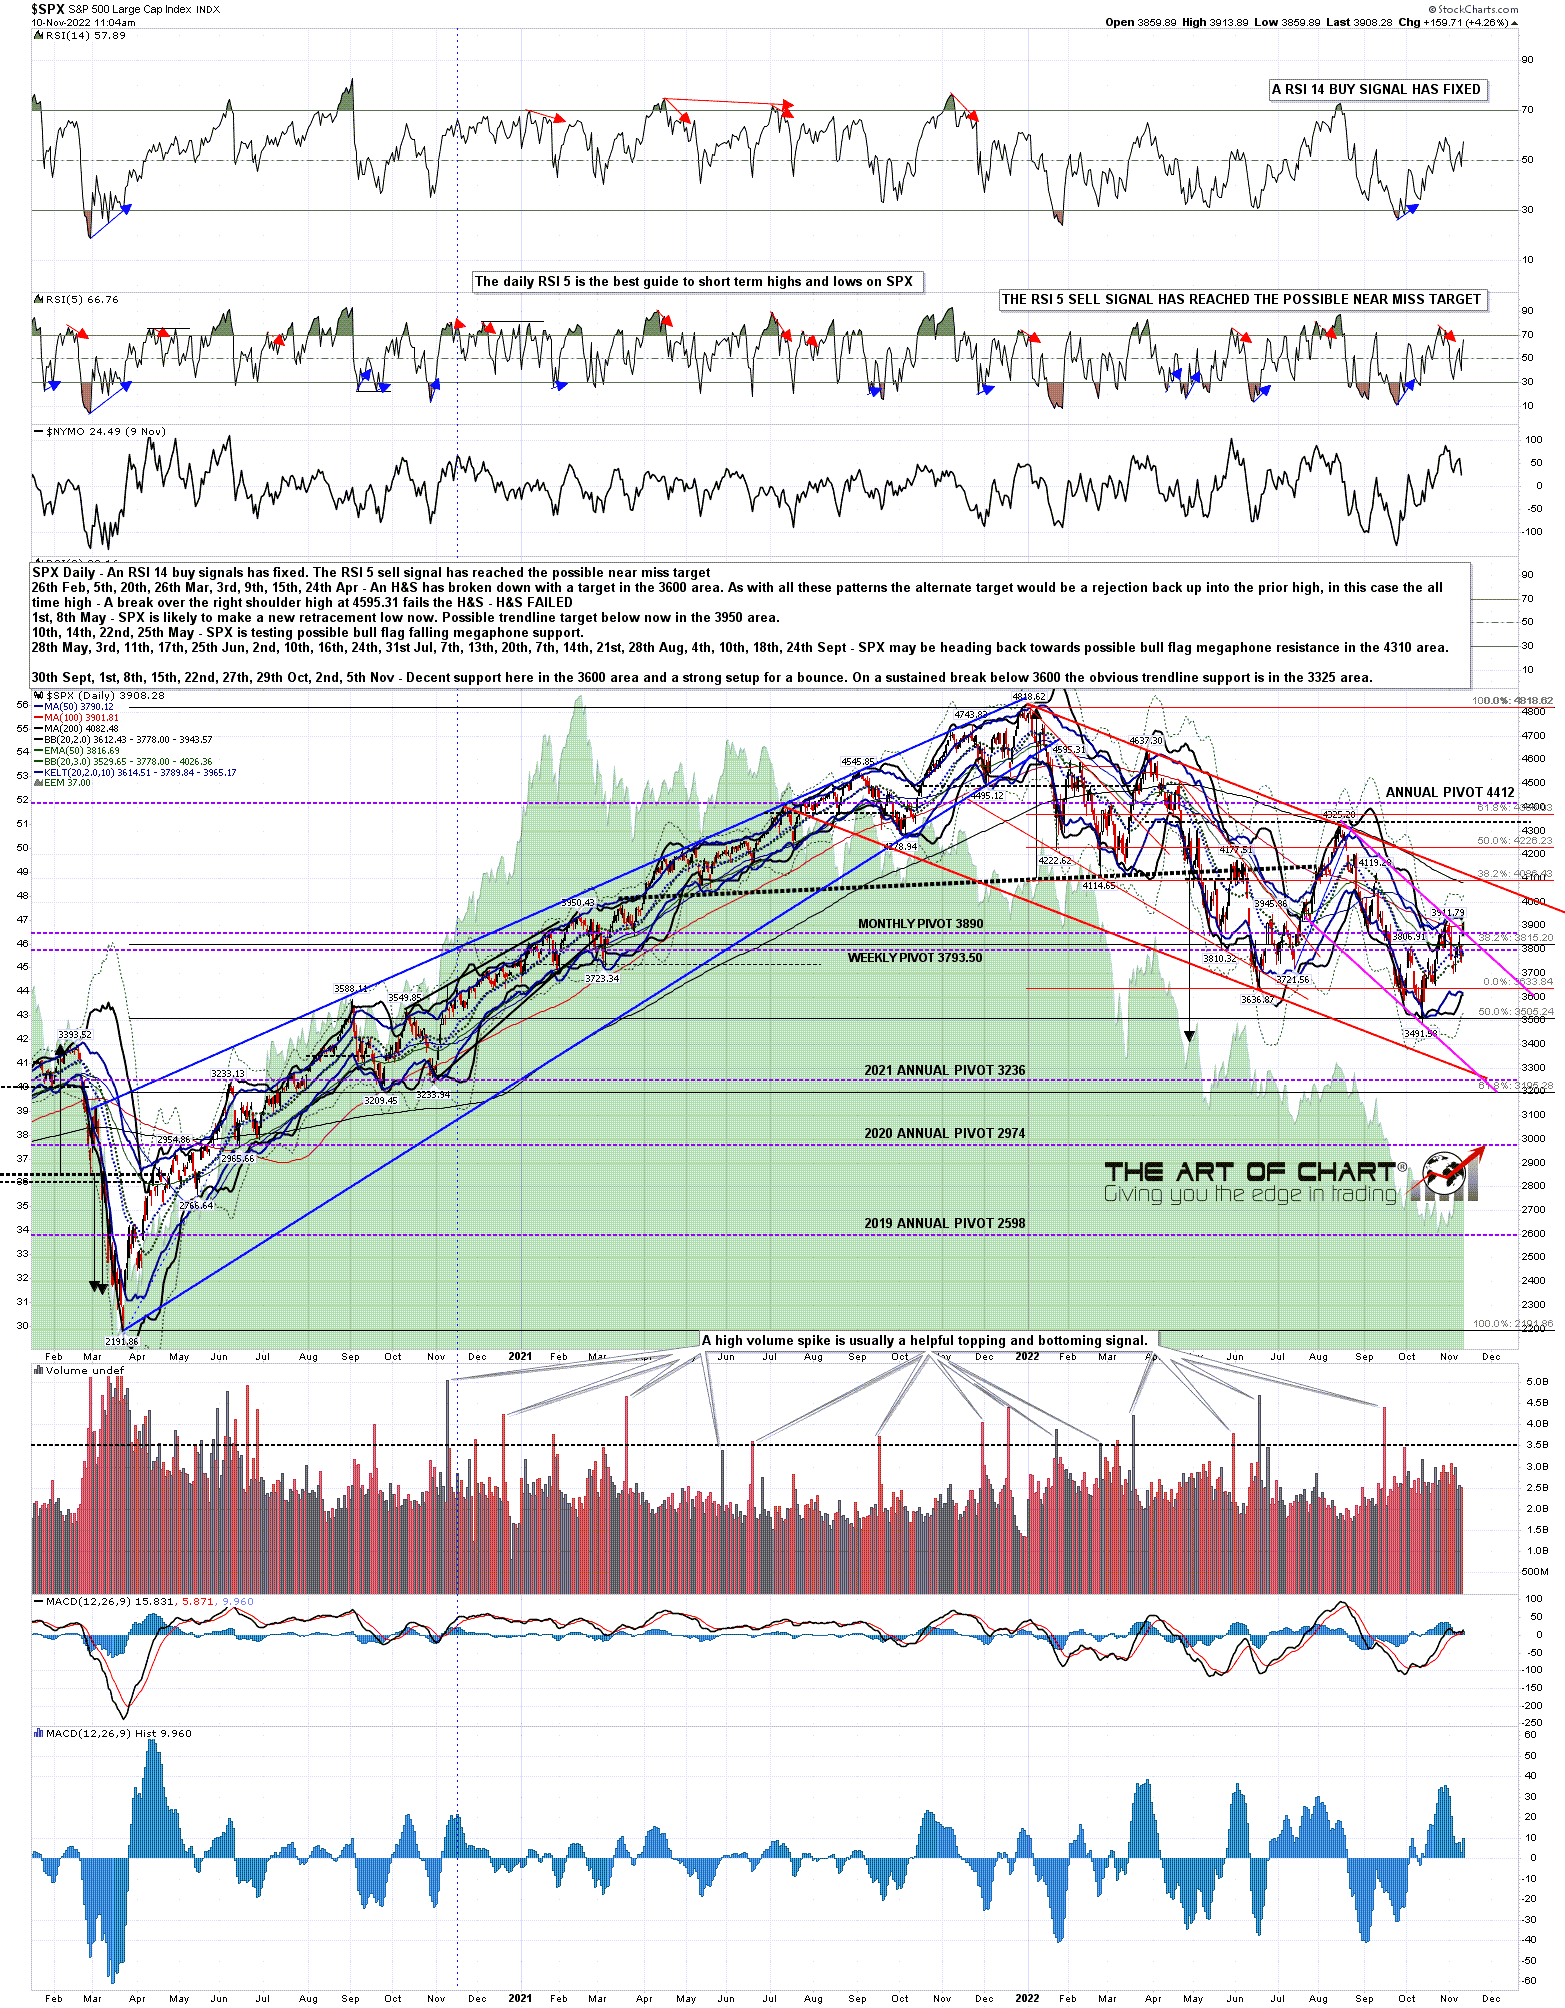
SPX daily chart:
On the weekly chart if we see another fail at the weekly middle band the next big test would be a test of the 200 week MA, currently at 3625, and if that breaks and converts to resistance then the main falling channel support in the 3340 area is still the next obvious downside target, but there are other more bullish options developing now.
SPX weekly chart:

A strong break up directly over the weekly middle band here wouldn't deliver much of a bottoming setup, though of course that may happen anyway. There is now another option that may be developing here however that could deliver a really high quality bottoming setup, as the rally to 3911 was close to a 50% retracement of the decline from 4325, and the retracement from 3911 was then close to a 50% retracement of the move up from the 2022 low at 3491.58.
There is currently a very high quality double top setup here that on a break down under 3698.15 would look for a retest of the 2022 low at 3491.58. If support was found there that would set up a possible high quality double bottom that on a sustained break over today's high would look for a retest of the August rally high at 4325. That would then test resistance on a much larger (and possible oversized) potential double bottom that on a sustained break back over 4325 would look for a retest of the all time high. I'm not looking for that all time high retest anytime soon, but it is an interesting looking setup.
Summing up, we may well see another fail here at the weekly middle band, and then a retest of the 2022 low, but if that held as support again then we would have the setup for a potentially really impressive rally on SPX.
SPX 15min chart:

On the bigger picture the Fed obviously suggested last week that the current cycle of interest rate rises may be enough to dampen inflationary pressures, and that the rate rises would likely end soon, and that may mark the high in this interest rate cycle. Personally I think that is just wishful thinking, but the CPI numbers this morning were supportive and this might be enough to deliver that move back to 4325 over the historically bullish leaning rest of the year.
There is something else as well. TNX went through the possible IHS neckline in the 30 area, and the next one in the 40 area, but it has stopped so far at the possible IHS neckline at 43. We might see a decent rally on bonds here to set up the next move down, ideally with TNX retesting the 43 high while SPX retests the 3491 low to set up the larger rallies on both equities and bonds that we may see next. We'll see.
TNX weekly chart:

I'm still liking a fail here at the test of the weekly middle band but, if seen, the next move down may well fail to deliver a conviction break below the 200 week MA, currently at 3625, and may reverse back up strongly at the retest of the 2022 low at 3491. If so, we will have a setup for a very powerful rally into the end of the year.
If we see a break and conversion of the weekly middle band directly here then the next big resistance is at the 200dma and main channel resistance, both currently in the 4080-4100 area and converging. A subsequent break over those would open a possible move into a retest of the all time highs.
If SPX should manage to break the 200 week MA with conviction then the move down to main channel support in the 3340 area is still on the table. If that is tested and holds then I'd then be looking for a return to main channel resistance, currently in the 4100 area and likely to be in the 4000 area by the end of the year. If we don't see a big rally sooner, then I'd be looking for that big rally there.
Bigger picture I don't think that there is much chance that this inflation dragon has been slain by the Fed's actions so far this year, and I think that will become obvious in the coming months. After that we will likely see further declines on bonds and equities. In the meantime though there is some breathing room here for possible big rallies on equities and bonds, and we may well see those.
We are doing our monthly free public Chart Chat at theartofchart.net on Sunday at 4pm EST and it should be interesting. If you'd like to attend you can register for that here, or on our November Free Webinars page.
My next post should be on Monday or Tuesday before the open. Everyone have a great weekend. :-)
No comments:
Post a Comment