
This is my first post on equities this month. My apologies for that. I’ve been getting my boys back to university. They have now both gone and summer has officially ended in my house.
In my last post I was looking at the bearish track record for Septembers in presidential election years, and we saw a sharp decline shortly after at the start of September.
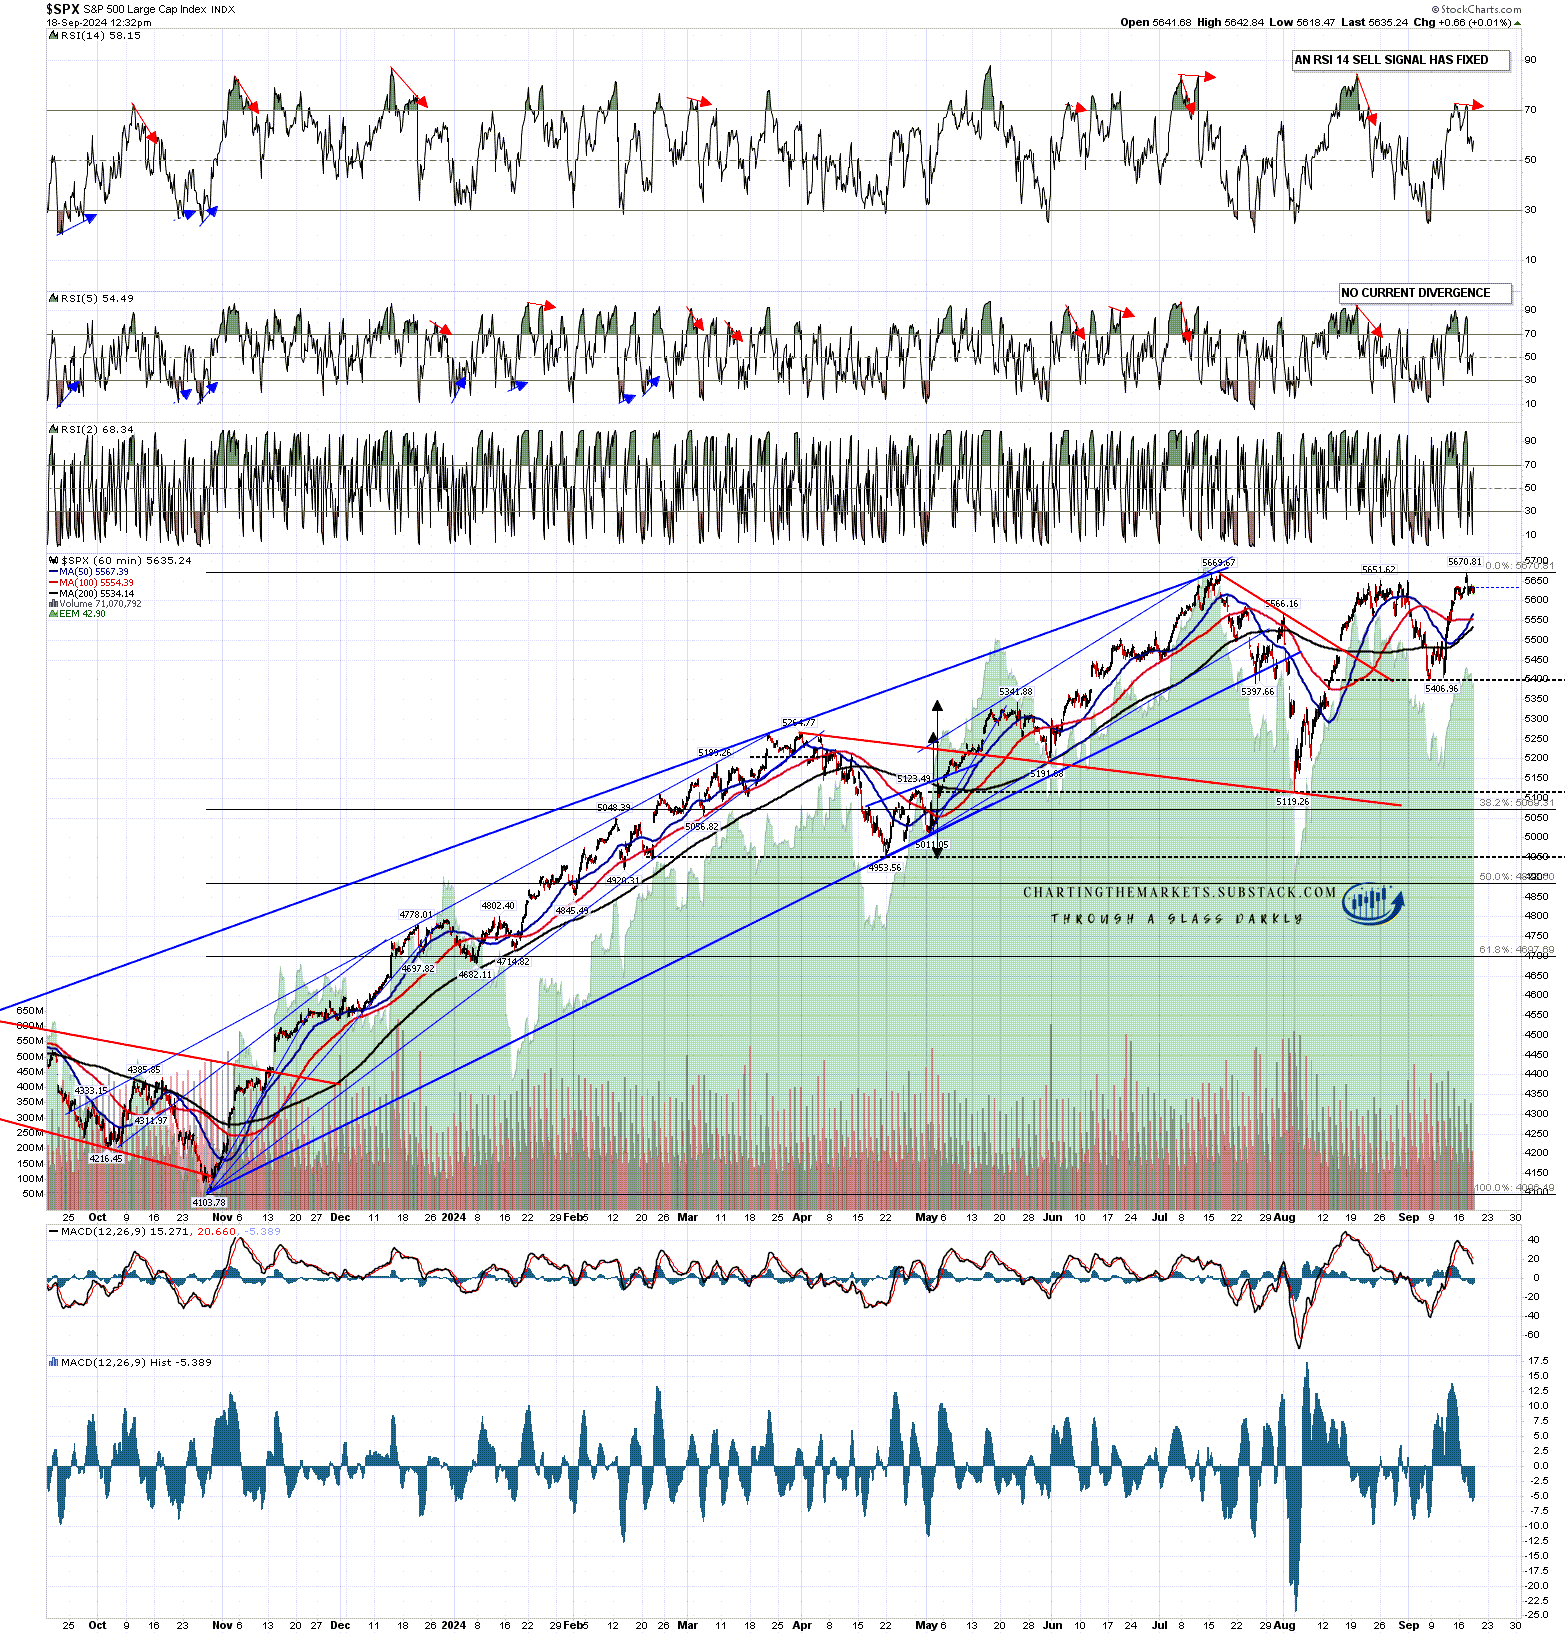
I have still been doing my premarket videos every day as normal at my chartingthemarkets substack and, after that low was made I said there was a strong case for a retest of the all time highs on SPX and Dow next, at which point there would be a lovely topping setup on both, and a fail area inflection point that could deliver a big decline from there into October. Both of those all time highs have now been retested, and that really nice topping setup has formed. We are waiting for the decision on whether this will now break down within the setup or break up out of it.
On SPX there is a clear and very high quality nested double top setup. On a sustained break below smaller double top support at 5406.96, the double top target would be in the 5143 to 5162 range. Larger double top support is at 5119.26, and on a sustained break below there the double top target would be in the 4570-90 area.
In the short term an RSI 14 hourly sell signal has fixed. Five out of the last seven of these made target, with that target of course being in the 30-5 area on the hourly RSI 14.
SPX 60min chart:
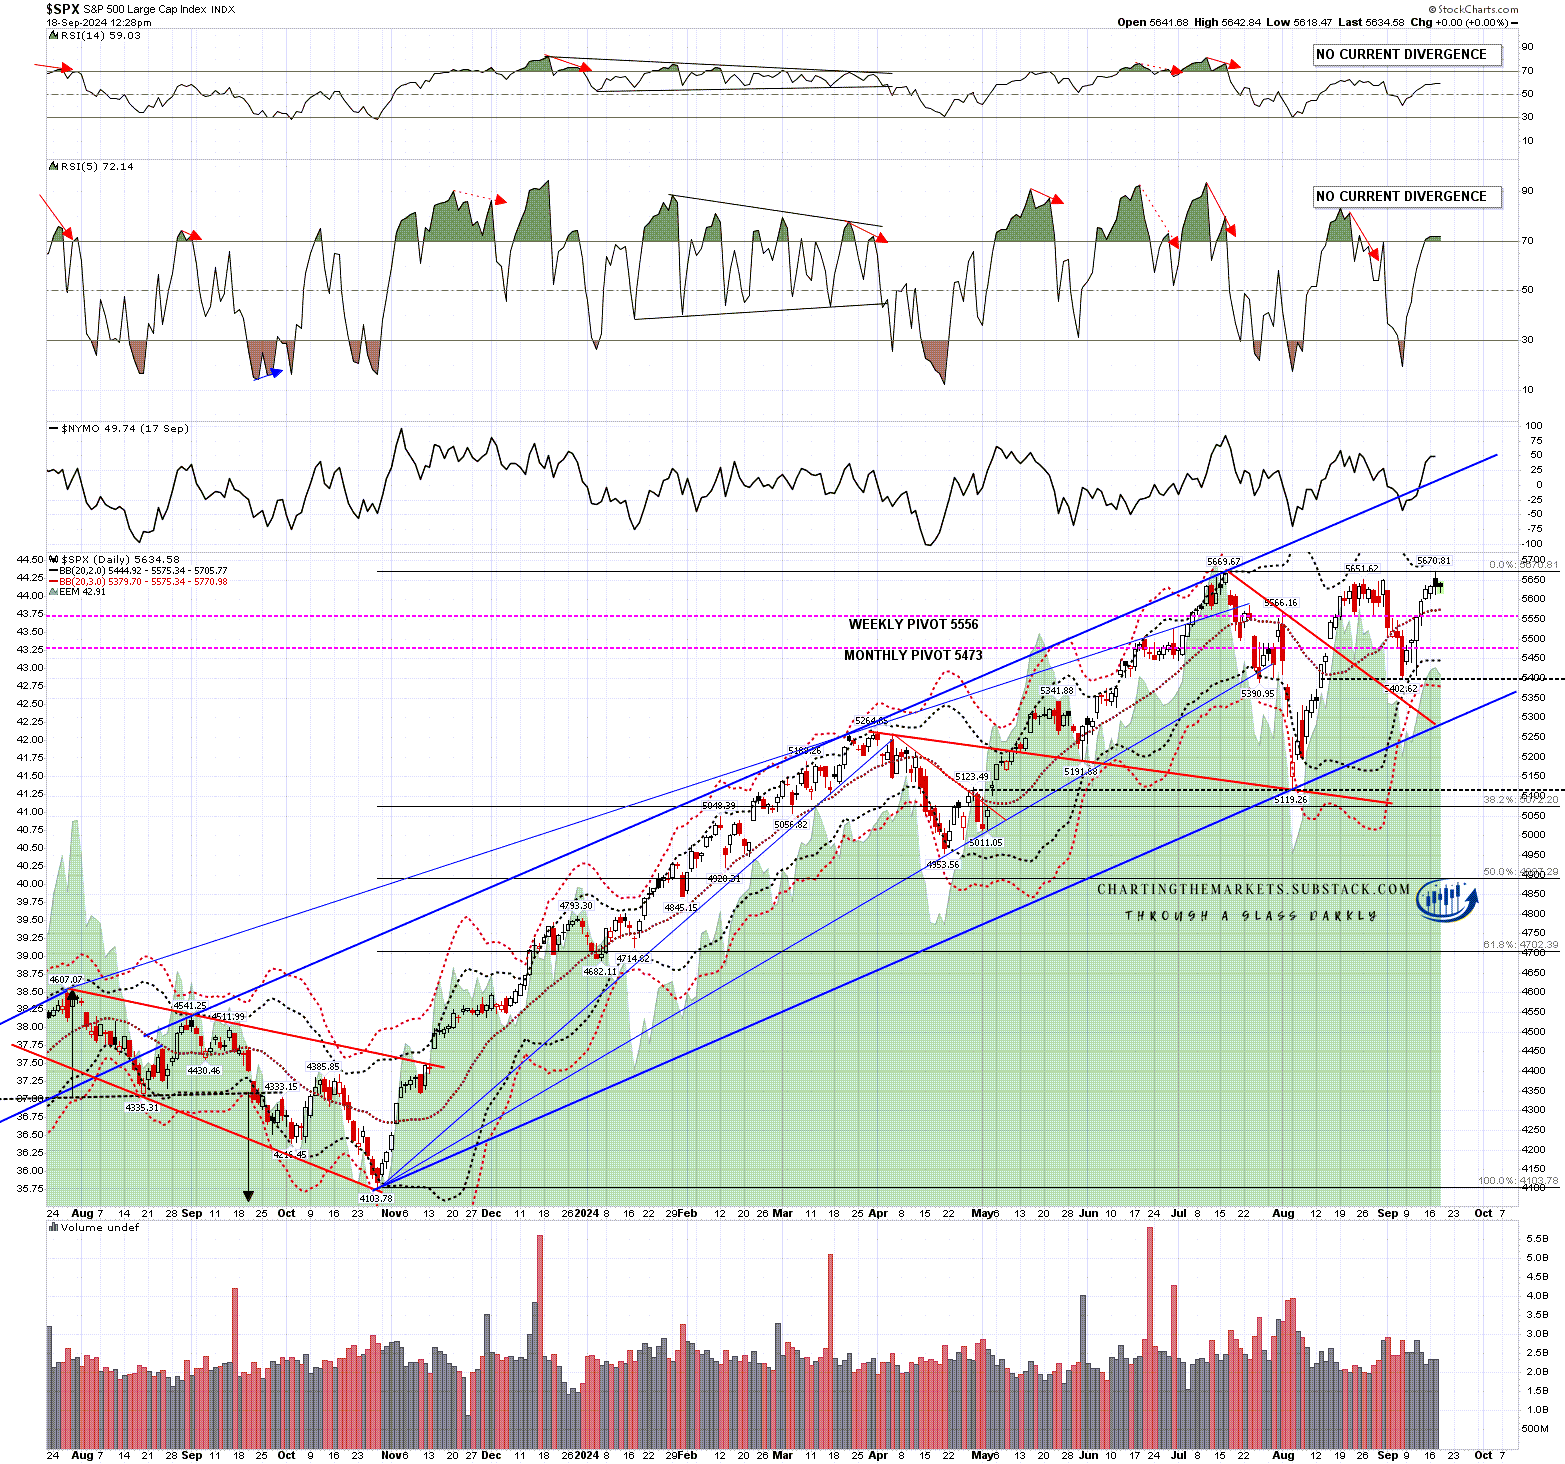
On the daily chart there is no current negative divergence, and a retest from here today wouldn’t deliver that. Equities would need to go lower, hold that into the end of a day, then retest the high to deliver that.
Worth noting on this chart are the two trendlines on this very nice rising wedge. On a break up, the target would be rising wedge resistance, currently in the 5900 area. On a break down directly there is no support trendline as SPX will have been topping out after breaking down from the prior support trendline in late July.
I would note that this rising wedge came from the last big low in October 2023, and that a break down below 4600 would be well beyond the 61.8% retracement of that wedge at 4702. I’m wondering about a break below larger double top support at 5119.26, opening up possible normal retracement targets at the 38.2% fib retracement at 5072, or the standard 50% retracement at 4887. We have seen a lot of big lows in late October in recent years, and I’d be wondering about hitting one of those target areas in late October and making a big low there.
SPX daily BBs chart:
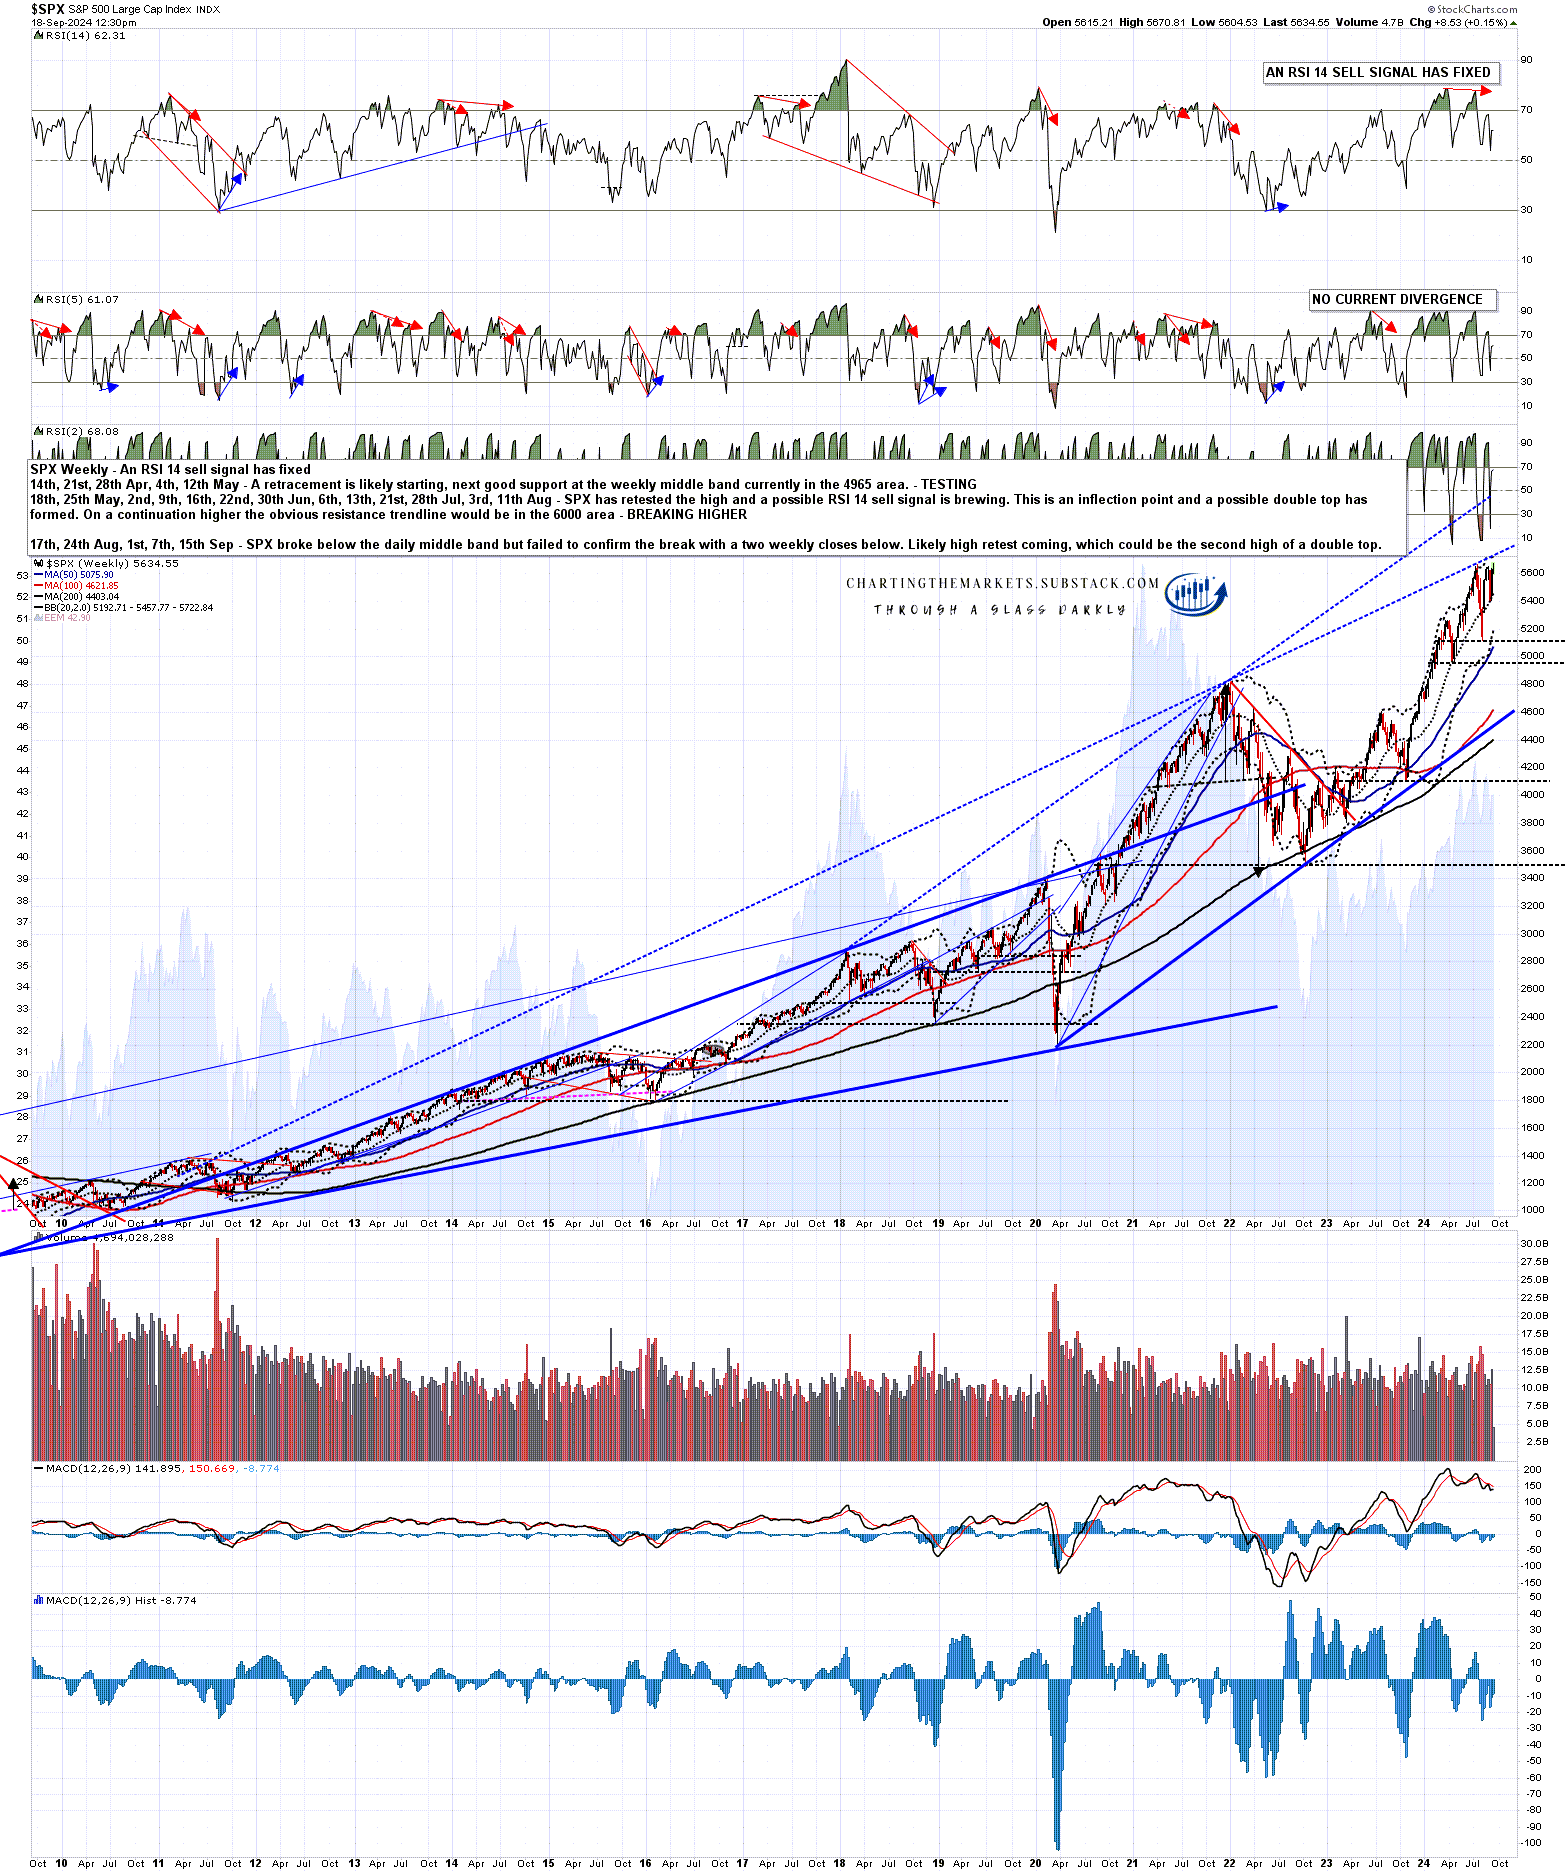
There is one other chart to look at on SPX here, and that is the weekly chart. On there an RSI 14 sell signal has fixed, and these often make target. Now the other thing you can see on this chart is the SPX is testing a possible resistance trendline on a much larger rising wedge from the 2020 low.
If the trendline holds, then a backtest of rising wedge support from the 2020 low would have that trendline currently in the 4550 area, a good match with the larger double top target on SPX in the 4570-90 area. Either way there is solid backup for the obvious next targets on the daily chart. Food for thought.
SPX weekly chart:
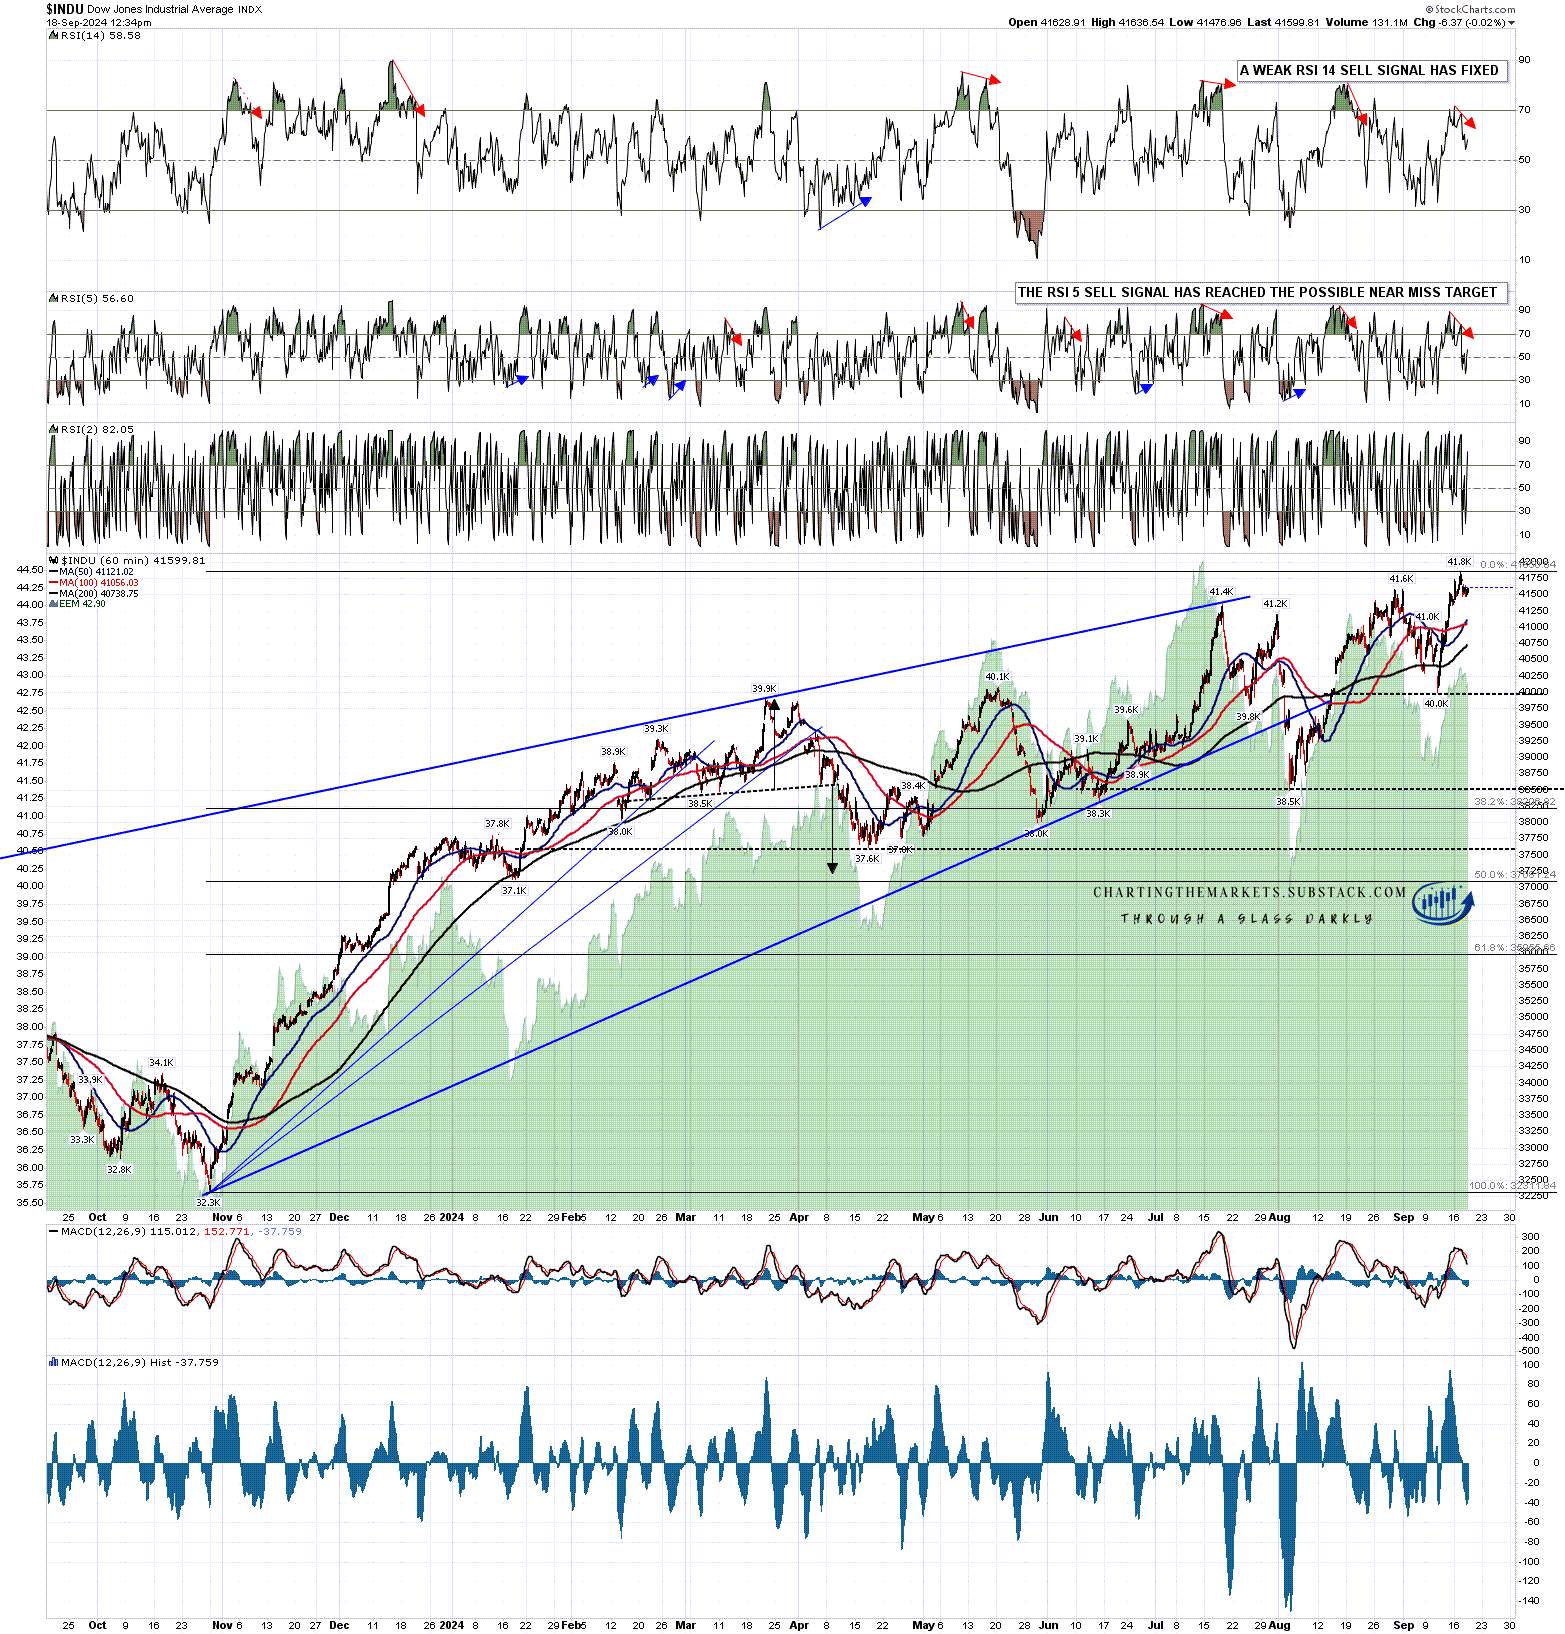
On the Dow chart there is another nested double top setup, though not quite as perfectly formed as the corresponding one on SPX. On a sustained break below the smaller double top support at 40k, the smaller double top target would be in the 38.2k to 38.4k area. That would already take Dow below larger double top support at 38.5k, and a sustained break below that would look for a target in the 35.2k to 35.6k area.
INDU 60min chart:
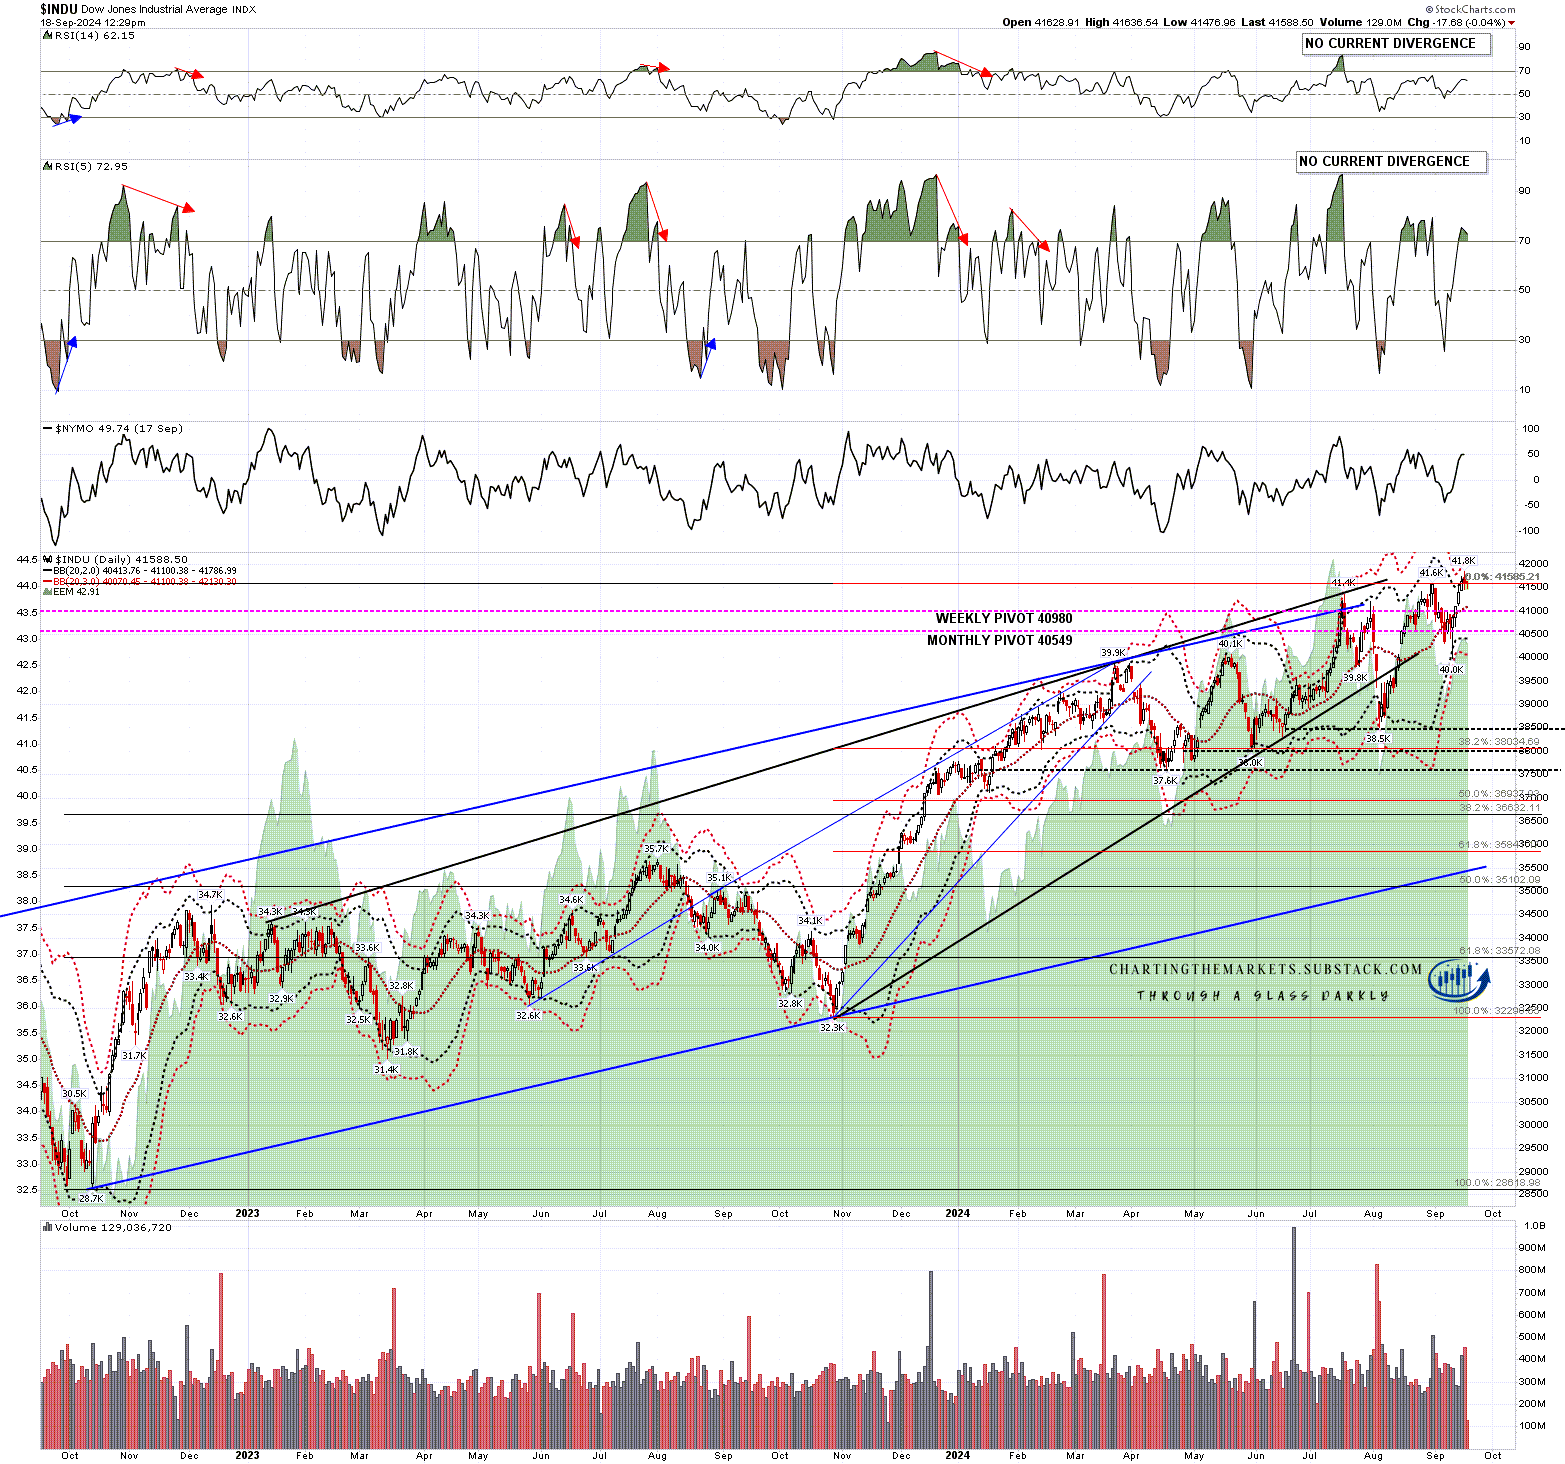
On the daily chart I would note that the larger double top target is currently a match with rising support from the October 2022 low.
INDU daily BBs chart:
This is a big inflection point, and what happens next here will likely define the next few weeks, and very possibly the rest of the year. It will be very interesting to see what the Fed has to say today, and the effect that has on SPX and Dow both today and over the next few days.
If you like my analysis and would like to see more, please take a free subscription at my chartingthemarkets substack, where I publish these posts first and do a short premarket review every morning.
No comments:
Post a Comment