
In my post last week I was looking at the big inflection point here on equity indices, and they are still in that inflection point, though there have been some developments since which I’ll go through today.
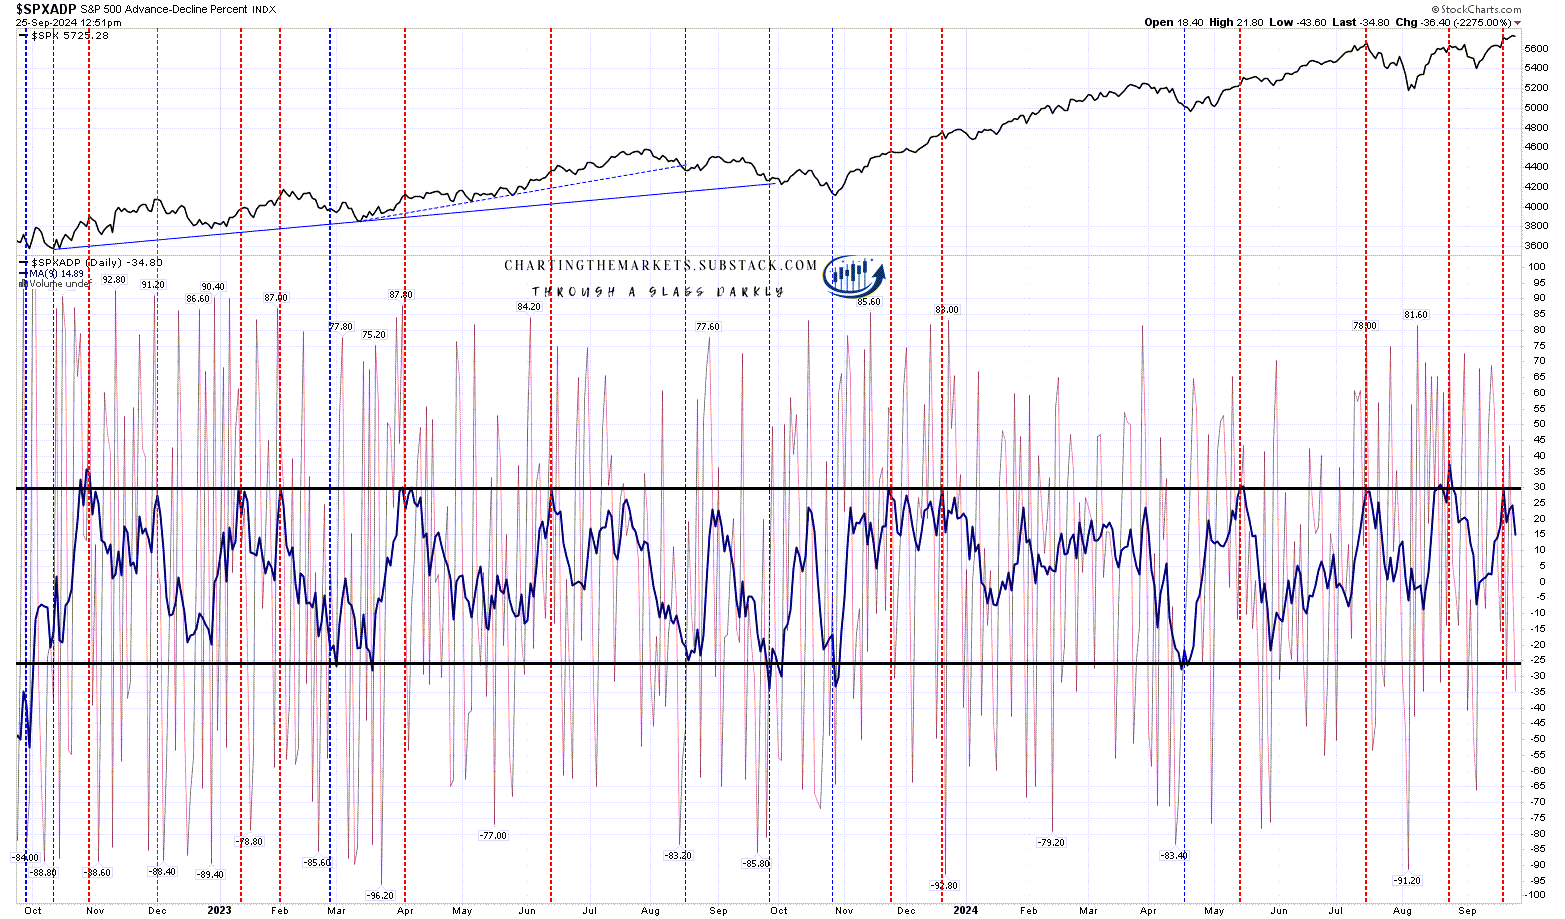
I use the $SPXADP daily chart as one rough and ready guide to where there might be a retracement or consolidation coming on SPX, and that hit the key upside level at 30 on Friday. There are 11 previous hits of 30 on the chart below (red dotted vertical trendlines), and all of them signalled either a retracement starting within a couple of days (seven instances) and/or a sideways consolidation lasting at least two or three weeks, so it is likely that we will be looking at that again here.
SPXADP daily chart:
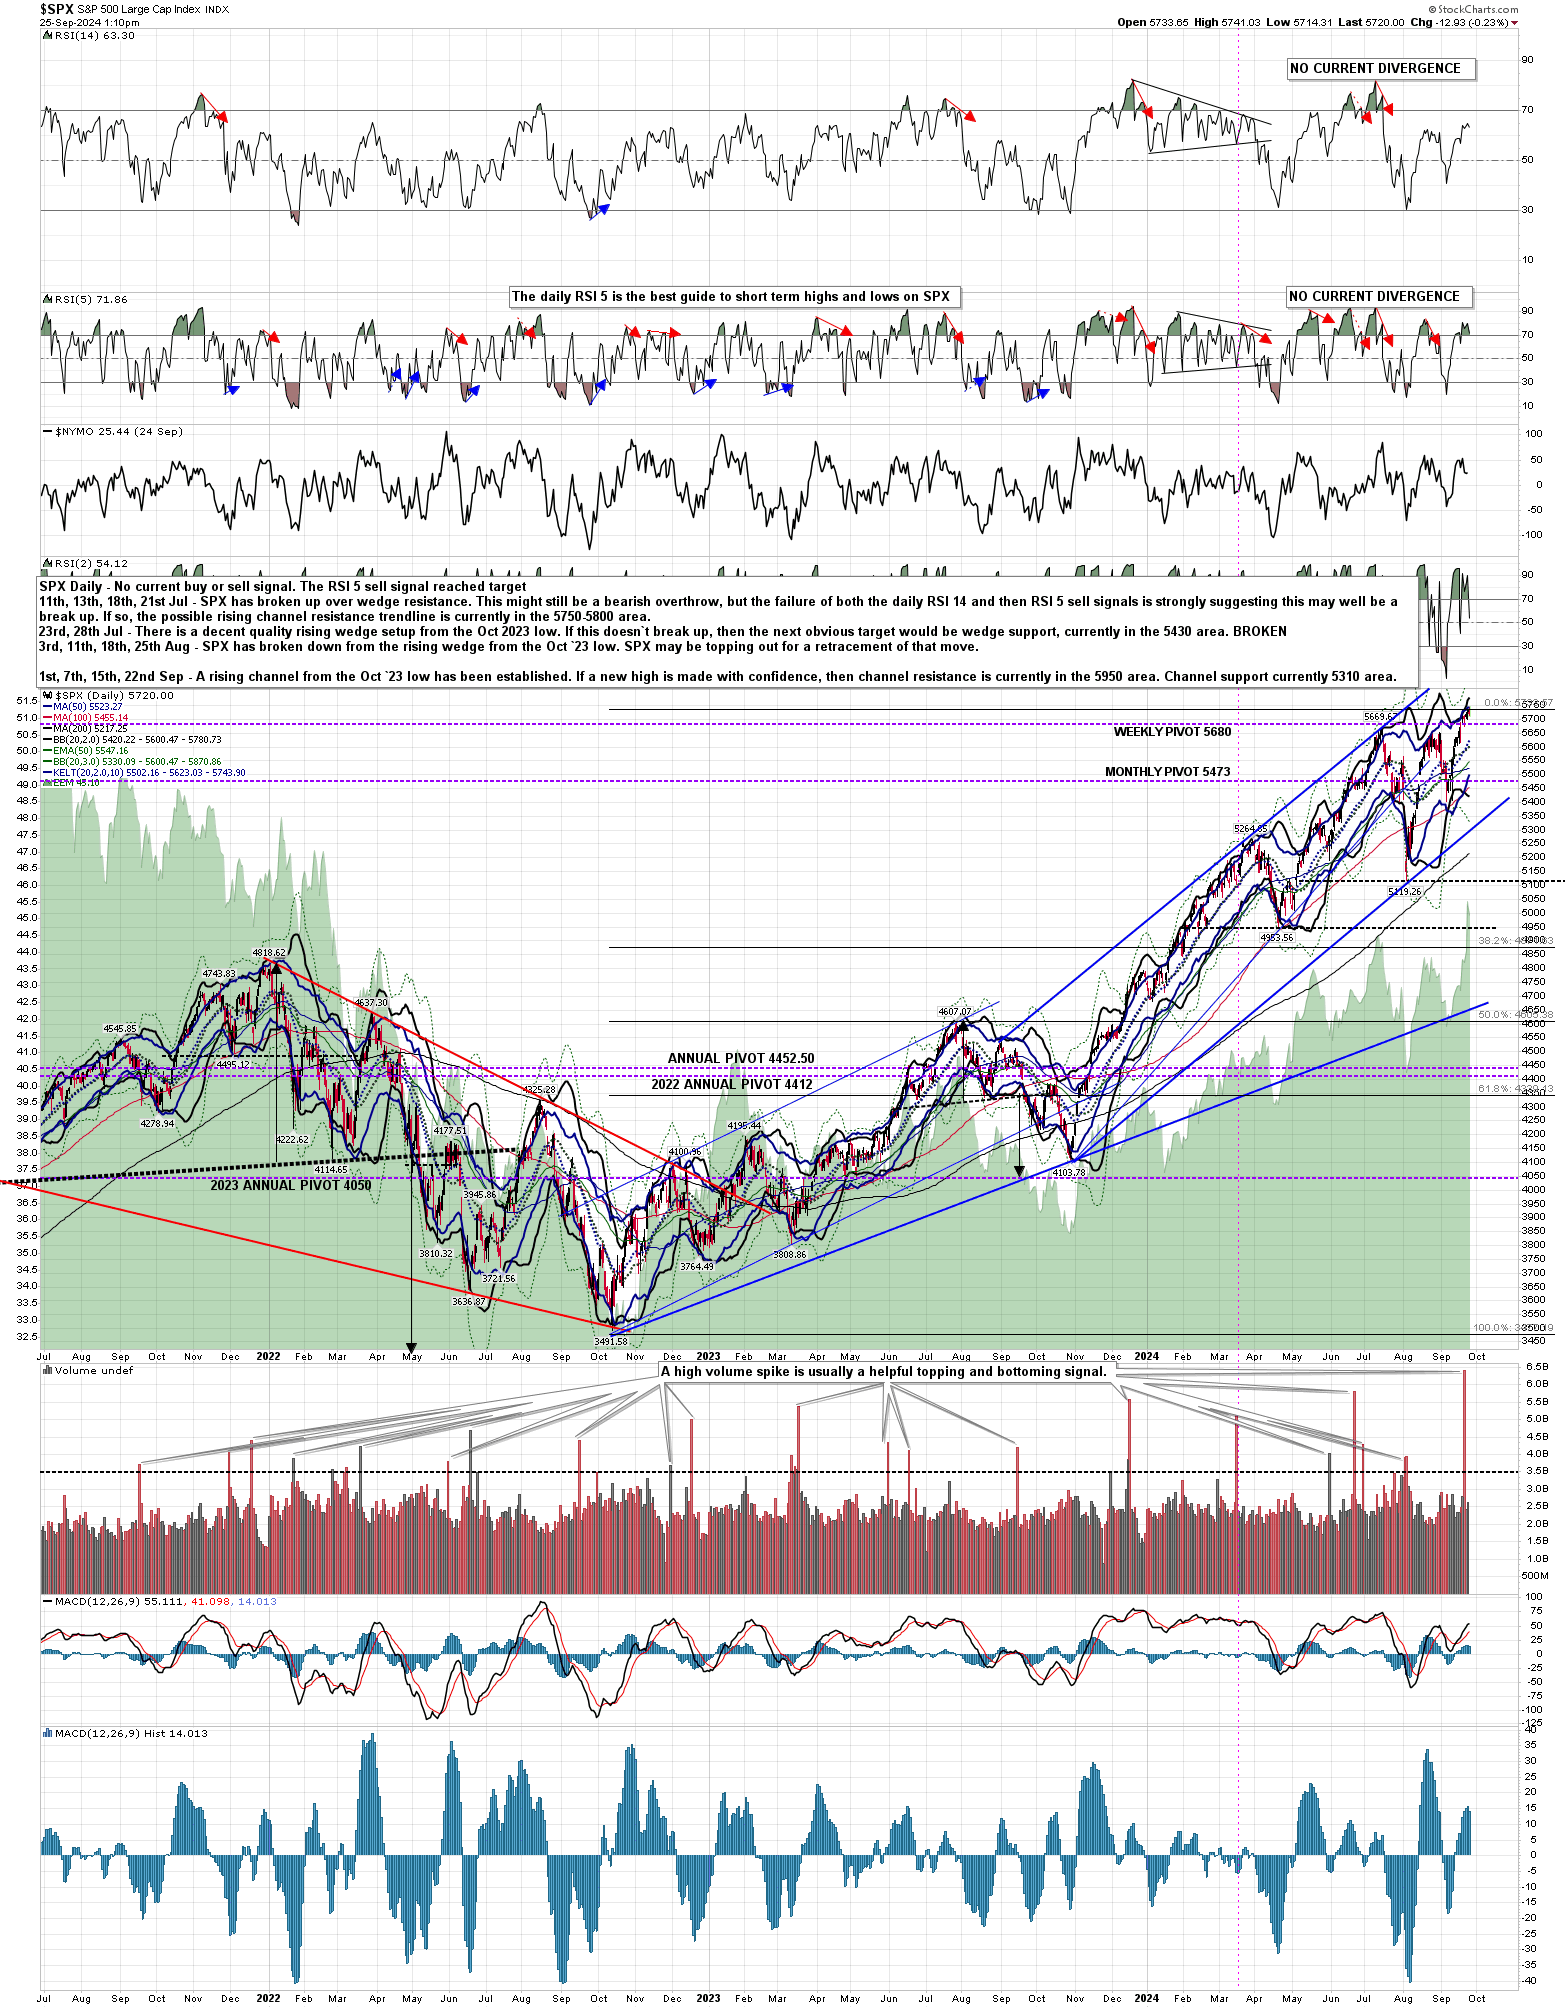
That wasn’t the only significant hit on Friday, as SPX also saw the highest daily volume spike since the start of the chart below in late June 2021. As I say on the chart below, this is usually a helpful topping or bottoming signal and, in this case, it would be a possible topping signal. There are nineteen previous hits on the chart below, counting consecutive day hits as the first hit as a single hit, with eight of those during a strong run up. Again, all of those were followed by at least modest retracements not long after.
SPX daily chart:
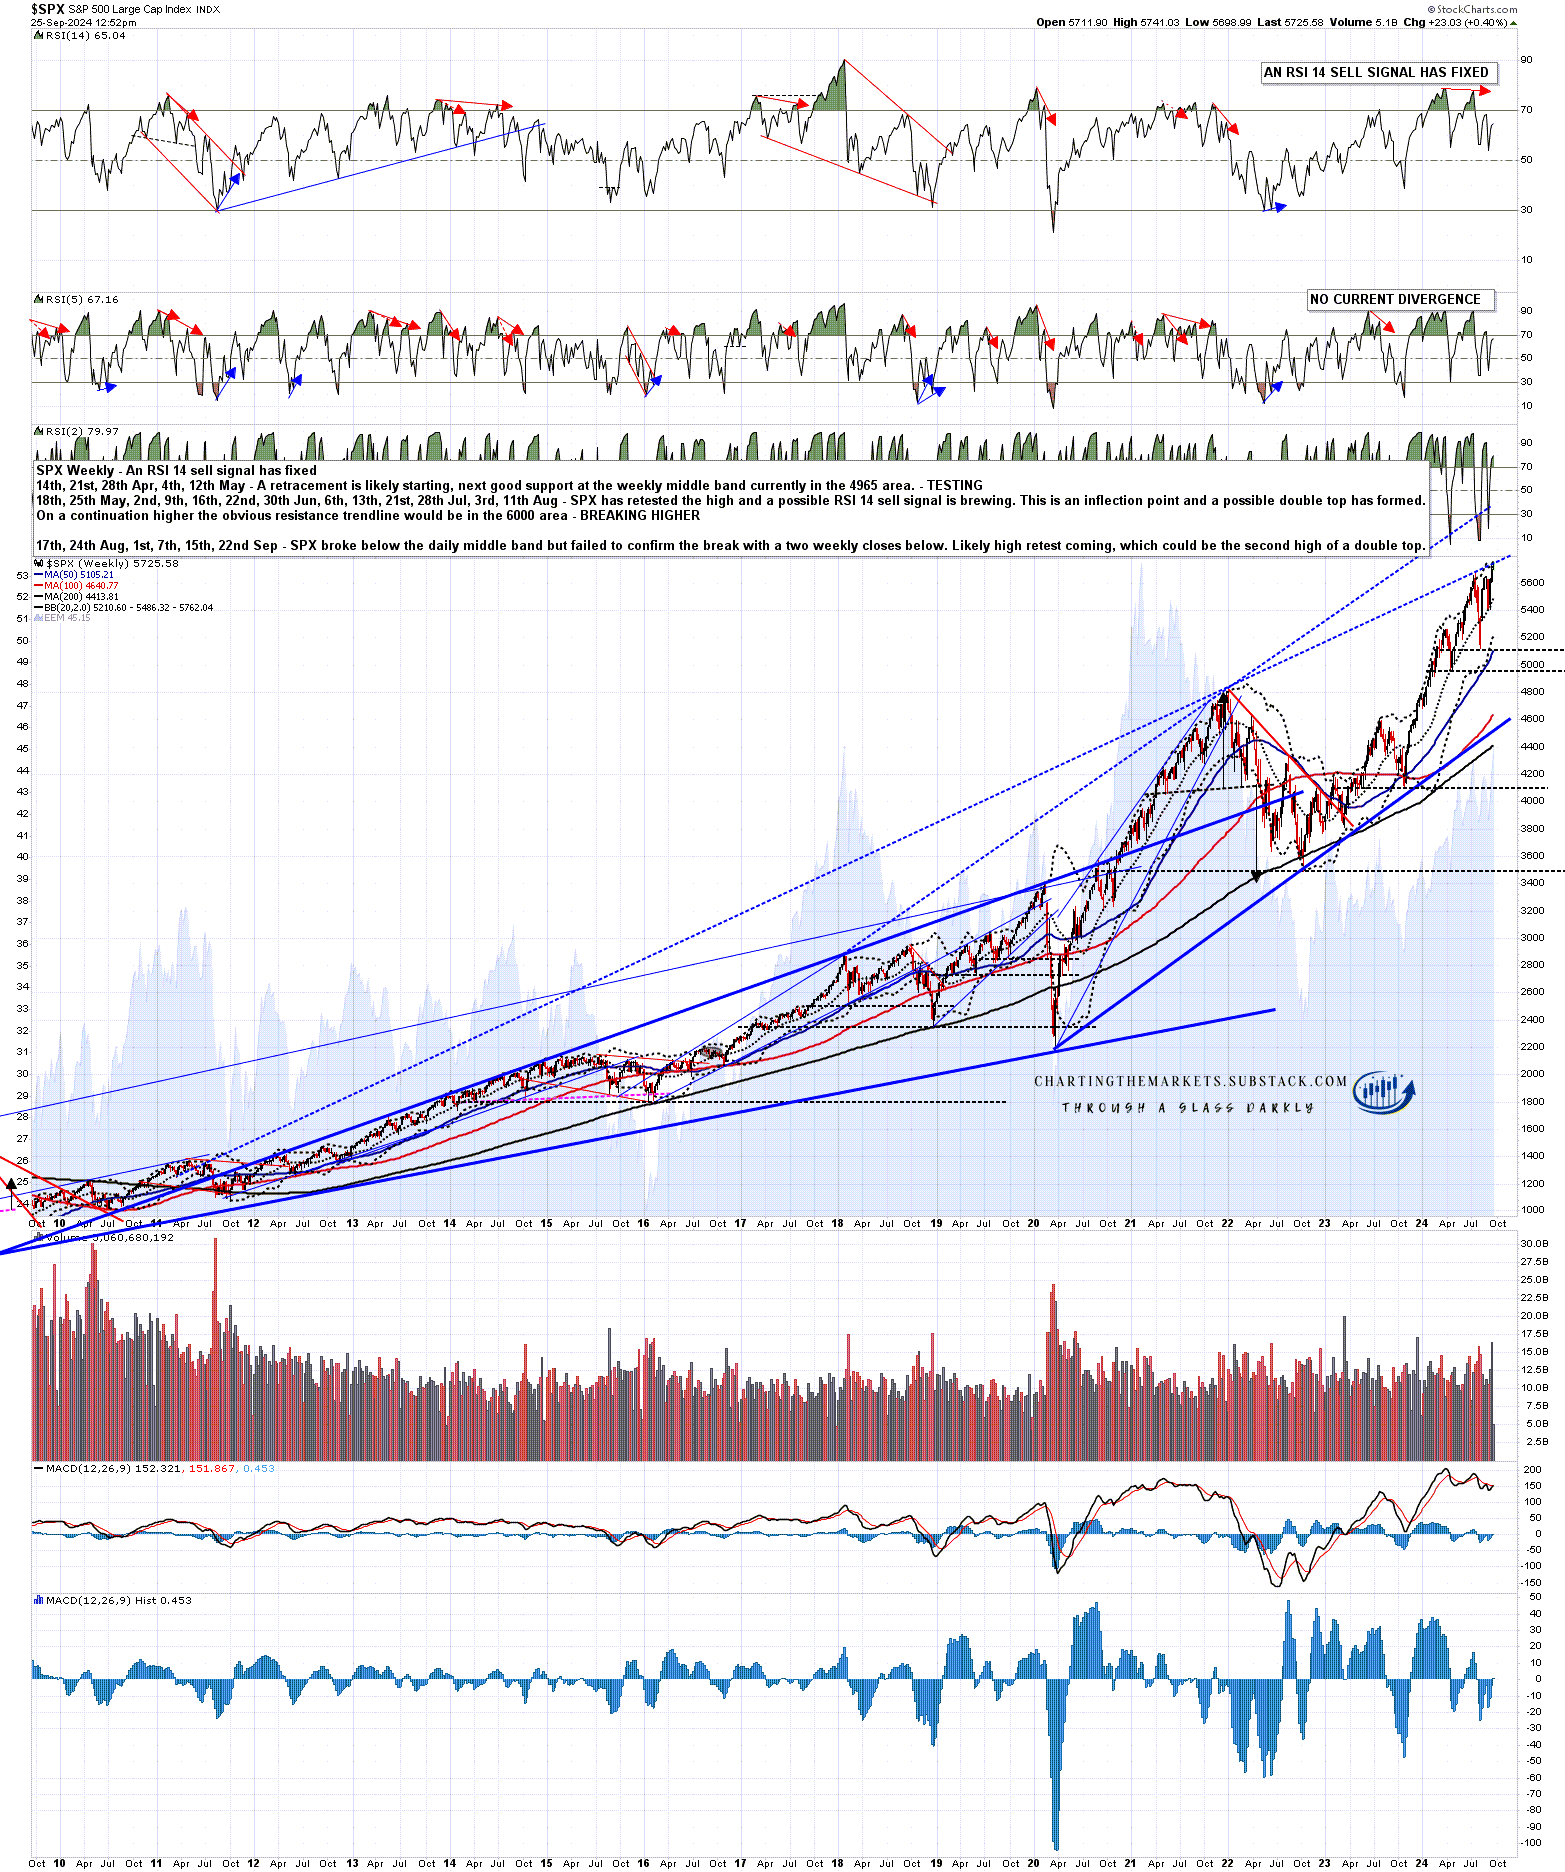
The SPX weekly chart I posted a week ago showed a possible large resistance trendline that has since been retested and is holding so far. That doesn’t mean that we’ll be seeing a retracement to the corresponding support trendline now in the 4600 area, but it is interesting.
SPX weekly chart
In the short term I’ve been talking in my premarket videos this week about the charts above, and suggesting that if the setup for a decent retracement here was to improve further, then a smaller retracement here to take the daily RSI 5 on SPX, NDX and Dow down under the 70 level, followed by a high retest and fail could set up some really decent quality possible daily RSI 5 sell signals, as well as nice double top setups.
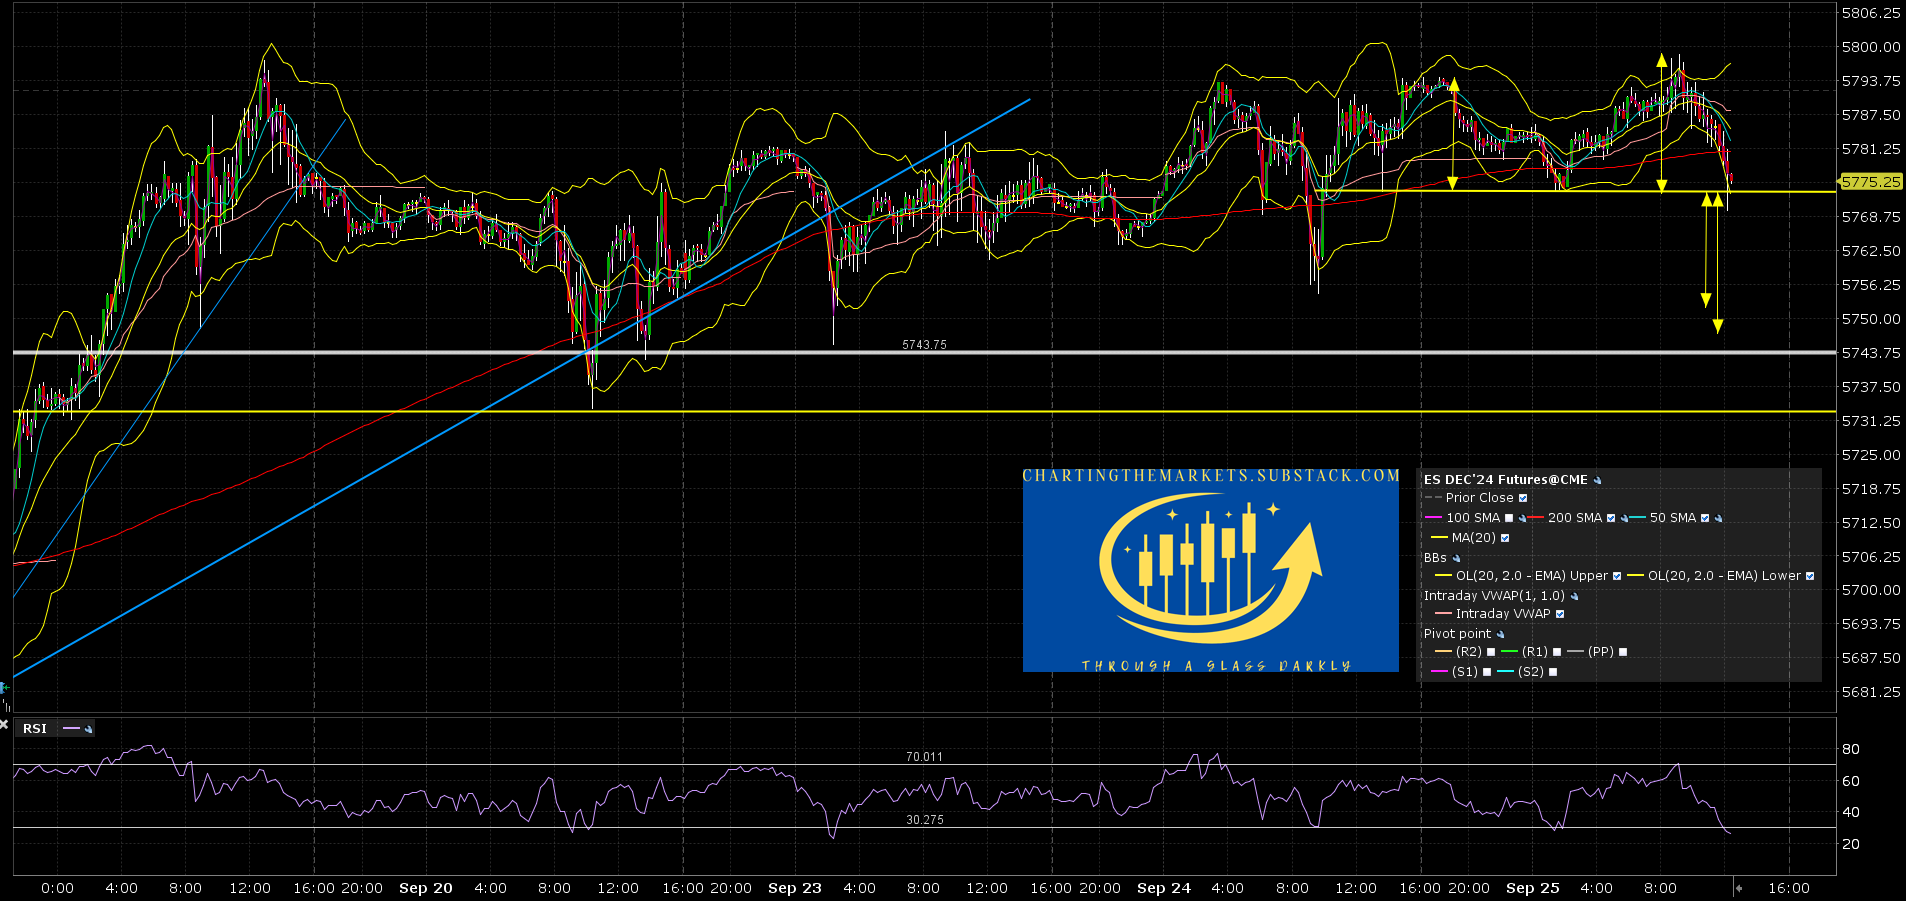
I’ve been looking at the short term double top setups on SPX in the morning, but there’s a smaller setup on ES that is trying to break down today, that on a sustained break below the 5773 ES would have a target in the 5748-53 ES area. The direct equivalent to the SPX setup I’ve been looking at is the larger possible double setup that on a sustained break below 5733 ES would have a target in the 5668/9 ES area.
ES Dec 15min chart:
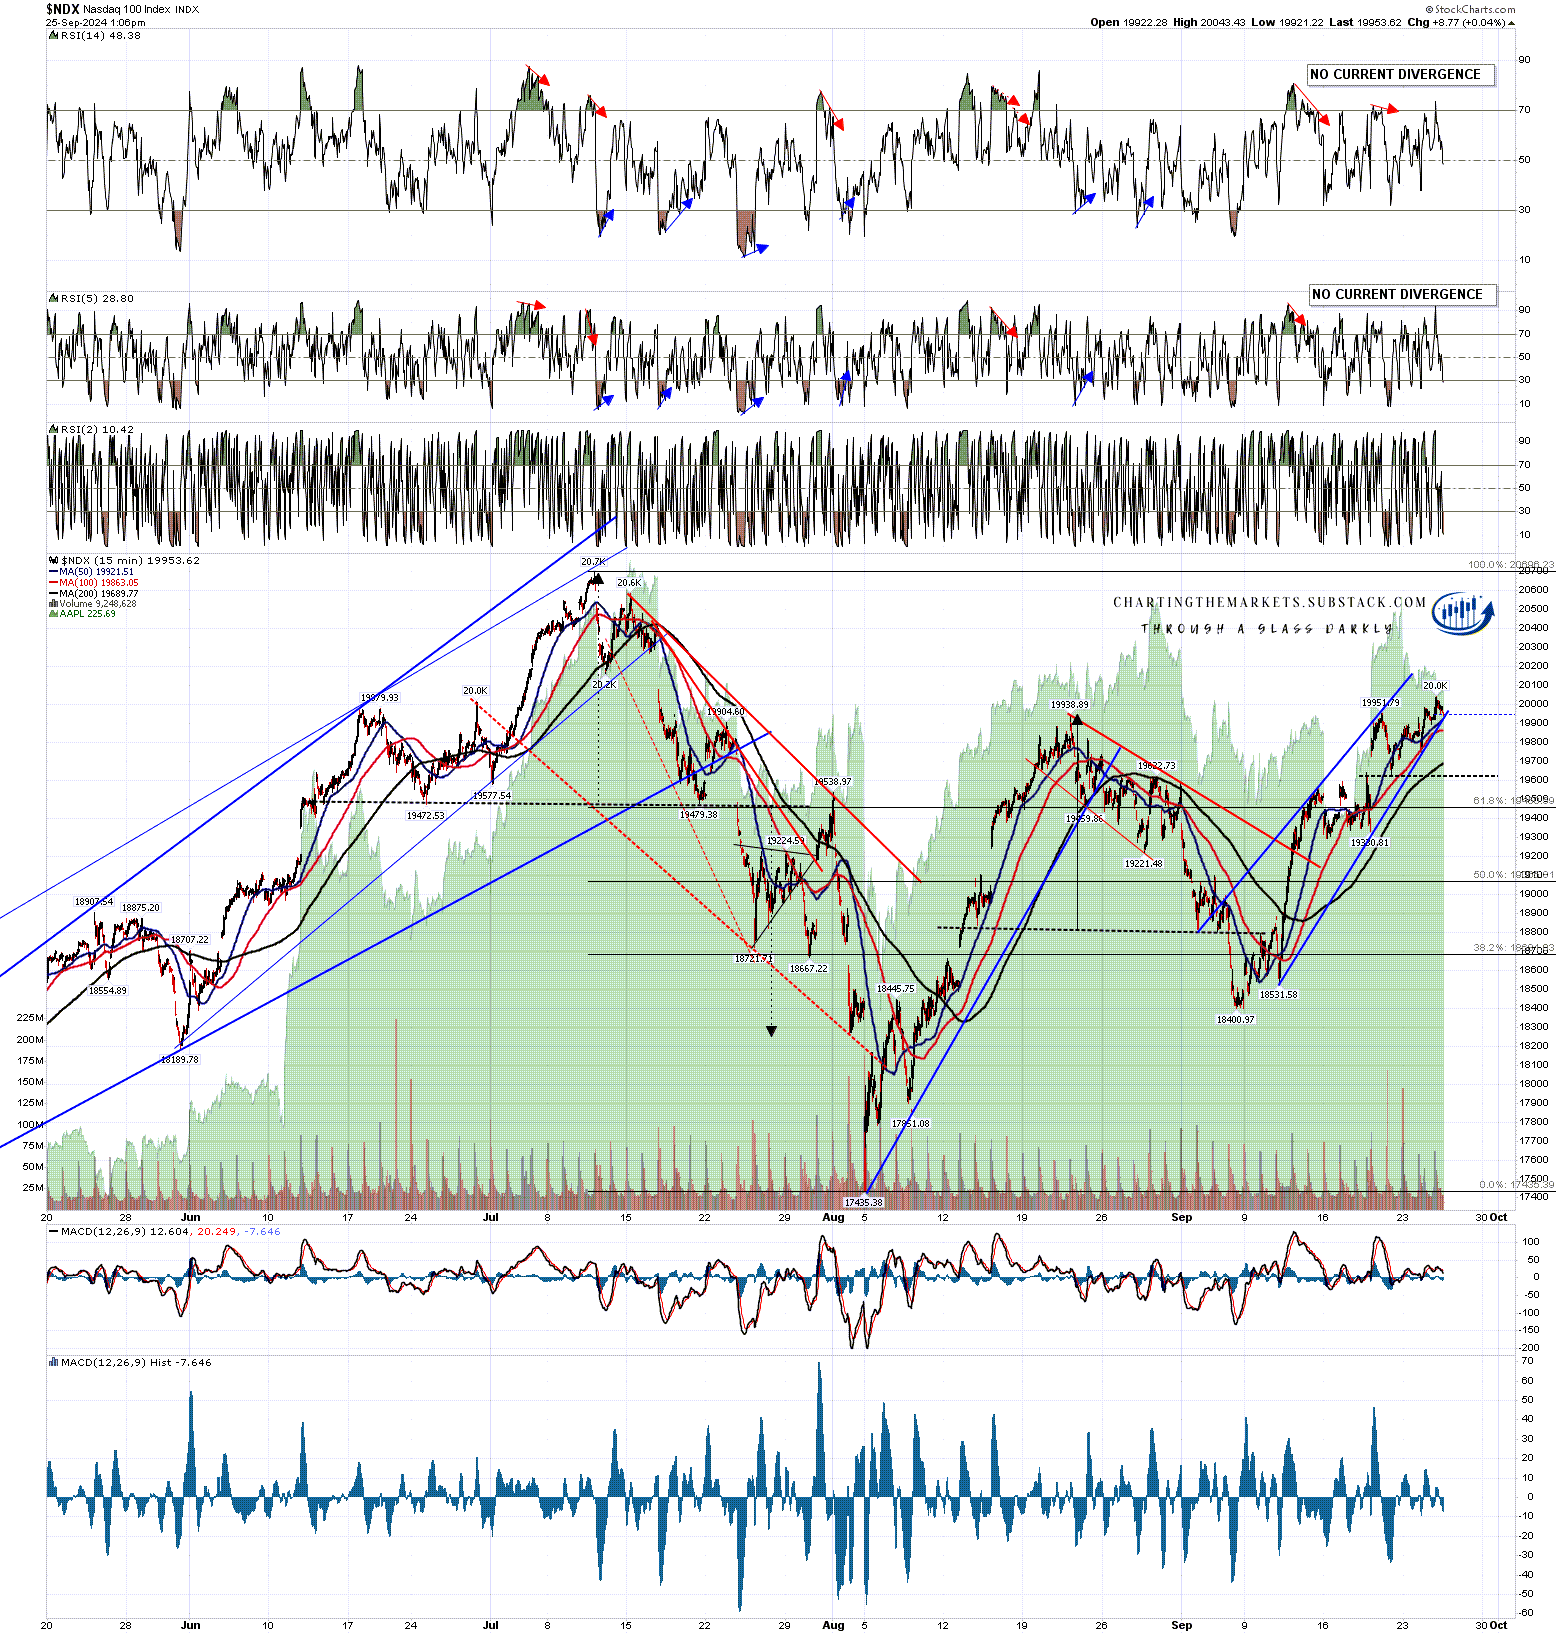
There is also a possible double top setup on the NDX chart that looks interesting. On a sustained break below the 19620 area the double top target would be in the 19240 to 19290 area. Not a huge retracement but, if seen, would likely deliver the decline on the daily RSI 5 sell signal needed to set up possible negative divergence there on a subsequent retest of the high at 19984.47.
NDX 15min chart:
I have mixed feelings about reversal here, as the Fed gave the markets a half percentage point cut last week and is suggesting there may well be another similar cut in December.
That said, there are some indications that we may be building up to a decent decline here, and unless we see some decent resistance breaks here, the setup on energies over the next couple of months looks pretty bearish. We’ll see.
I’m planning a post on the setups on oil and natural gas tomorrow. If you’d like to see that, watch out for it on my twitter.
If you like my analysis and would like to see more, please take a free subscription at my chartingthemarkets substack, where I publish these posts first and do a short premarket review every morning.
No comments:
Post a Comment