
In my last post on Friday I was talking about the impressive track record for the daily sell signals currently fixed on SPX and Dow and looking at the possibility that H&S patterns might be forming for another leg down on SPX, NDX and Dow as those made target..
After yesterday those H&S patterns are mainly formed now, and if we are going to see those break down I’d expect that to happen in the next day or two, as otherwise the right shoulders, compared to the left shoulders, will start looking too disproportionately large, so the quality of the patterns will deteriorate.
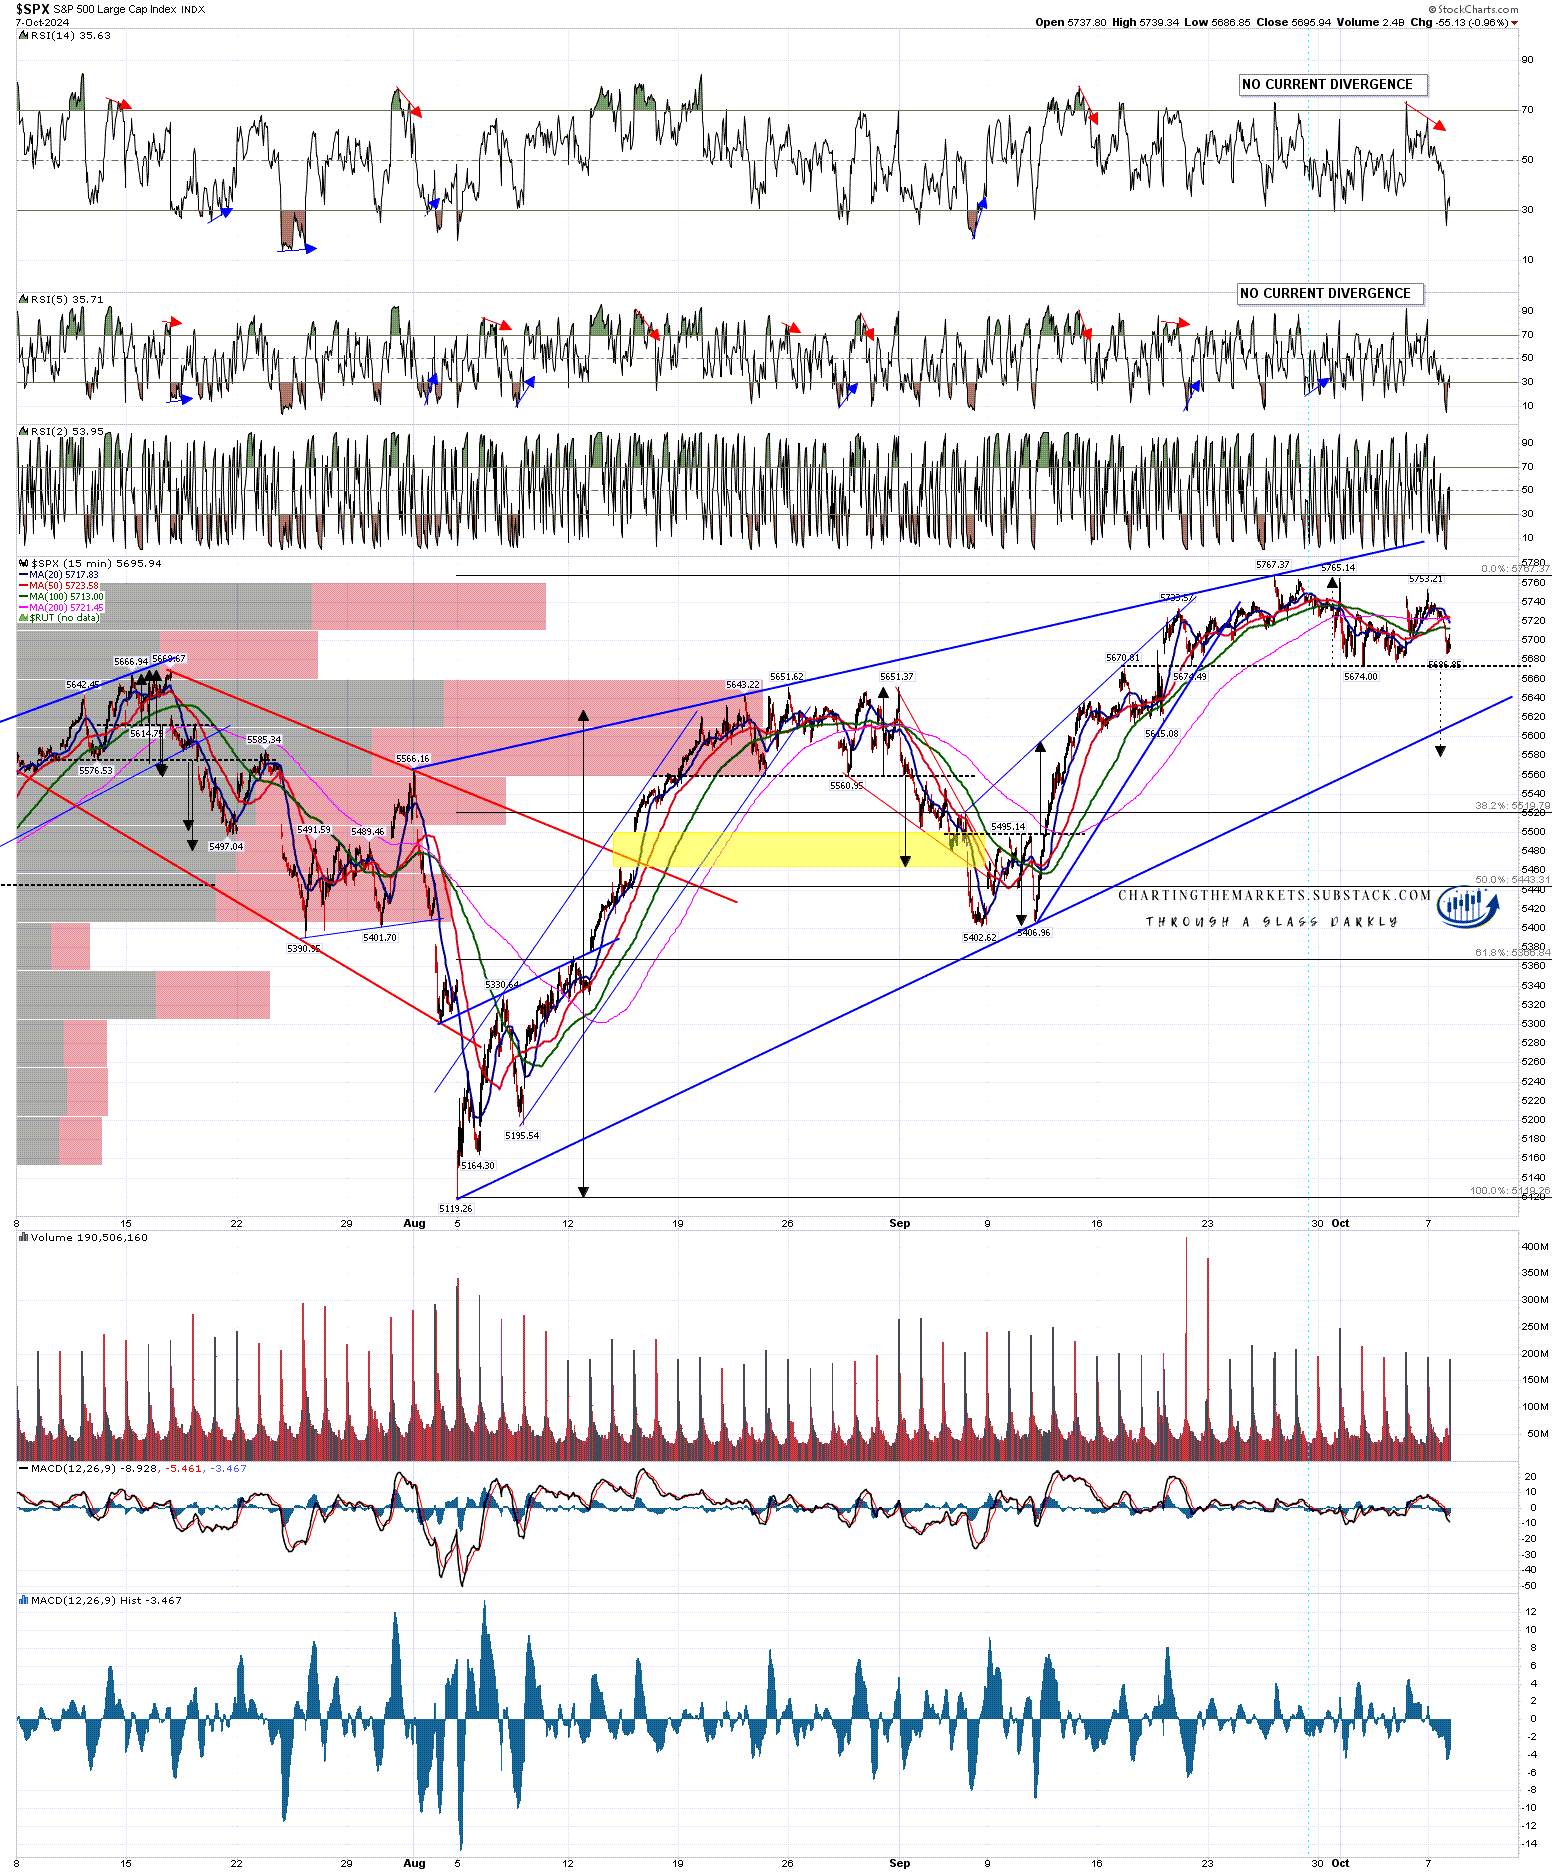
On the SPX chart a sustained break below 5674 (and the daily middle band currently at 5677) would look for a target in the 5581 area, with obvious support at the rising wedge support trendline from the August low, currently in the 5615 area.
Depending on where the daily candle closed, the daily RSI 5 sell signal possible near miss target might well be reached at rising wedge support, and the full target would likely be reached at the H&S target.
SPX 15min chart:
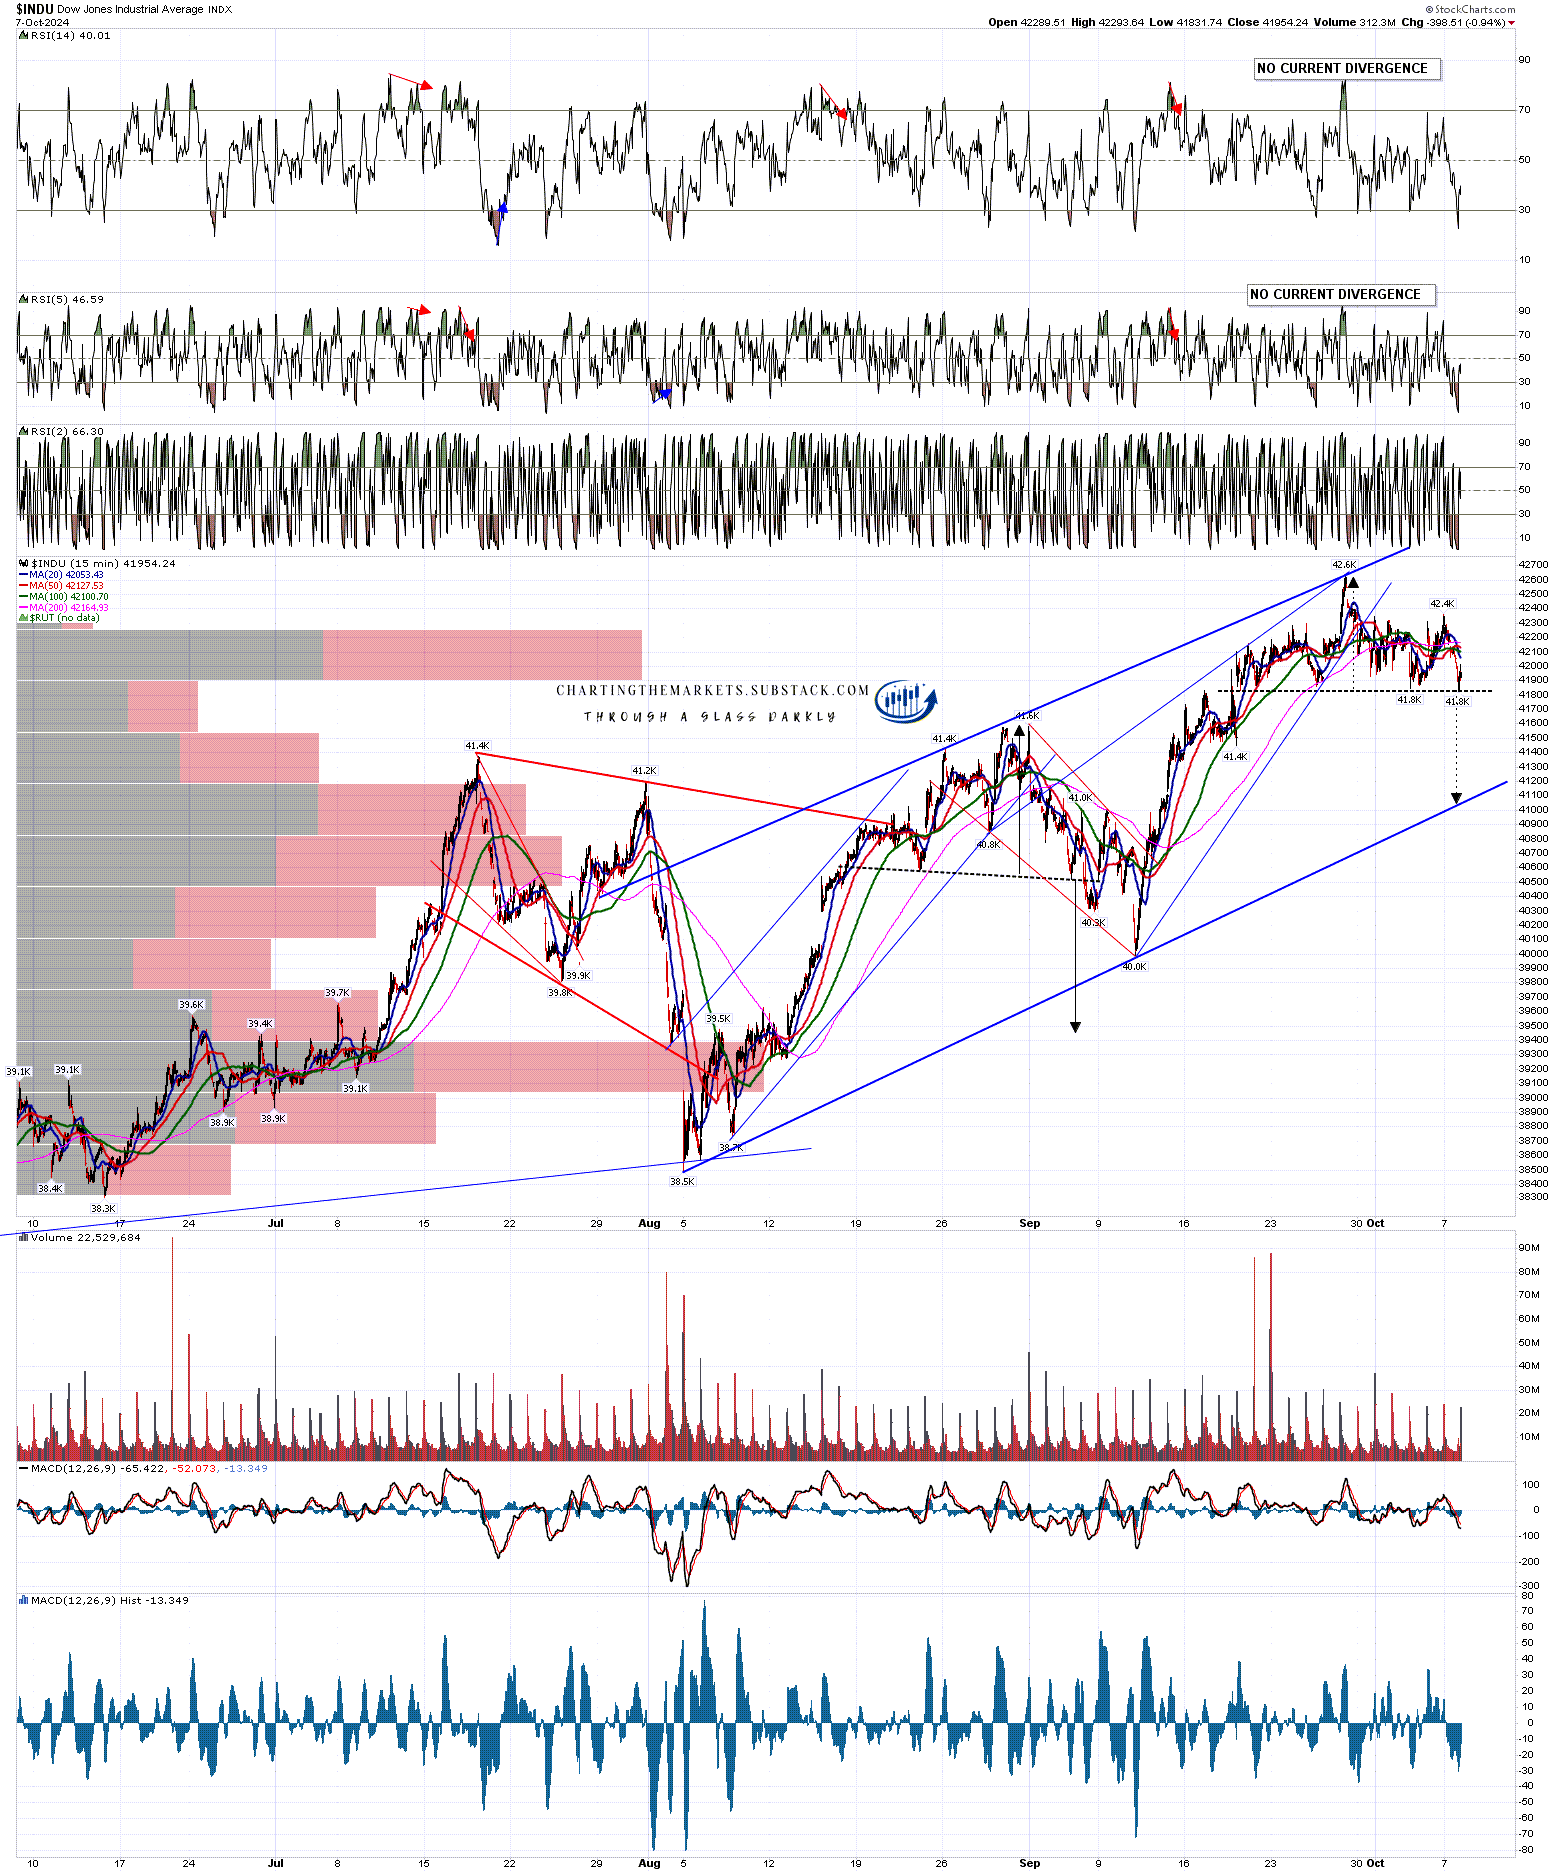
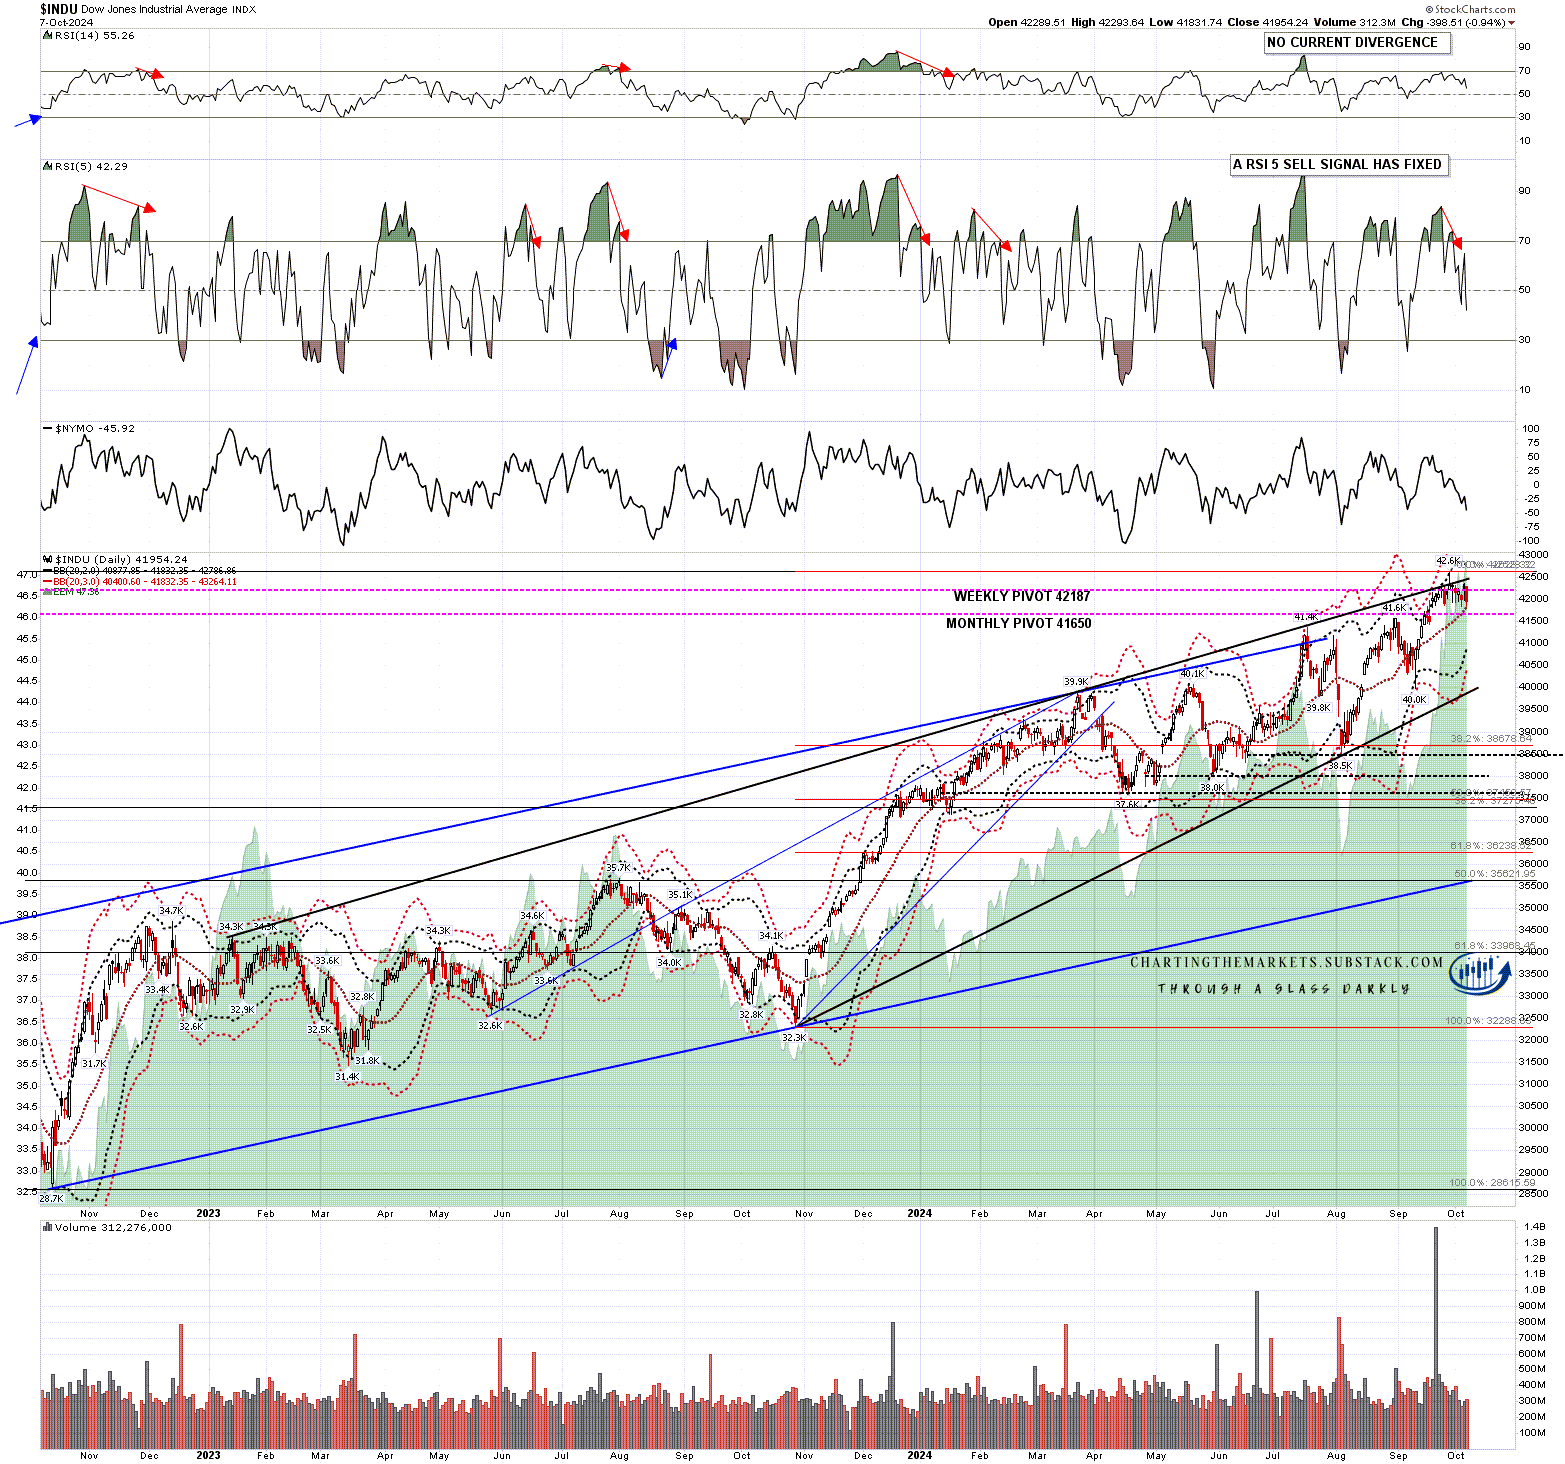
On the Dow chart on a sustained break below 41.7k the H&S target would be in the 41050 area, very close to rising wedge support there. Depending on where the daily candle closed, the daily RSI 5 sell signal full target would likely be reached at the H&S target.
INDU 15min chart:
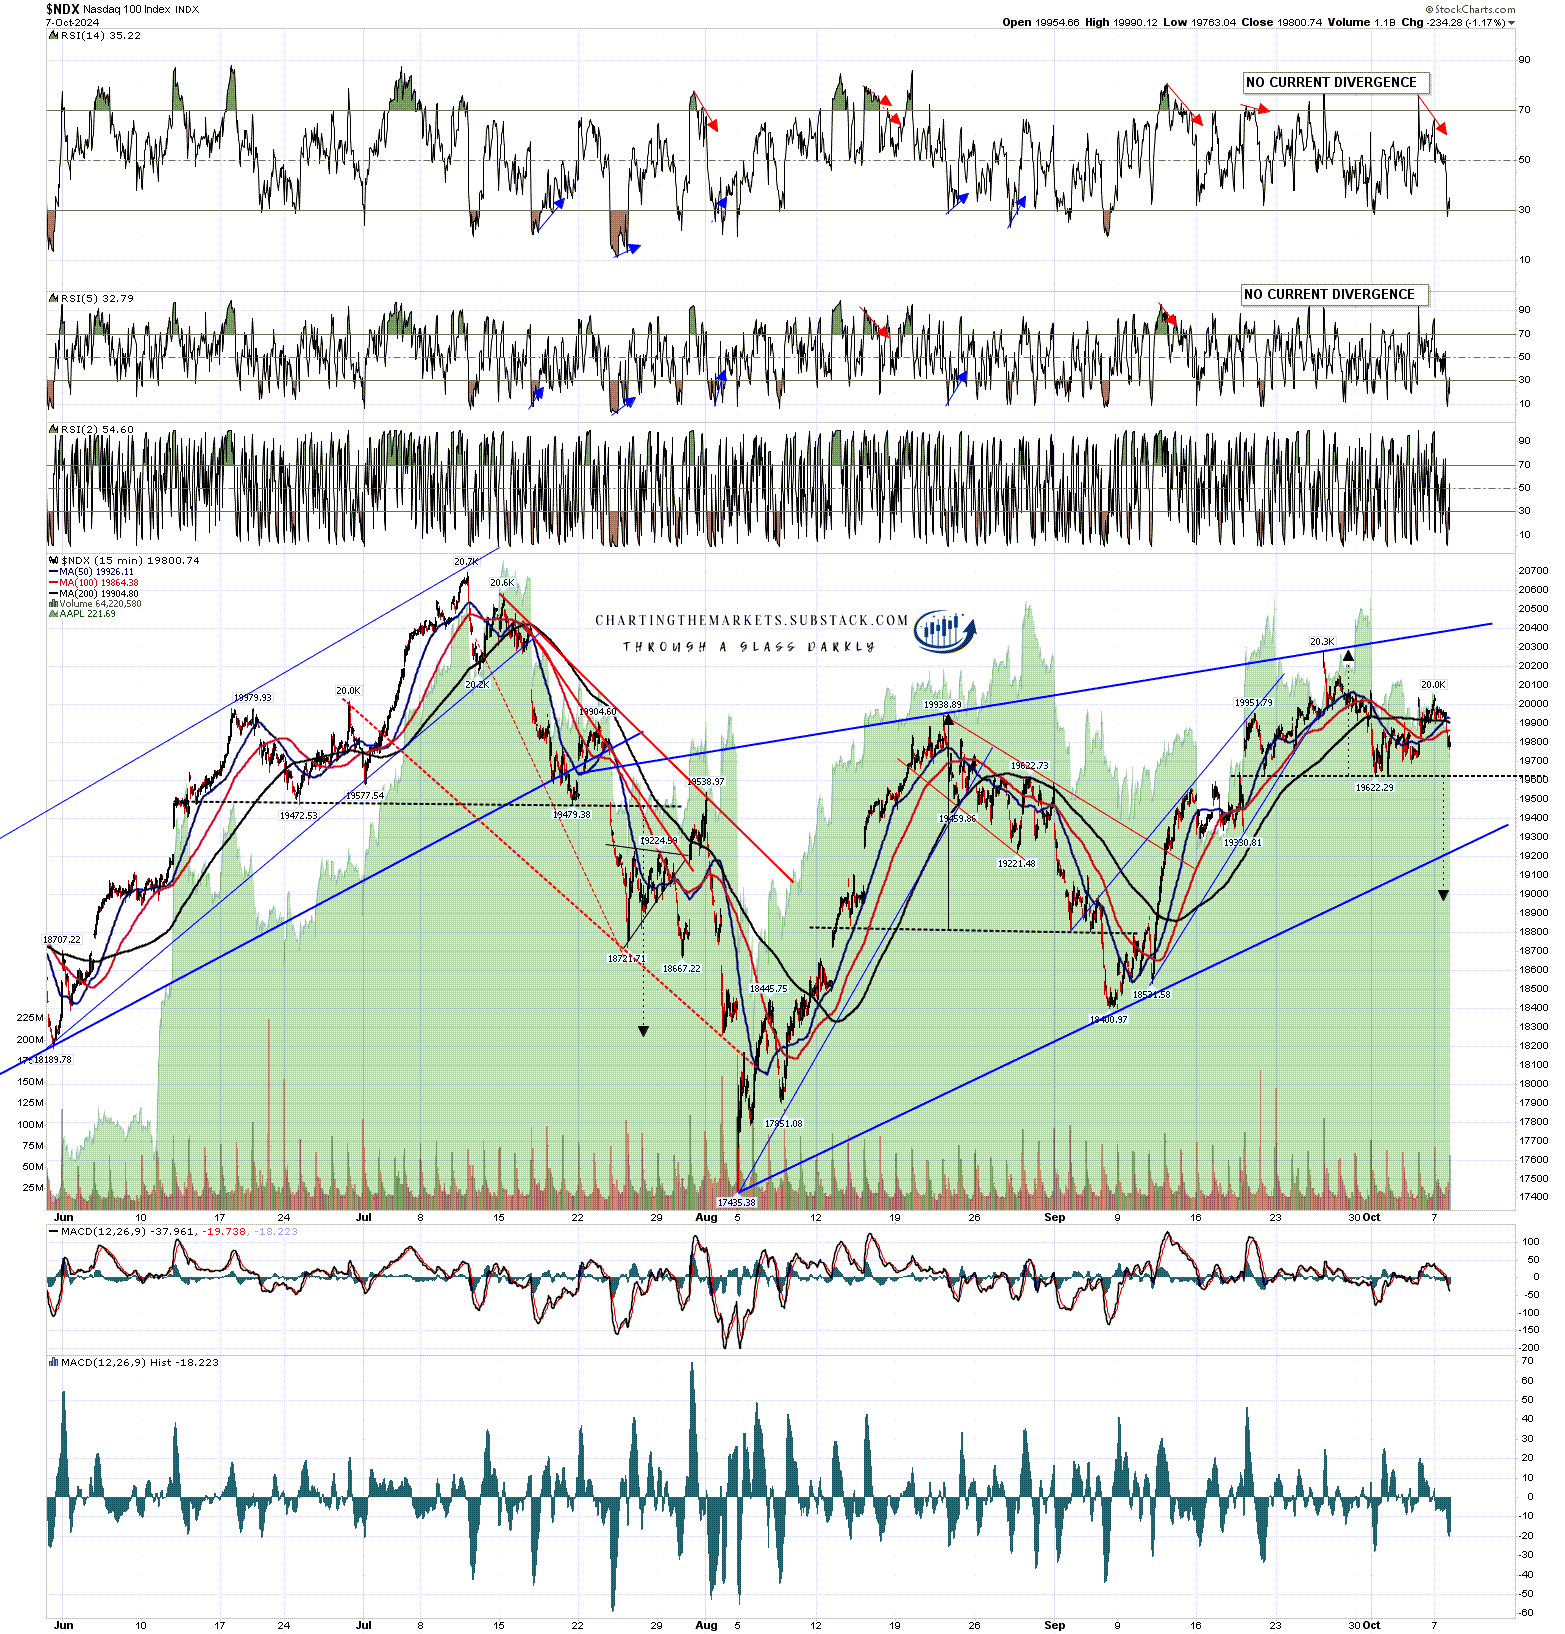
On NDX a sustained break below 19622 would have a target in the 18975 area, with obvious support on the way at rising wedge support from the August low, currently in the 19220 area.
NDX 15min chart:
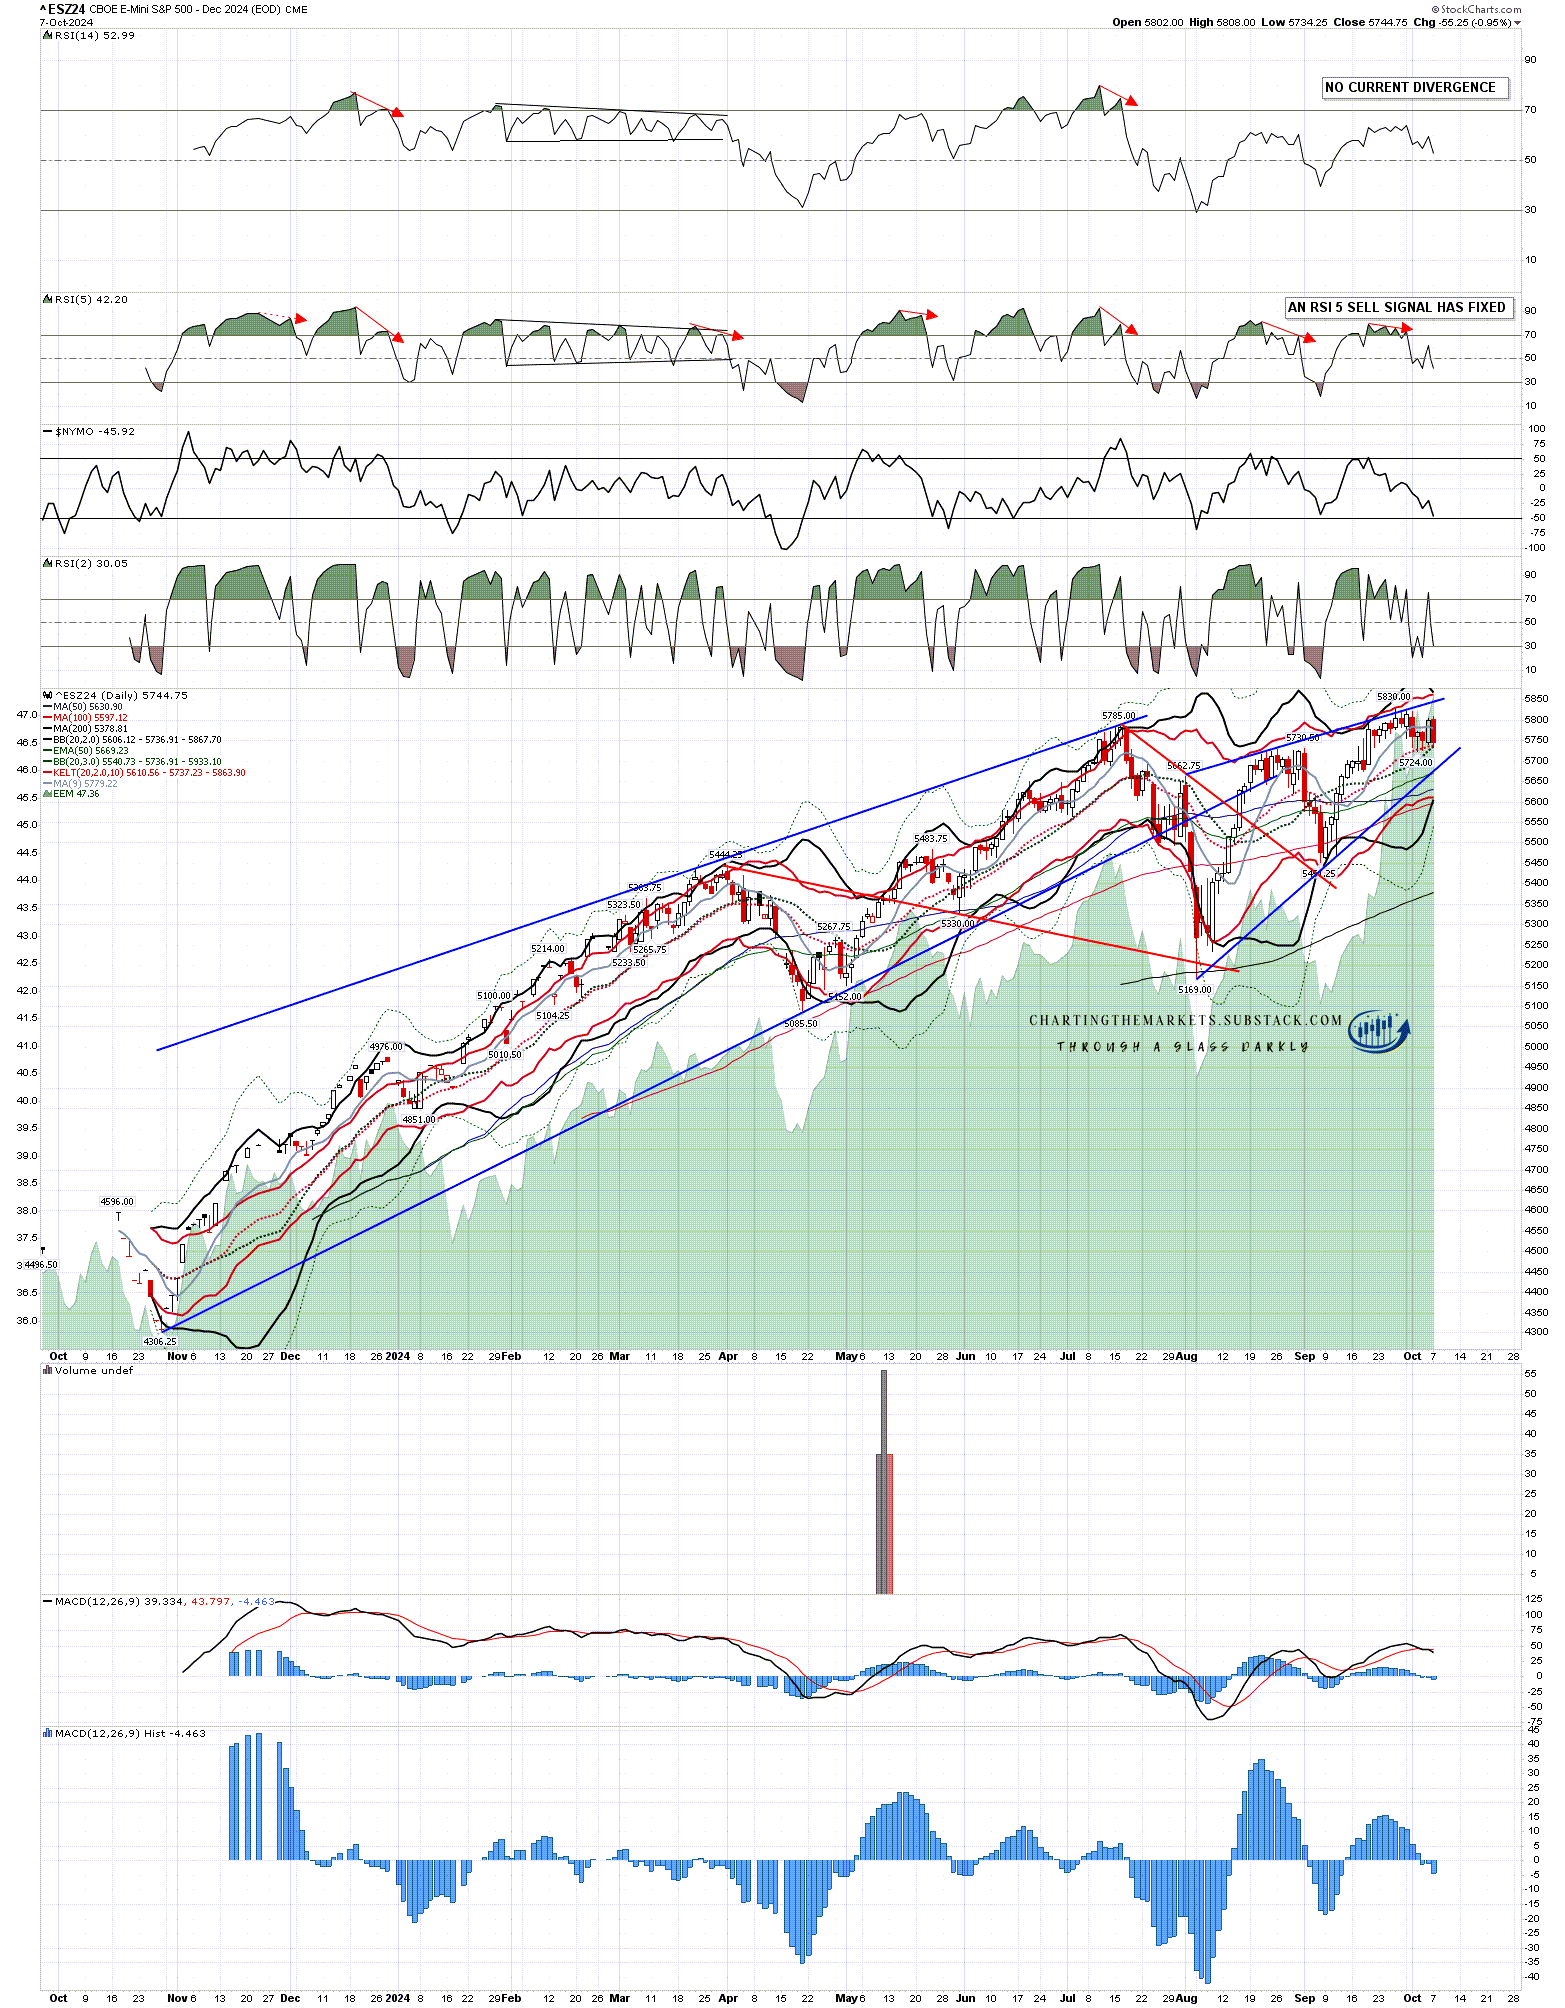
What is the key support to watch here? It is the daily middle bands of course. SPX wasn’t quite testing the daily middle band there at the lows yesterday, but it would be broken if the H&S there breaks down, and you can see on the chart below that ES tested the daily middle band at the low yesterday.
ES Dec daily daily chart:
NDX would also need a break below the daily middle band, currently at 19,699 for that H&S to break down, as would Dow, where the daily middle band, currently at 41832, was tested at the low yesterday. If we see sustained breaks below these daily middle bands today or tomorrow then all these H&S patterns and targets have a decent shot. We’ll see.
INDU daily chart:
Is there much to suggest that this might develop into a larger retracement? Not really, and since my post looking at this on 16th September the larger possible larger topping patterns have deteriorated badly while equities have gone sideways for three precious weeks of the obvious decline window into late October. Only three weeks of that remain and my expectations for further downside aren’t high. The odds and setup favor a bit more retracement and then an overall bullish lean into the end of the year.
If you like my analysis and would like to see more, please take a free subscription at my chartingthemarkets substack, where I publish these posts first and do a short premarket review every morning.
No comments:
Post a Comment