- WE'RE JUST RANDOM SPECKS OF DUST IN A TORNADO TO THE MARKETS .......
- CHARTISTS MUST PUT ALL BIAS ASIDE AND LET THE CHARTS DO THE TALKING OR WE'LL SEE ONLY WHAT WE WANT TO SEE
- This blog has a copy of all header posts that I publish anywhere, so that those interested in seeing what my thoughts are on the markets can find them easily.
- I will be answering questions and responding to comments, so feel free to respond to any posts and I will see your comment even if it is not on the most recent post.
- If you're interested in seeing any intraday charts I post, I do that on twitter, and my twitter handle is @shjackcharts.
- The charts in the posts are as large as I can practically make them. if you would like to look at one more closely, click on it, and the link will take you to a larger version at screencast. If you click on that again, you will get a full page version, and can use the resizing function on your browser to enlarge parts of interest further.

Friday, 23 May 2025

Holiday Spirits

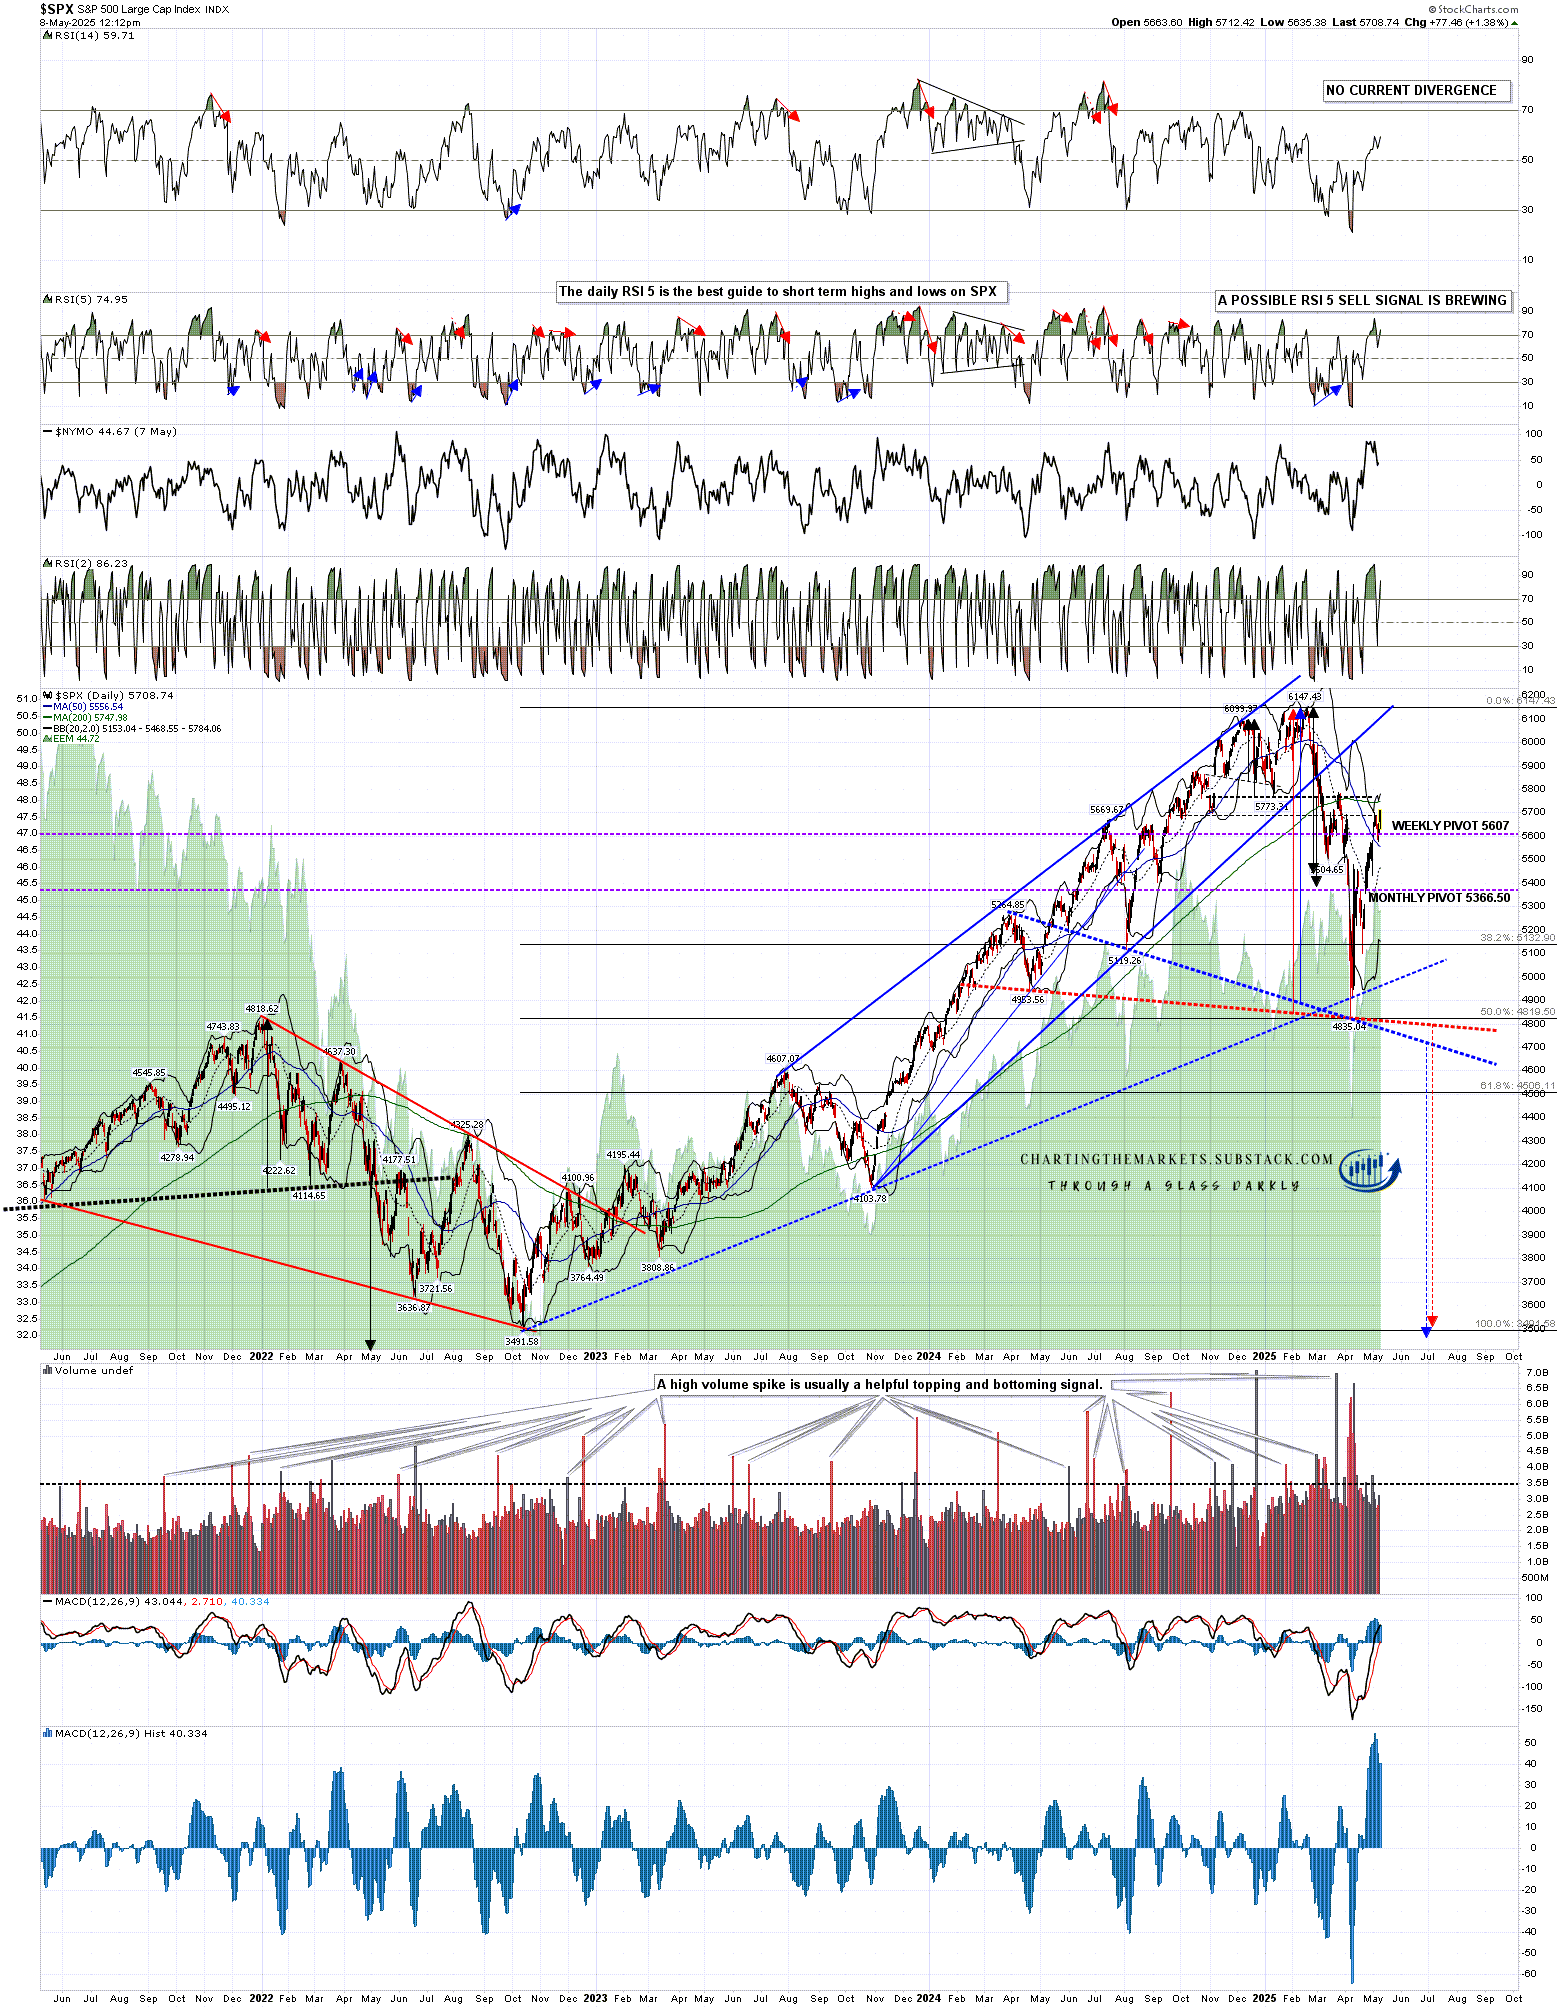
In my post a week ago on Friday 16th May I was looking at the break over 90 on the SPX daily RSI 5 and noted that history suggested that would likely be followed with a consolidation or retracement lasting for two weeks. I also suggested that an ideal retracement target would be a backtest of the 200dma that was broken hard at the start of last week.

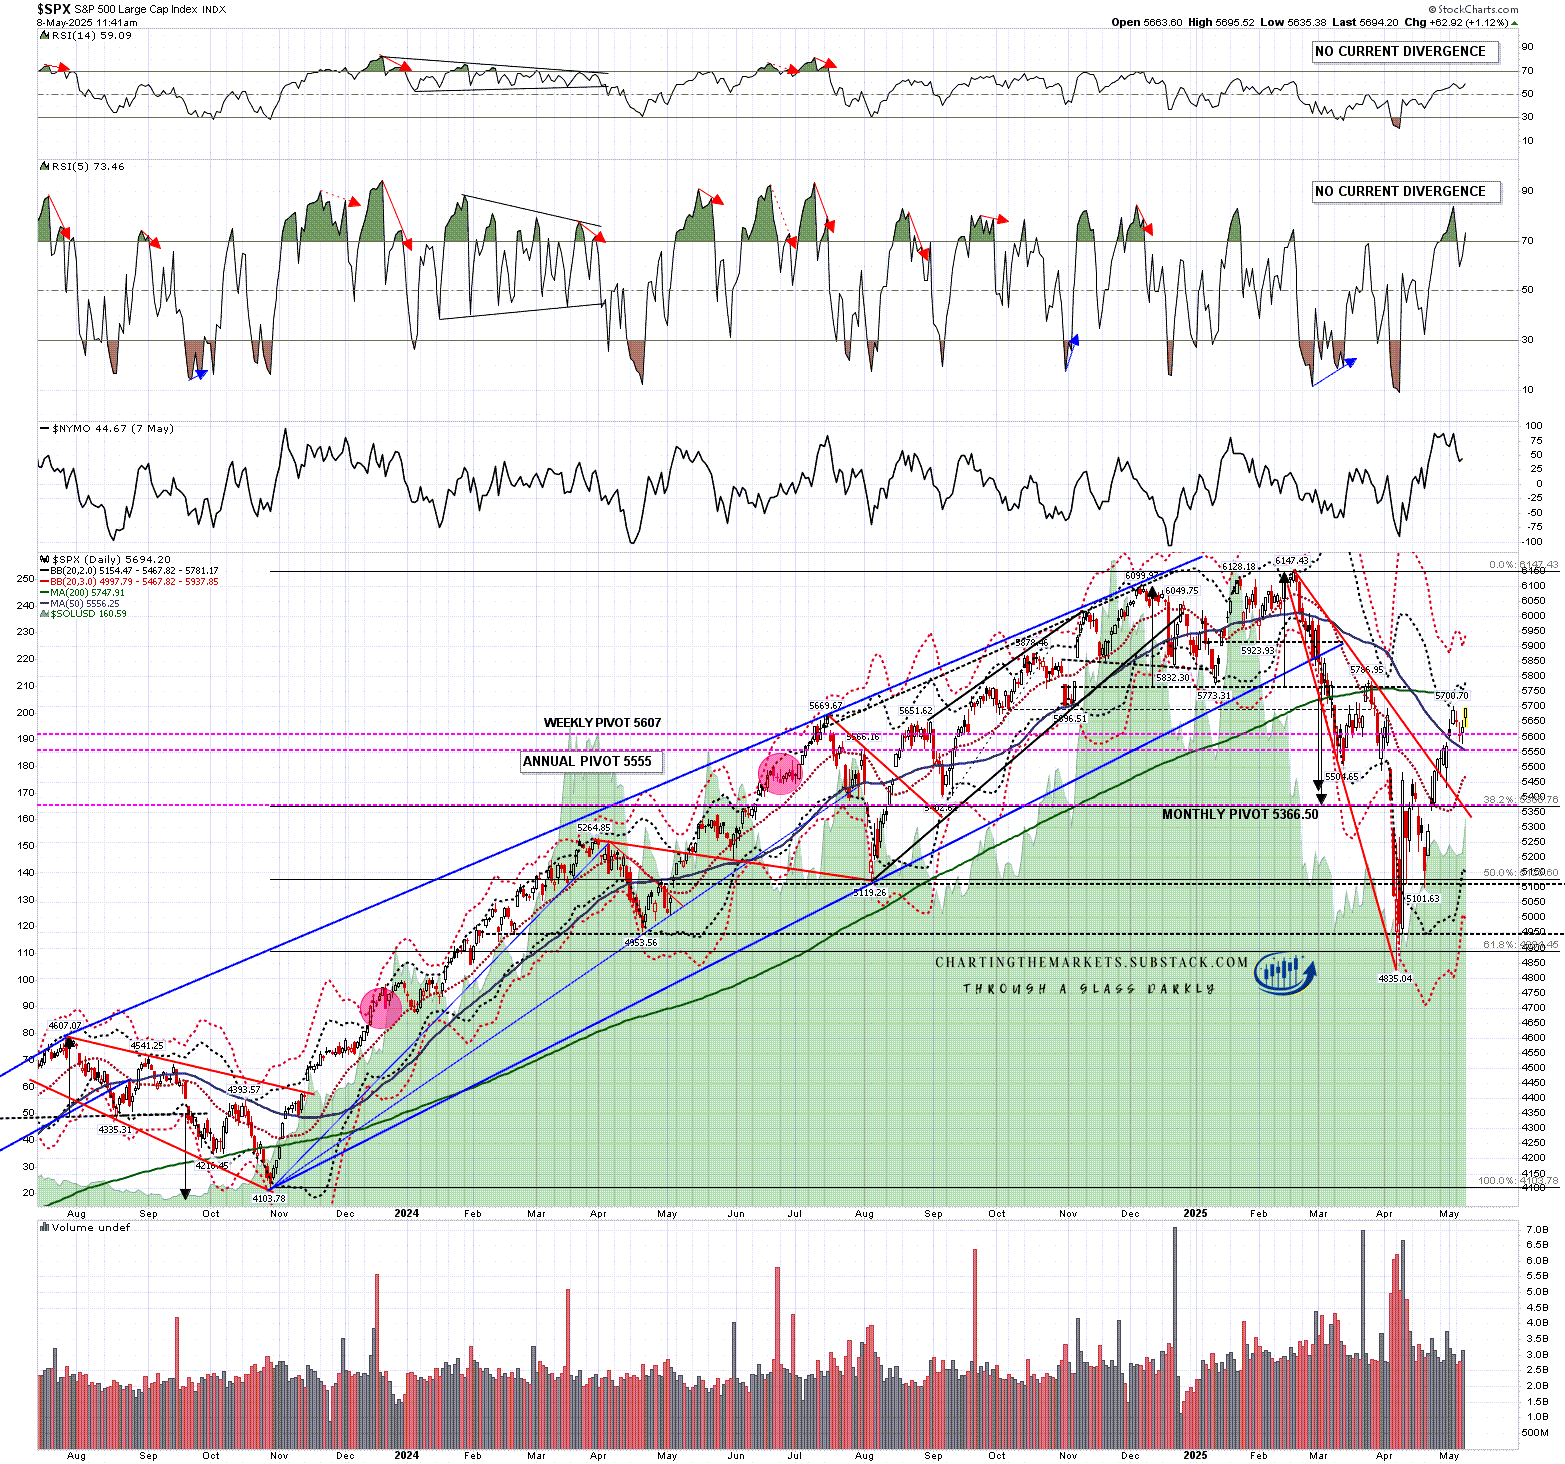
With the decline since then culminating this morning (so far) in the backtest of the SPX 200dma at 5773, with the low today at 5667, that’s looking pretty good and this is also the obvious area to find support so this is a candidate low for this retracement.

What next? Well the obvious next step would be retests of the all time highs on SPX and QQQ, and ideally DIA as well, though that looks like more of a stretch. Historically this would be a very good time to see this happen as three days in each of the next three weeks lean conspicuously bullish. Even setting aside the fact that there are only four trading days next week that is a strong bullish lean, and looks like the ideal time to see these high retests.

Trump didn’t really help the market’s mood this morning when he announced that he is planning to imposed 50% tariffs across the board on the EU on 1st June, but it seems that the markets have decided so far to worry about that if it actually ever happens. We’ll see.

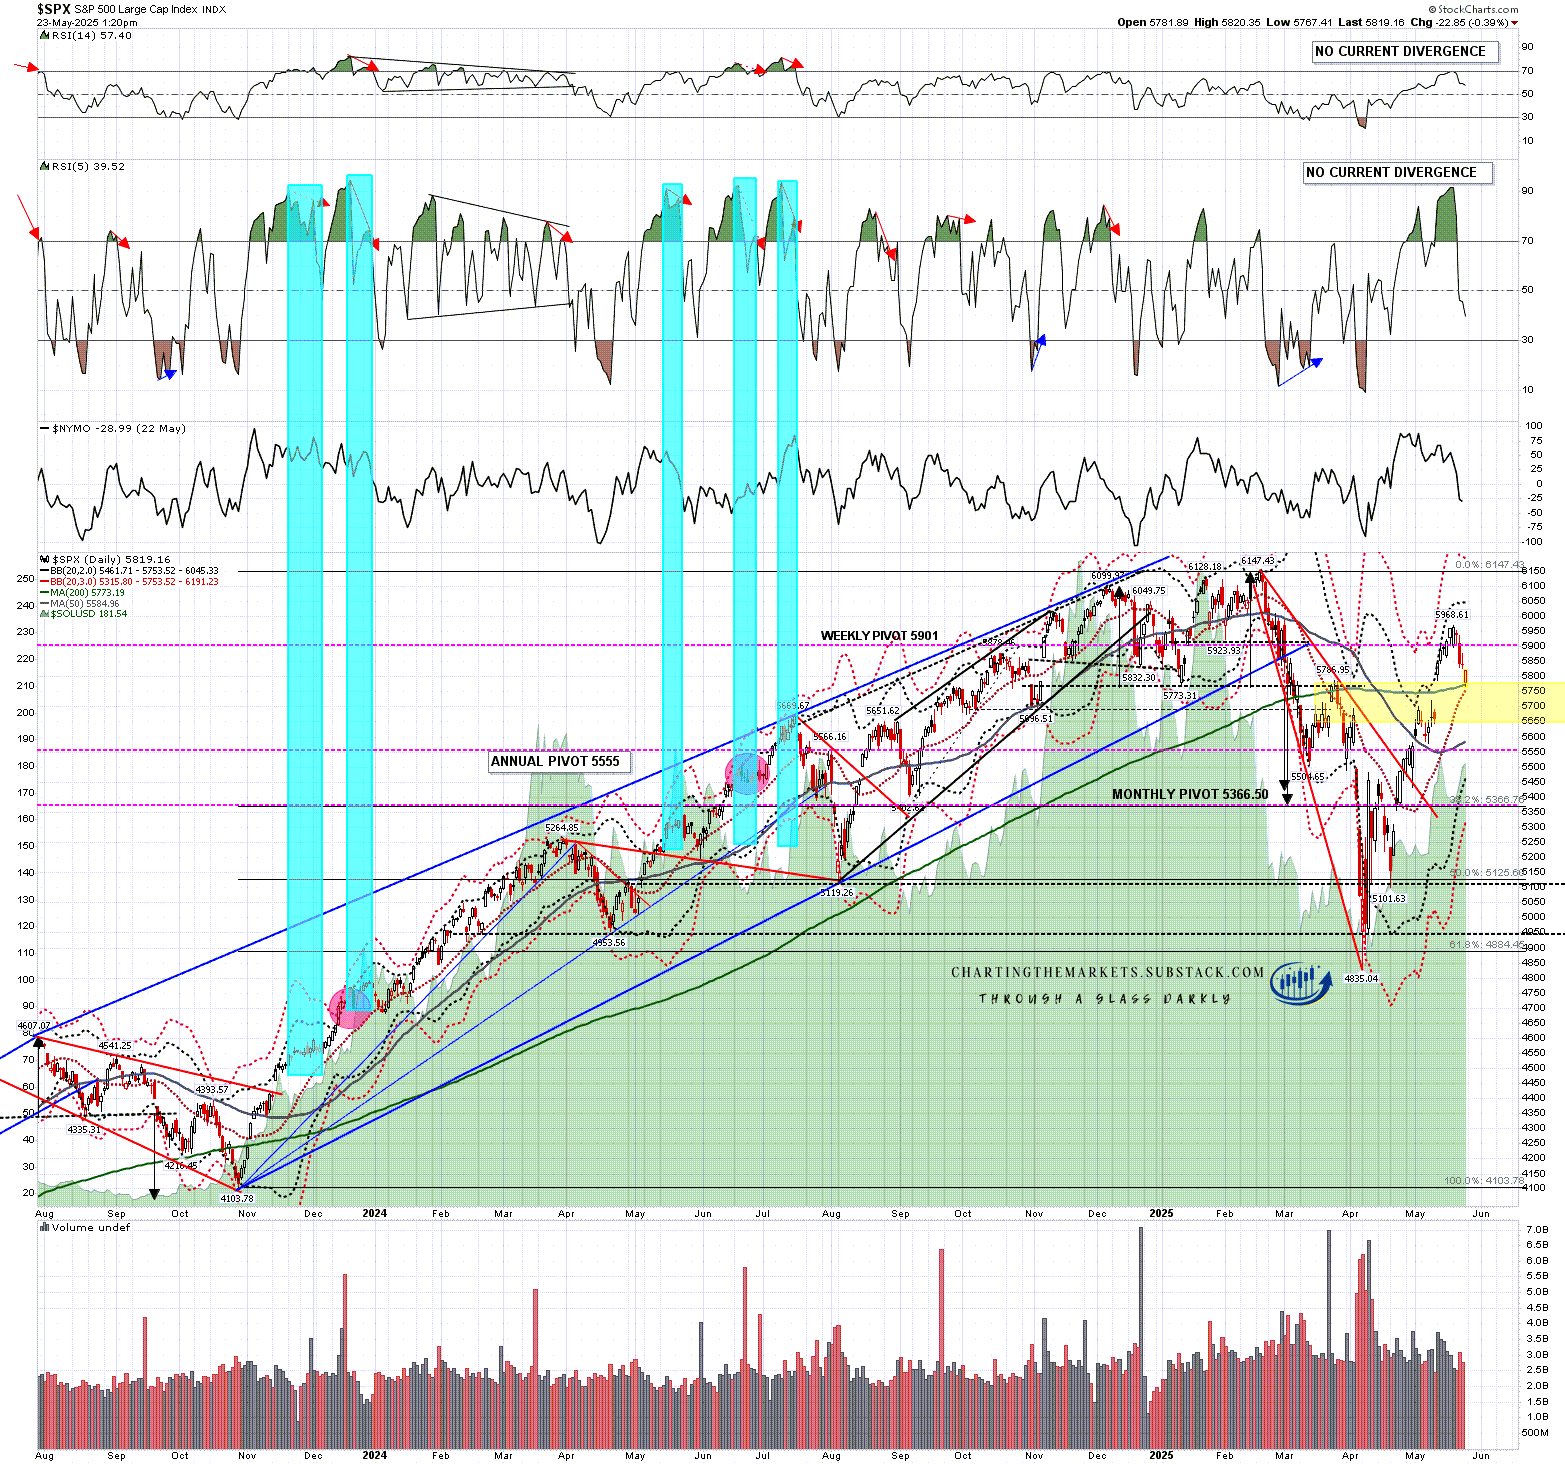
Looking at the SPX daily chart the retrace was a bit faster and sharper than I was really expecting, so the daily RSI 5 fell well below 50, but that was a lovely backtest of the 200dma this morning. The hourly RSI 14 sell signal on QQQ that had fixed when I wrote my last post, and the two on SPX and IWM that fixed after I wrote that post have also now all reached target.

I really like this area for a retracement low, news permitting, particularly as the daily middle band is currently just 20 handles below the 200dma so this area is double support. This area is also breakaway gap support that I would expect to hold without a gap fill until this move up has ended, which doesn’t currently seem likely to have happened already.

SPX daily chart:

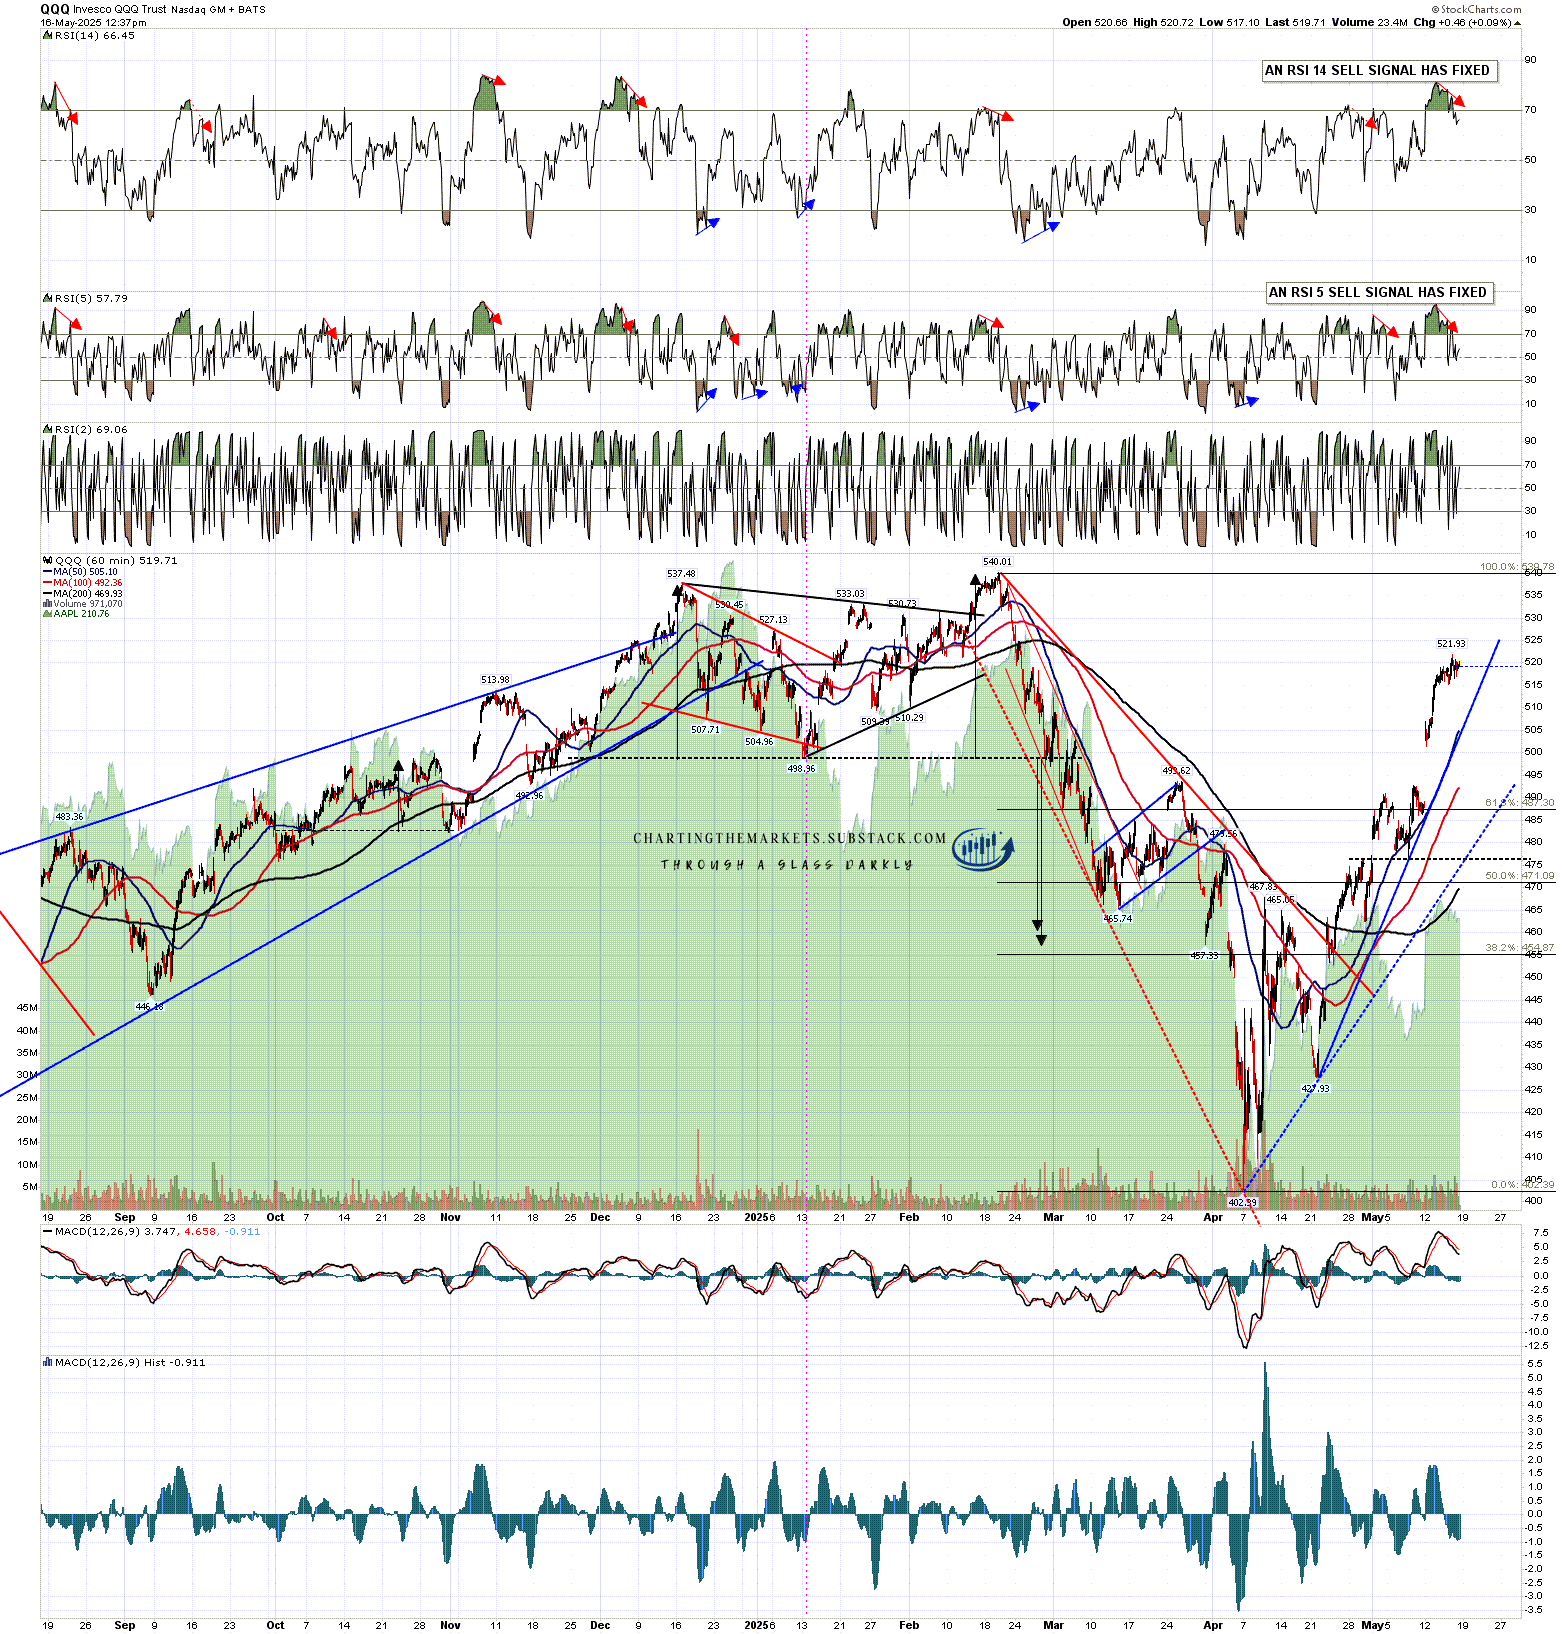
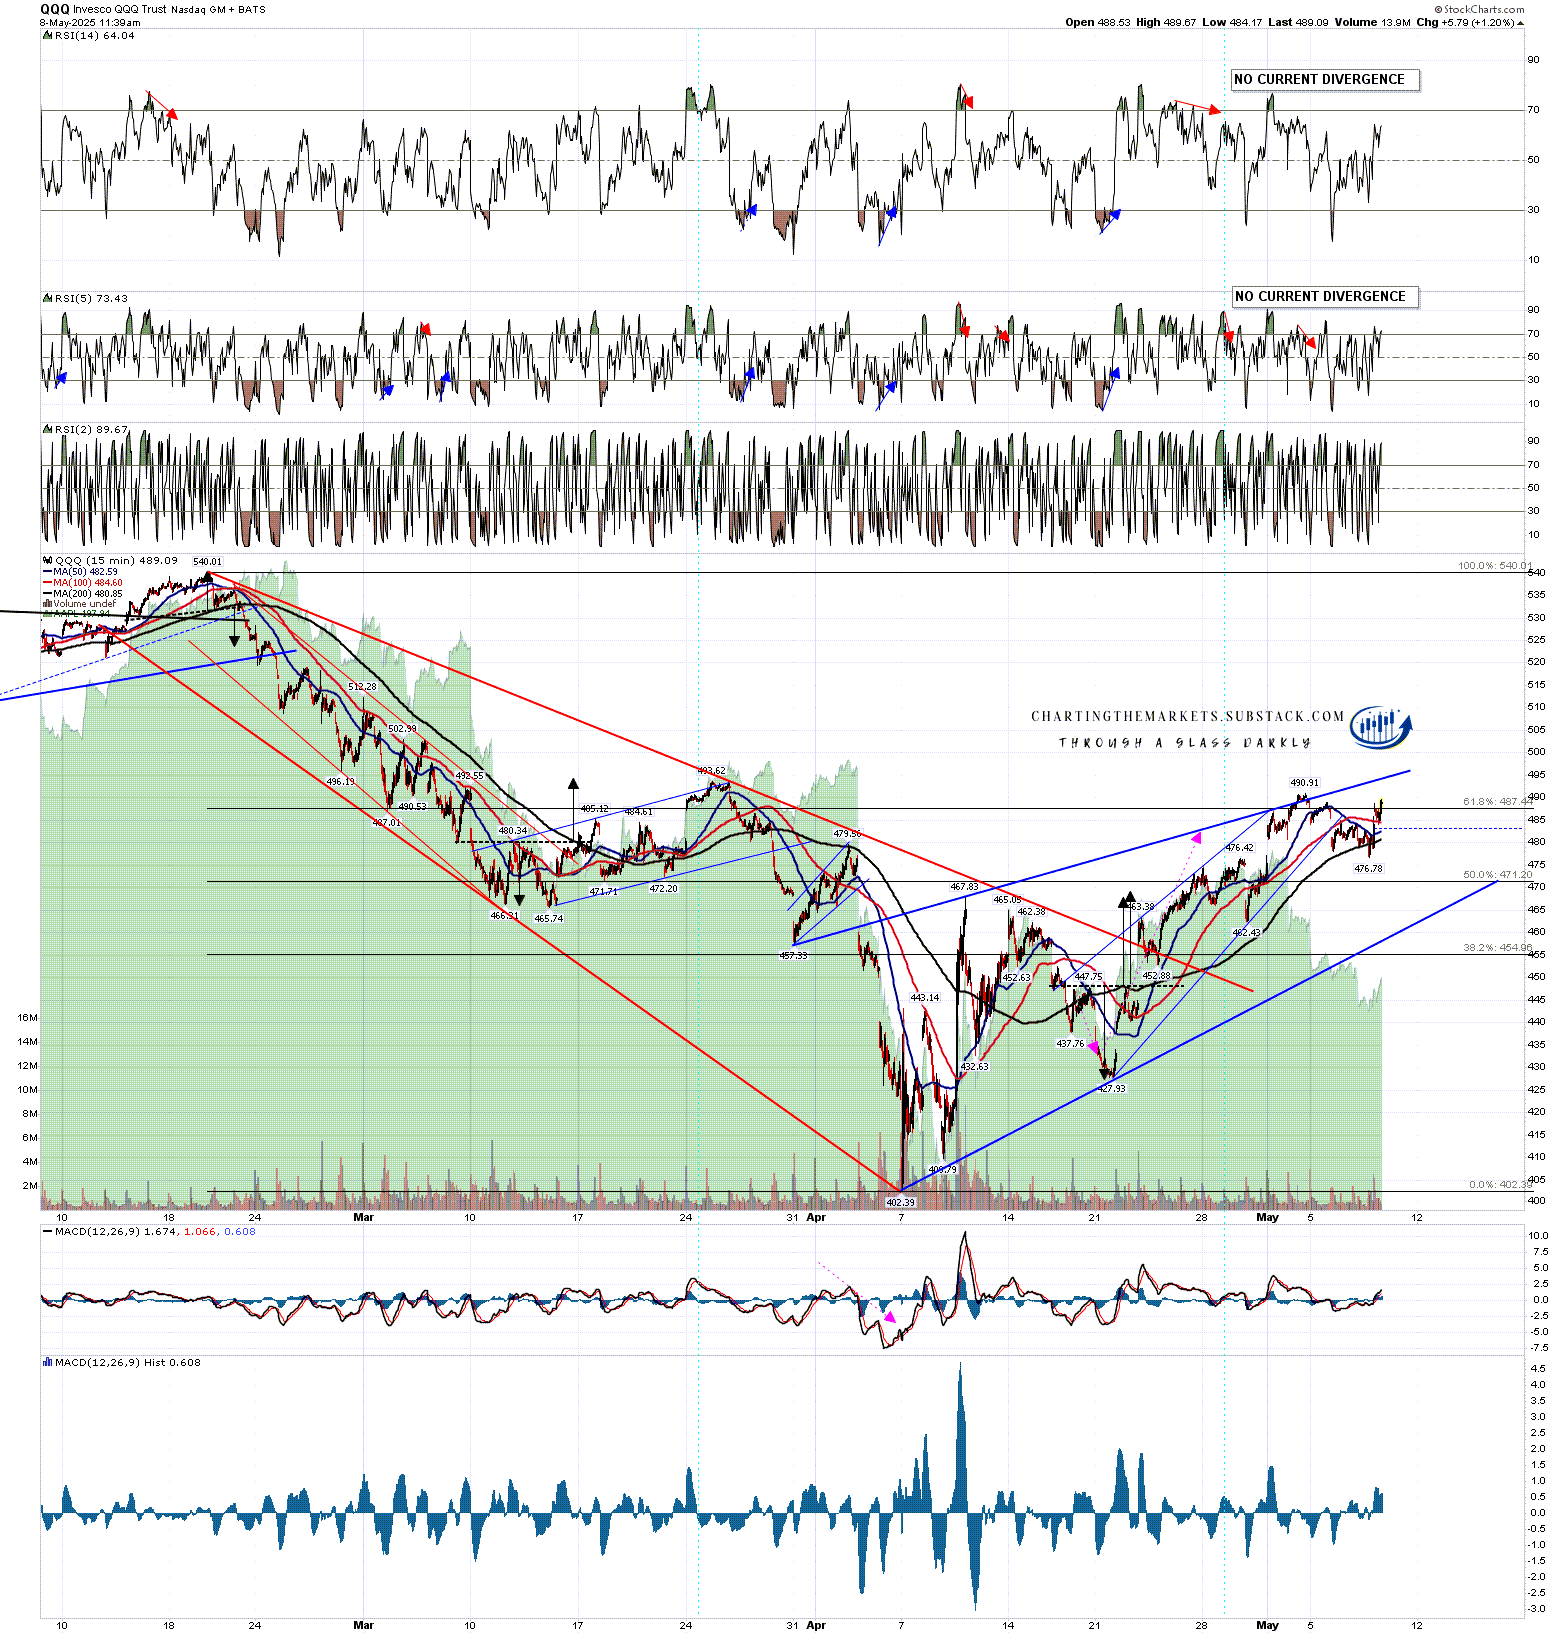
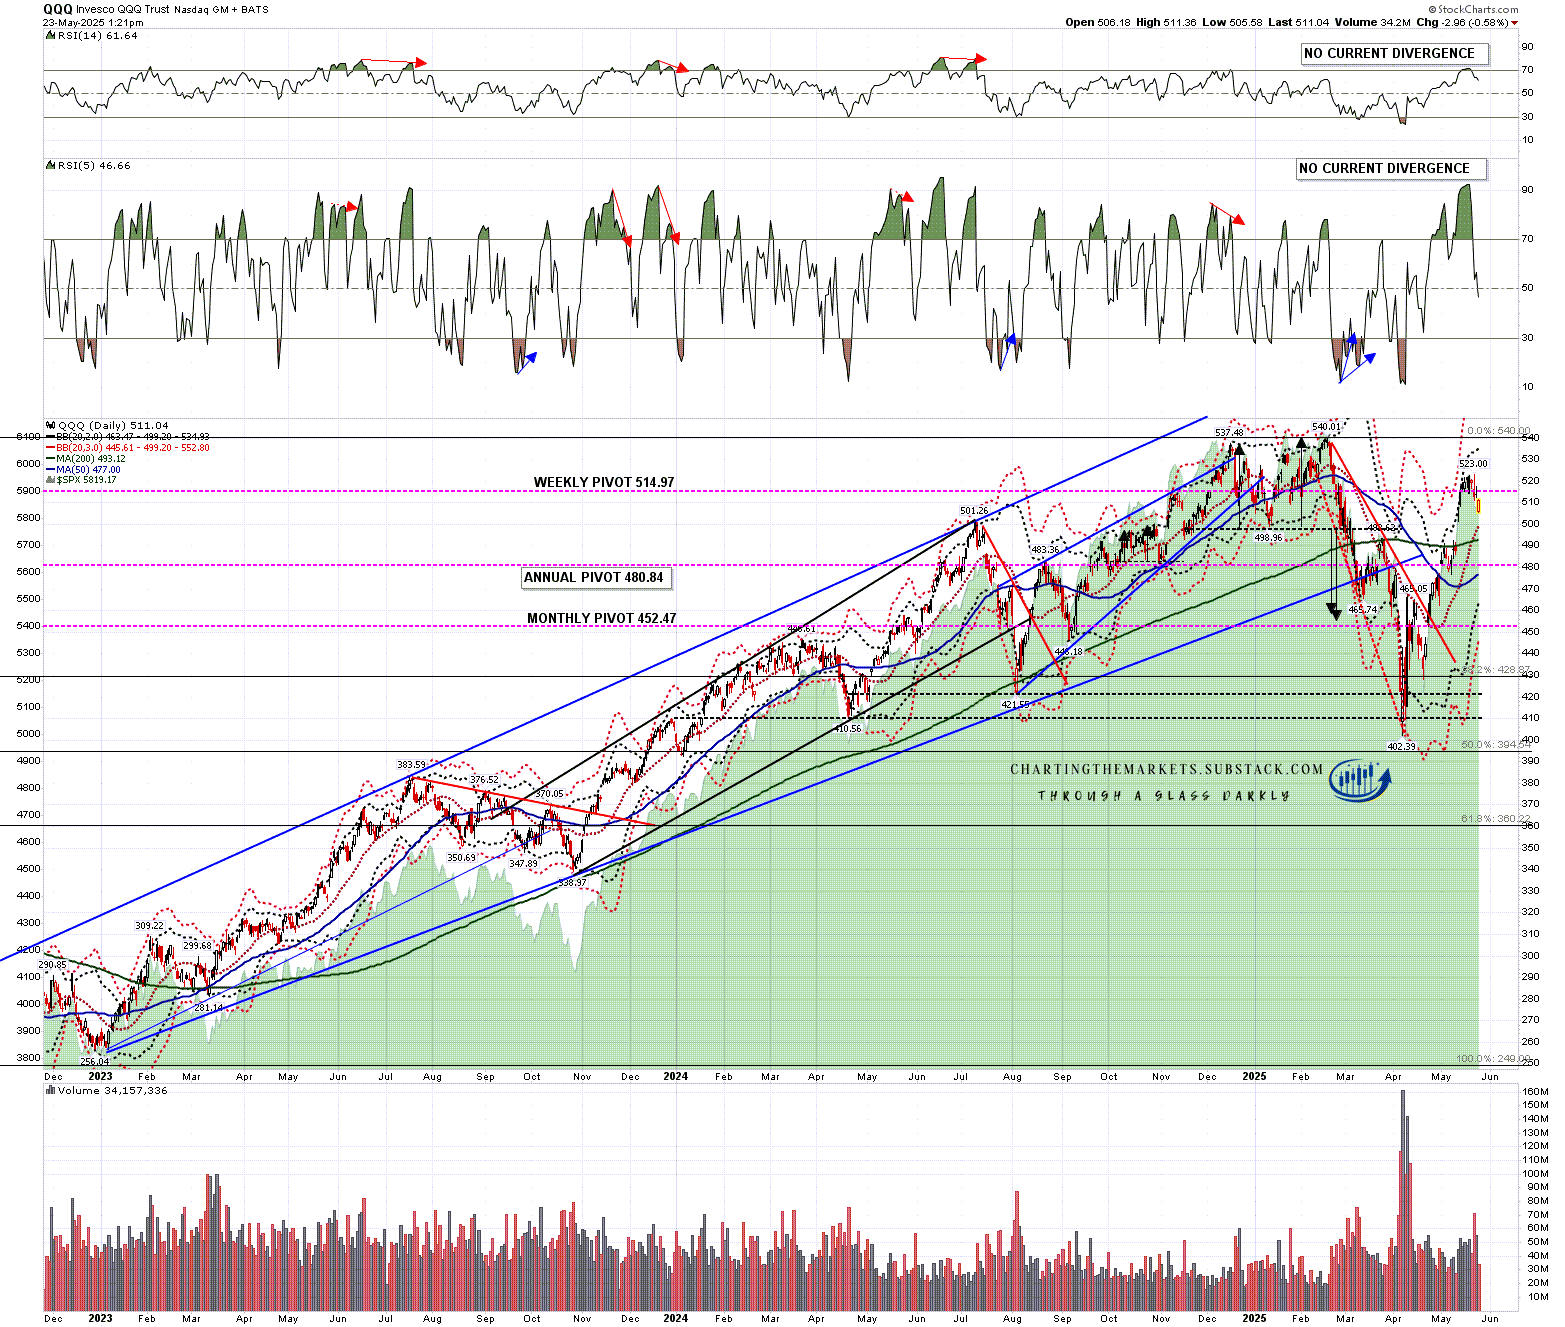
QQQ has held up the best in the last week but also delivered a decent little retracement, without the current low having hit anything significant.

QQQ daily chart:

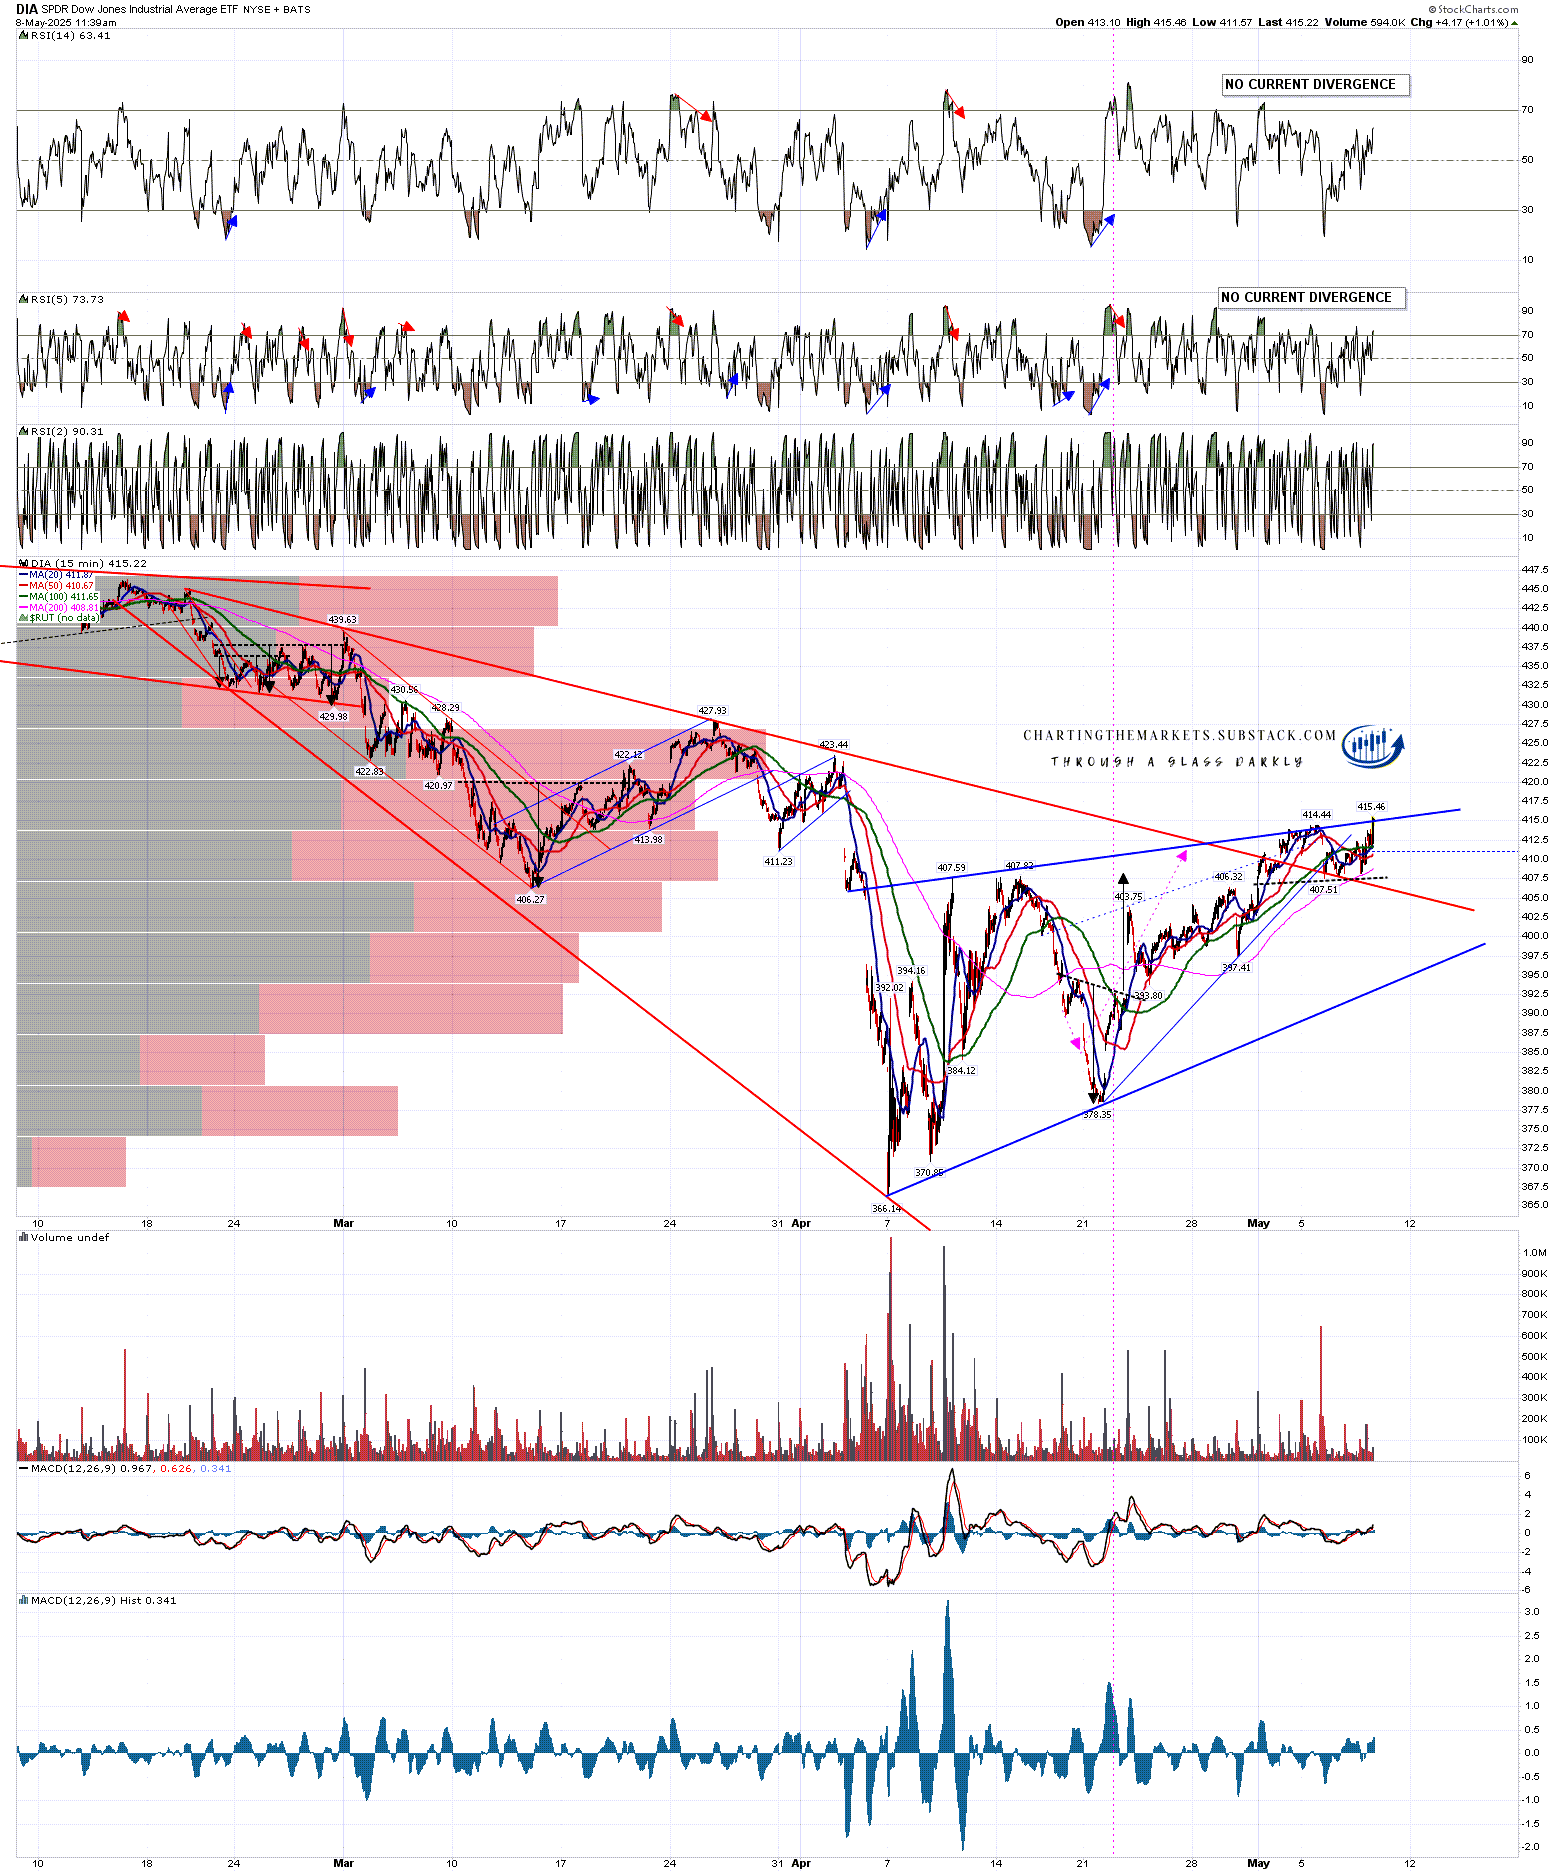
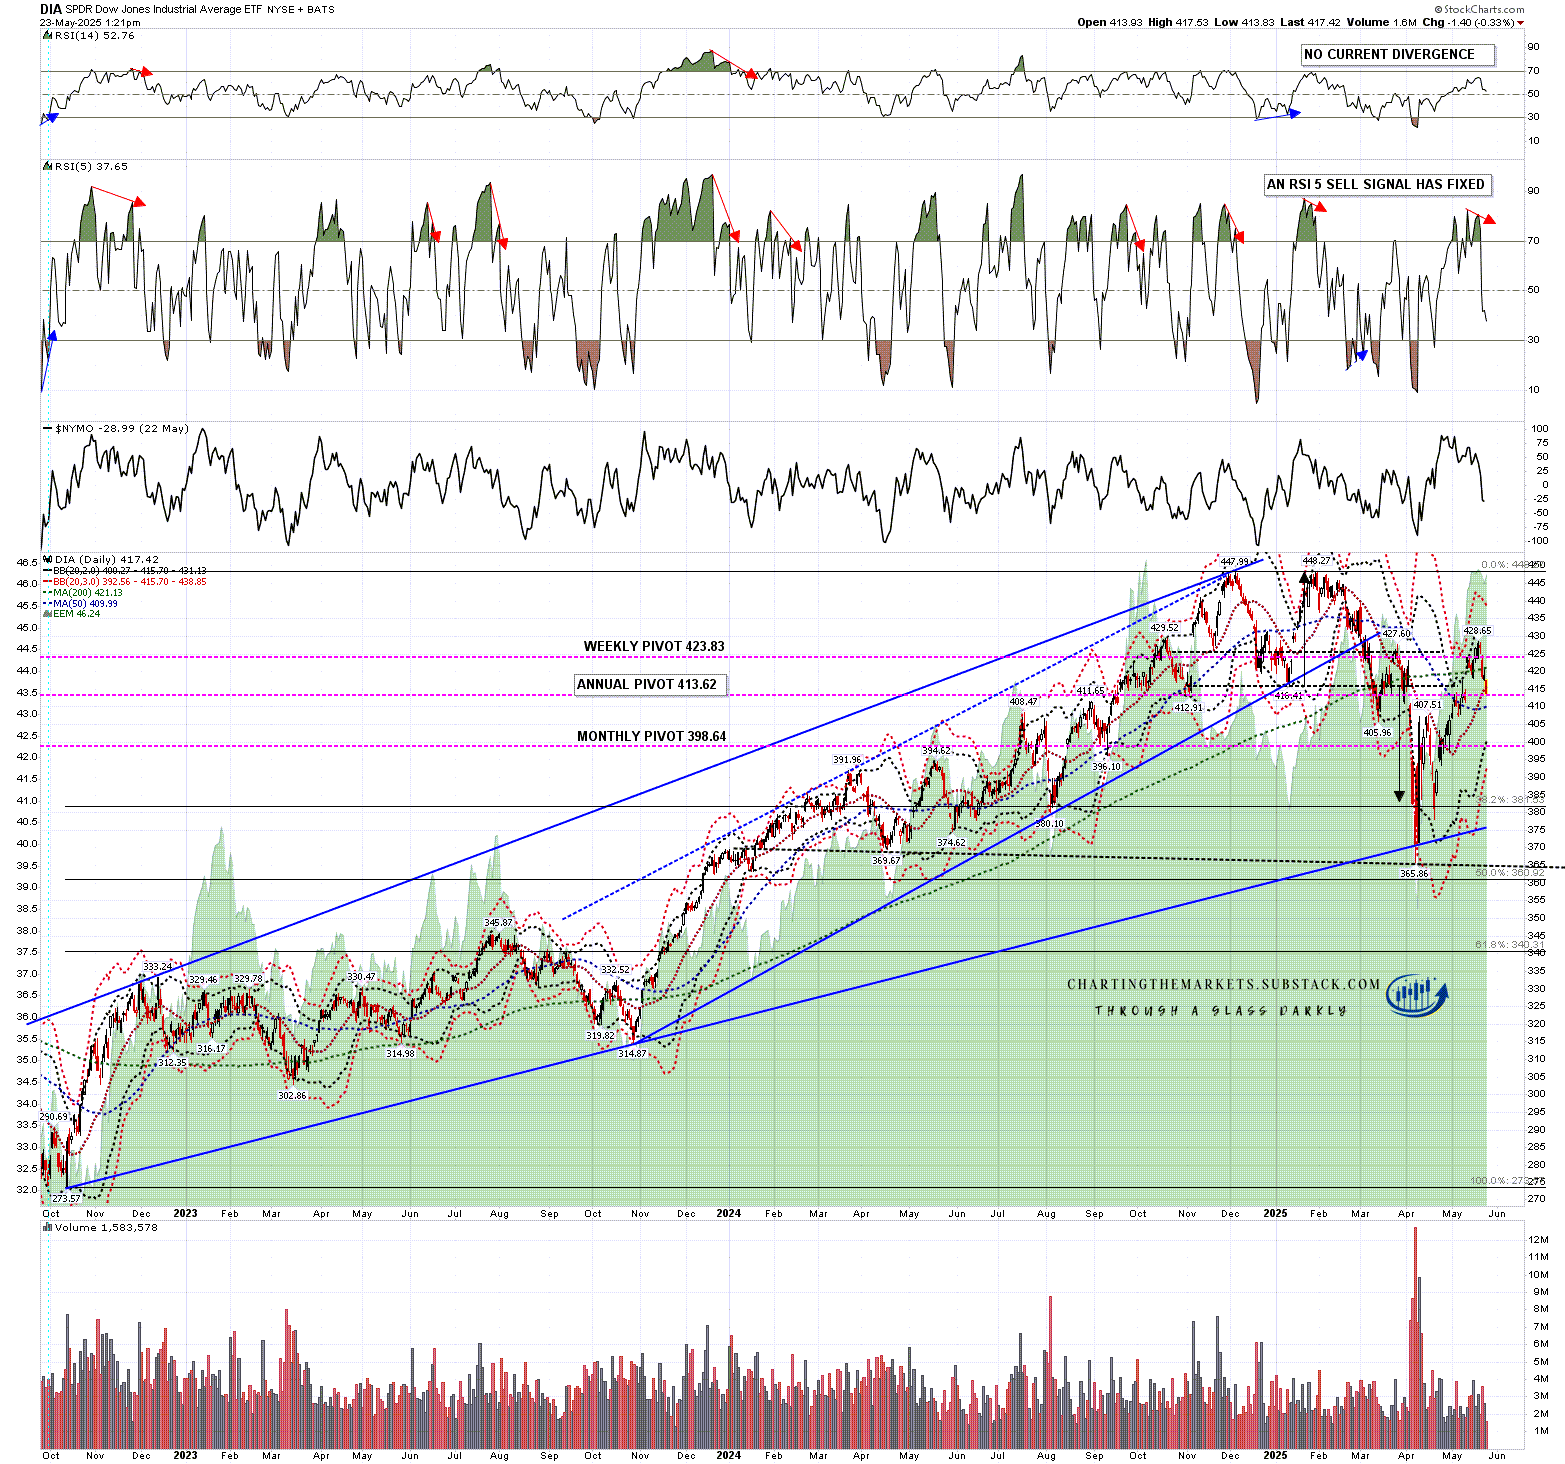
DIA has backtested the daily middle band and if it heads a little lower the 50dma is currently in the 410 area. There is some reason to think it might need to go a little lower, as there is a fixed daily RSI 5 sell signal from this last high and it hasn’t reached target yet.

DIA daily chart:

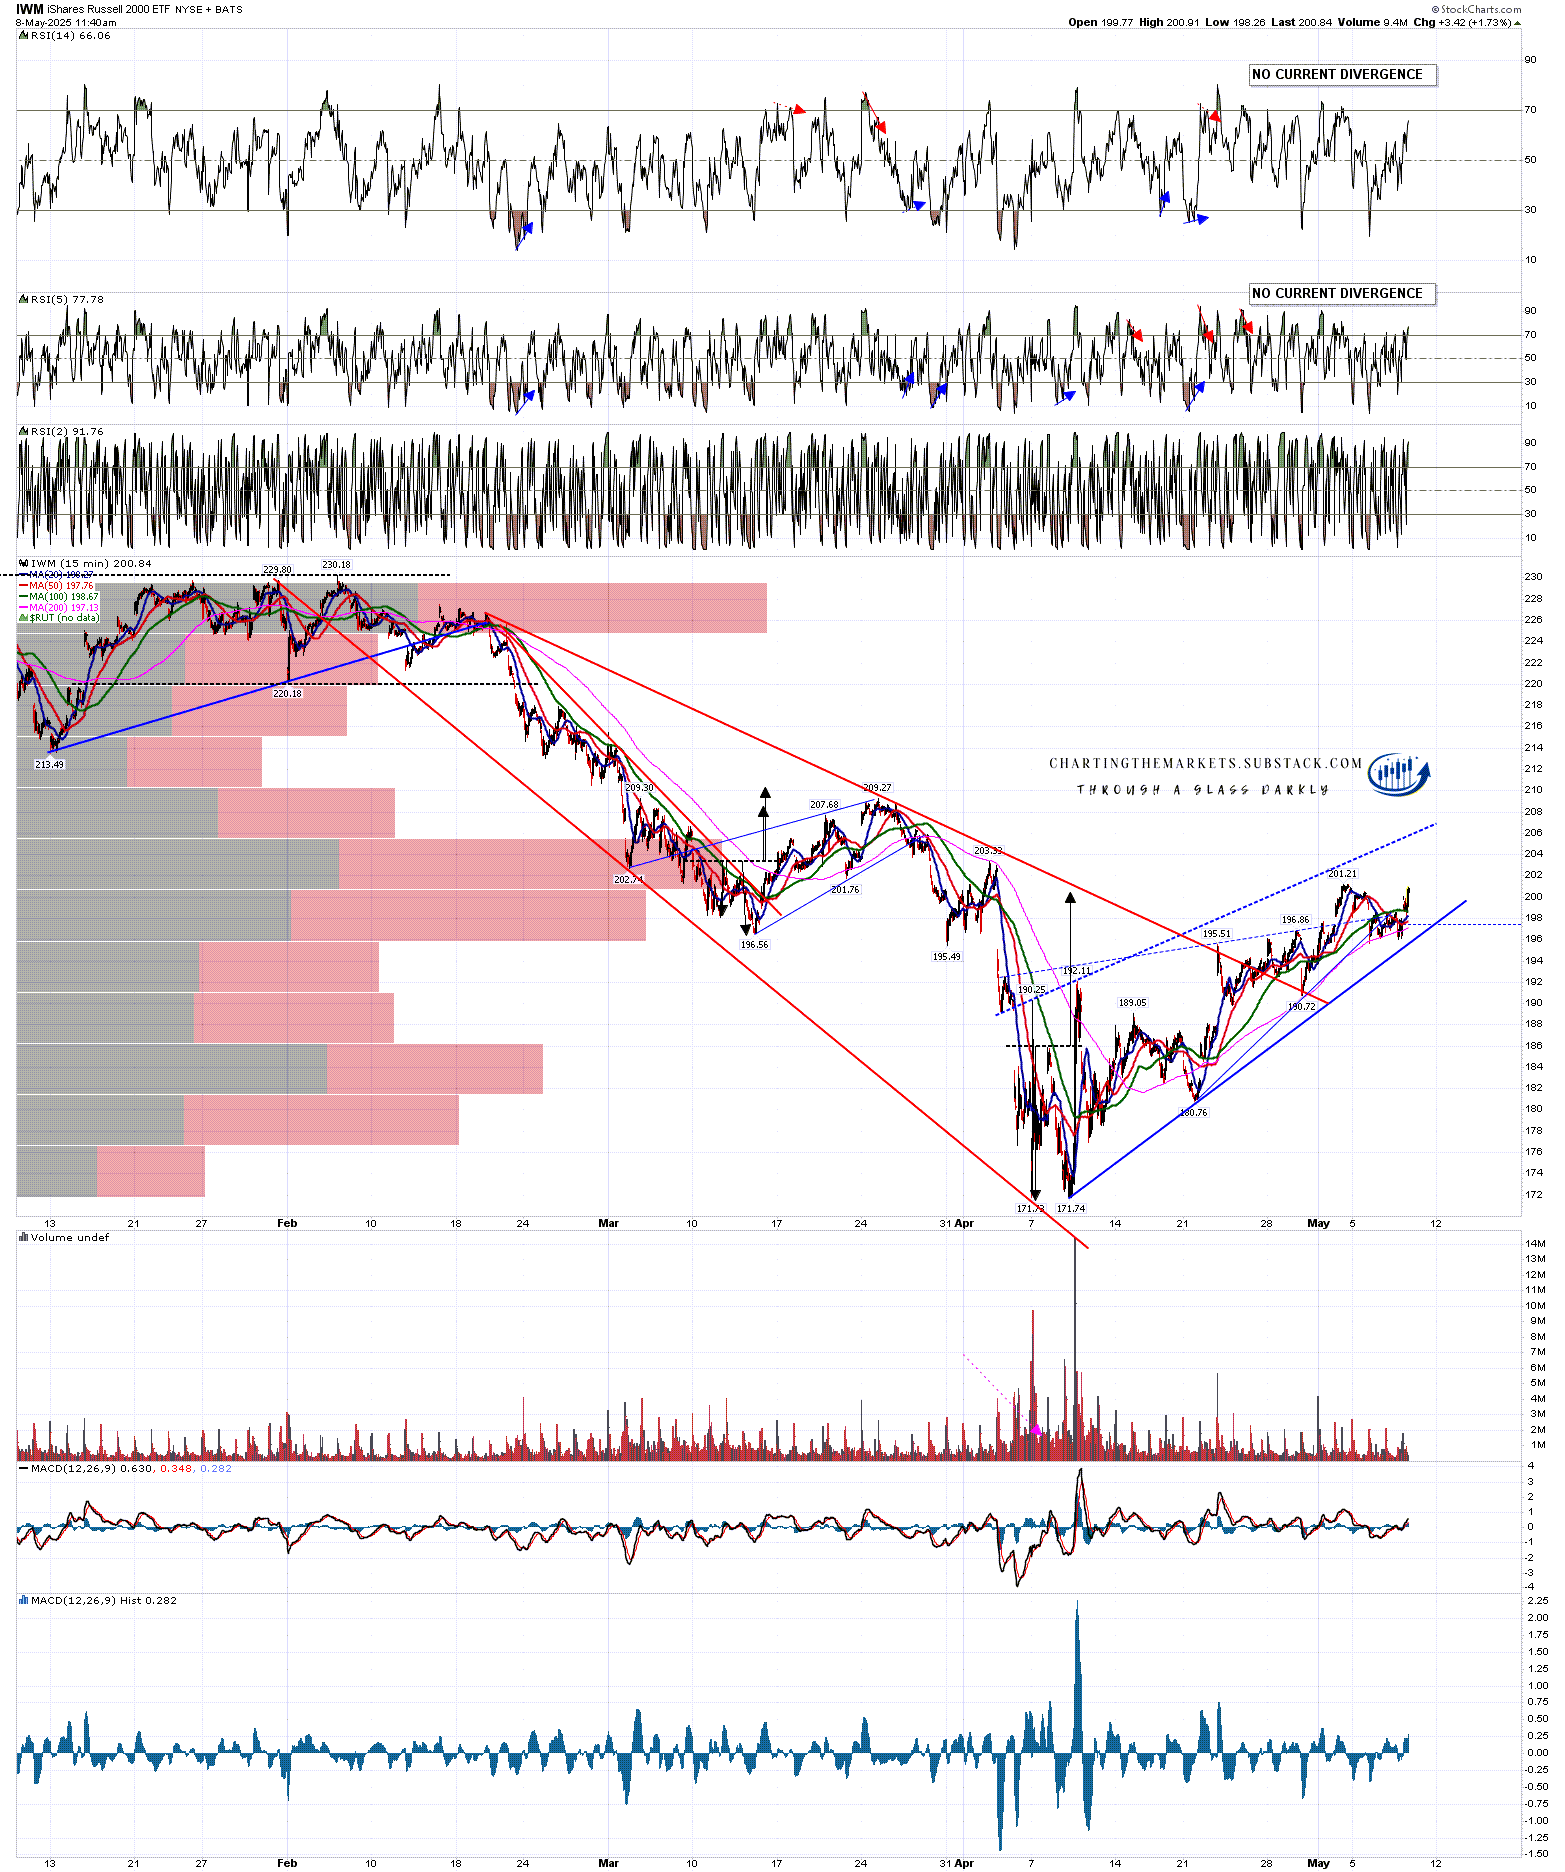
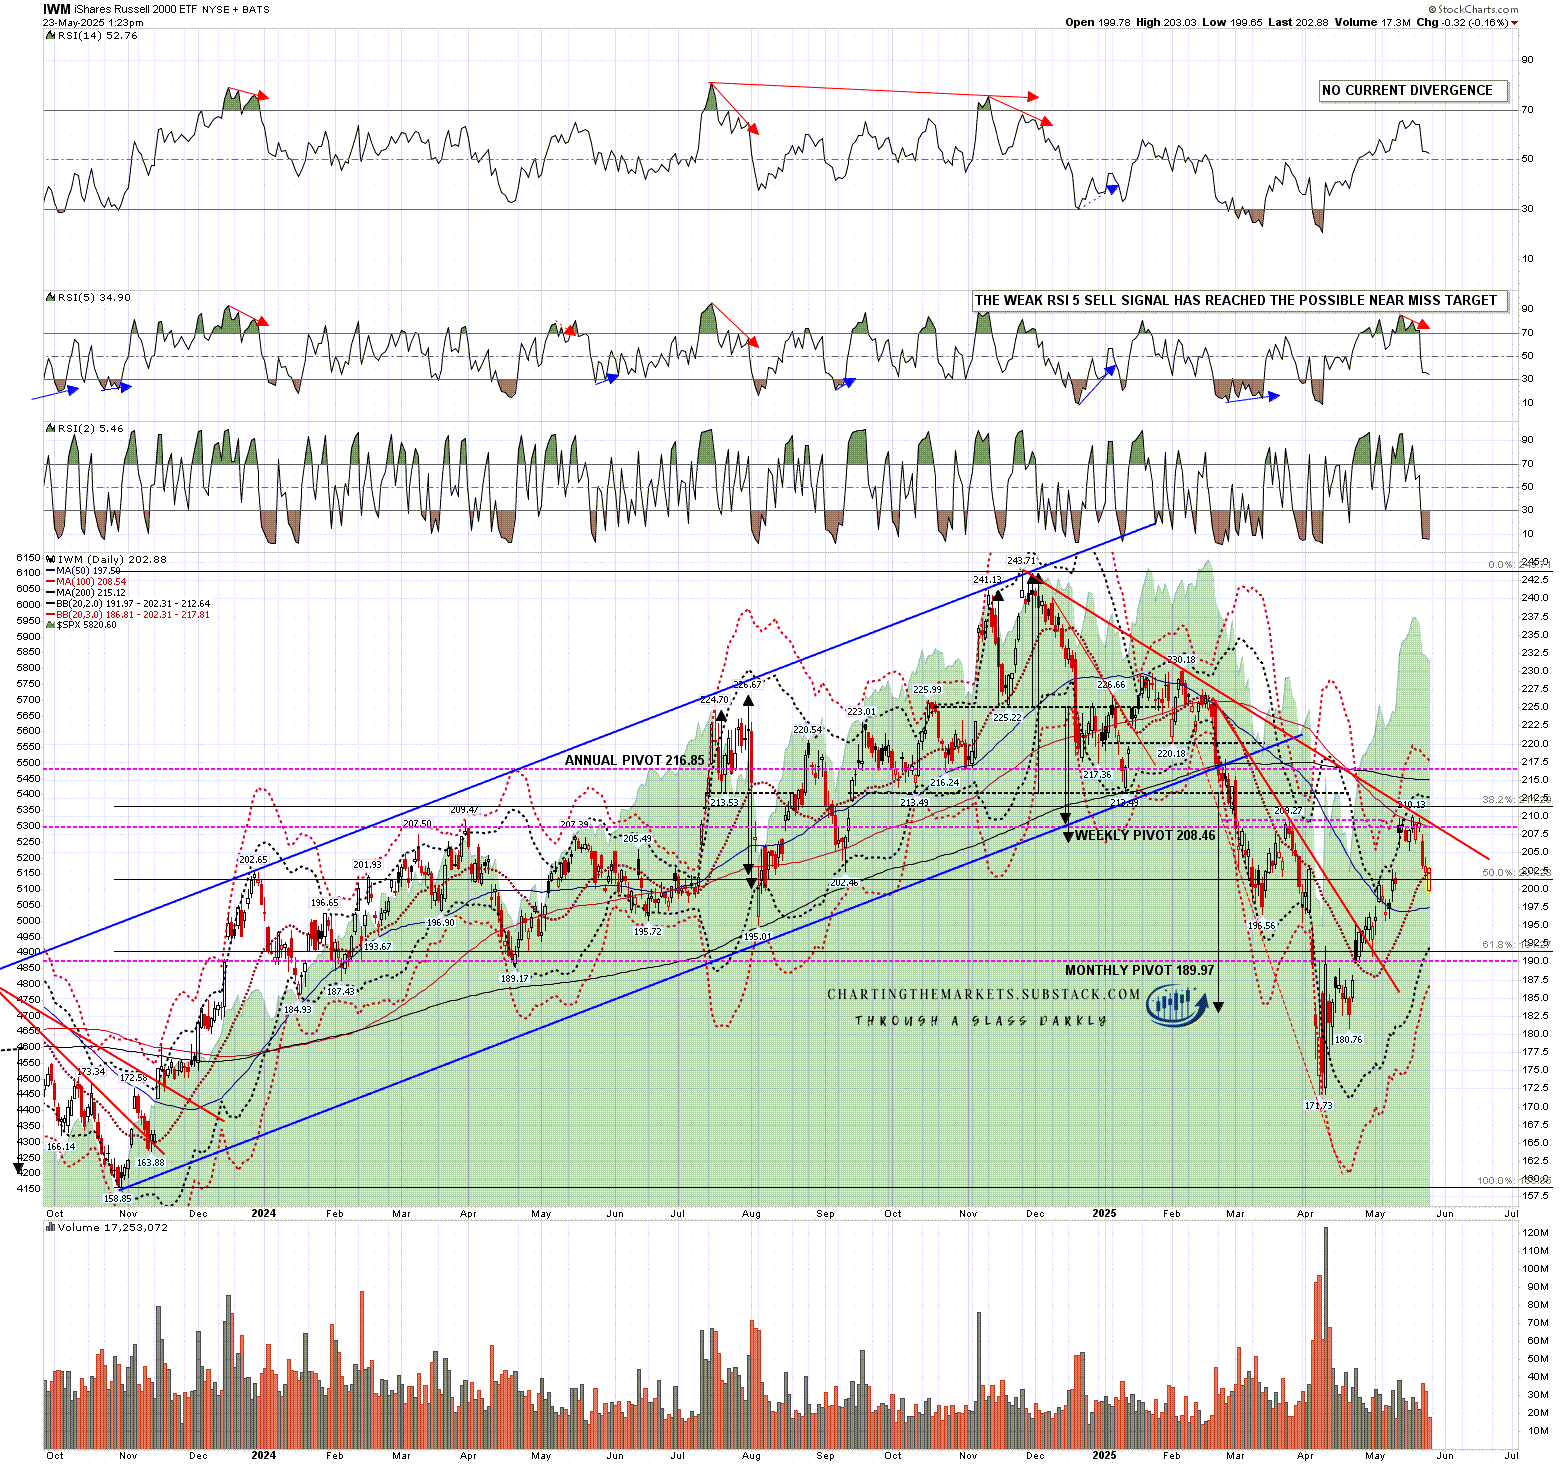
IWM also had a (weak) daily RSI 5 sell signal fix from the last high but that has already reached the possible near miss target. This has been a hard backtest of the daily middle band which has held so far on a daily closing basis. IWM has been the weakest this week, which is to be expected as there have been issues in the bond markets and IWM are the index most vulnerable to higher interest rates.

IWM daily chart:

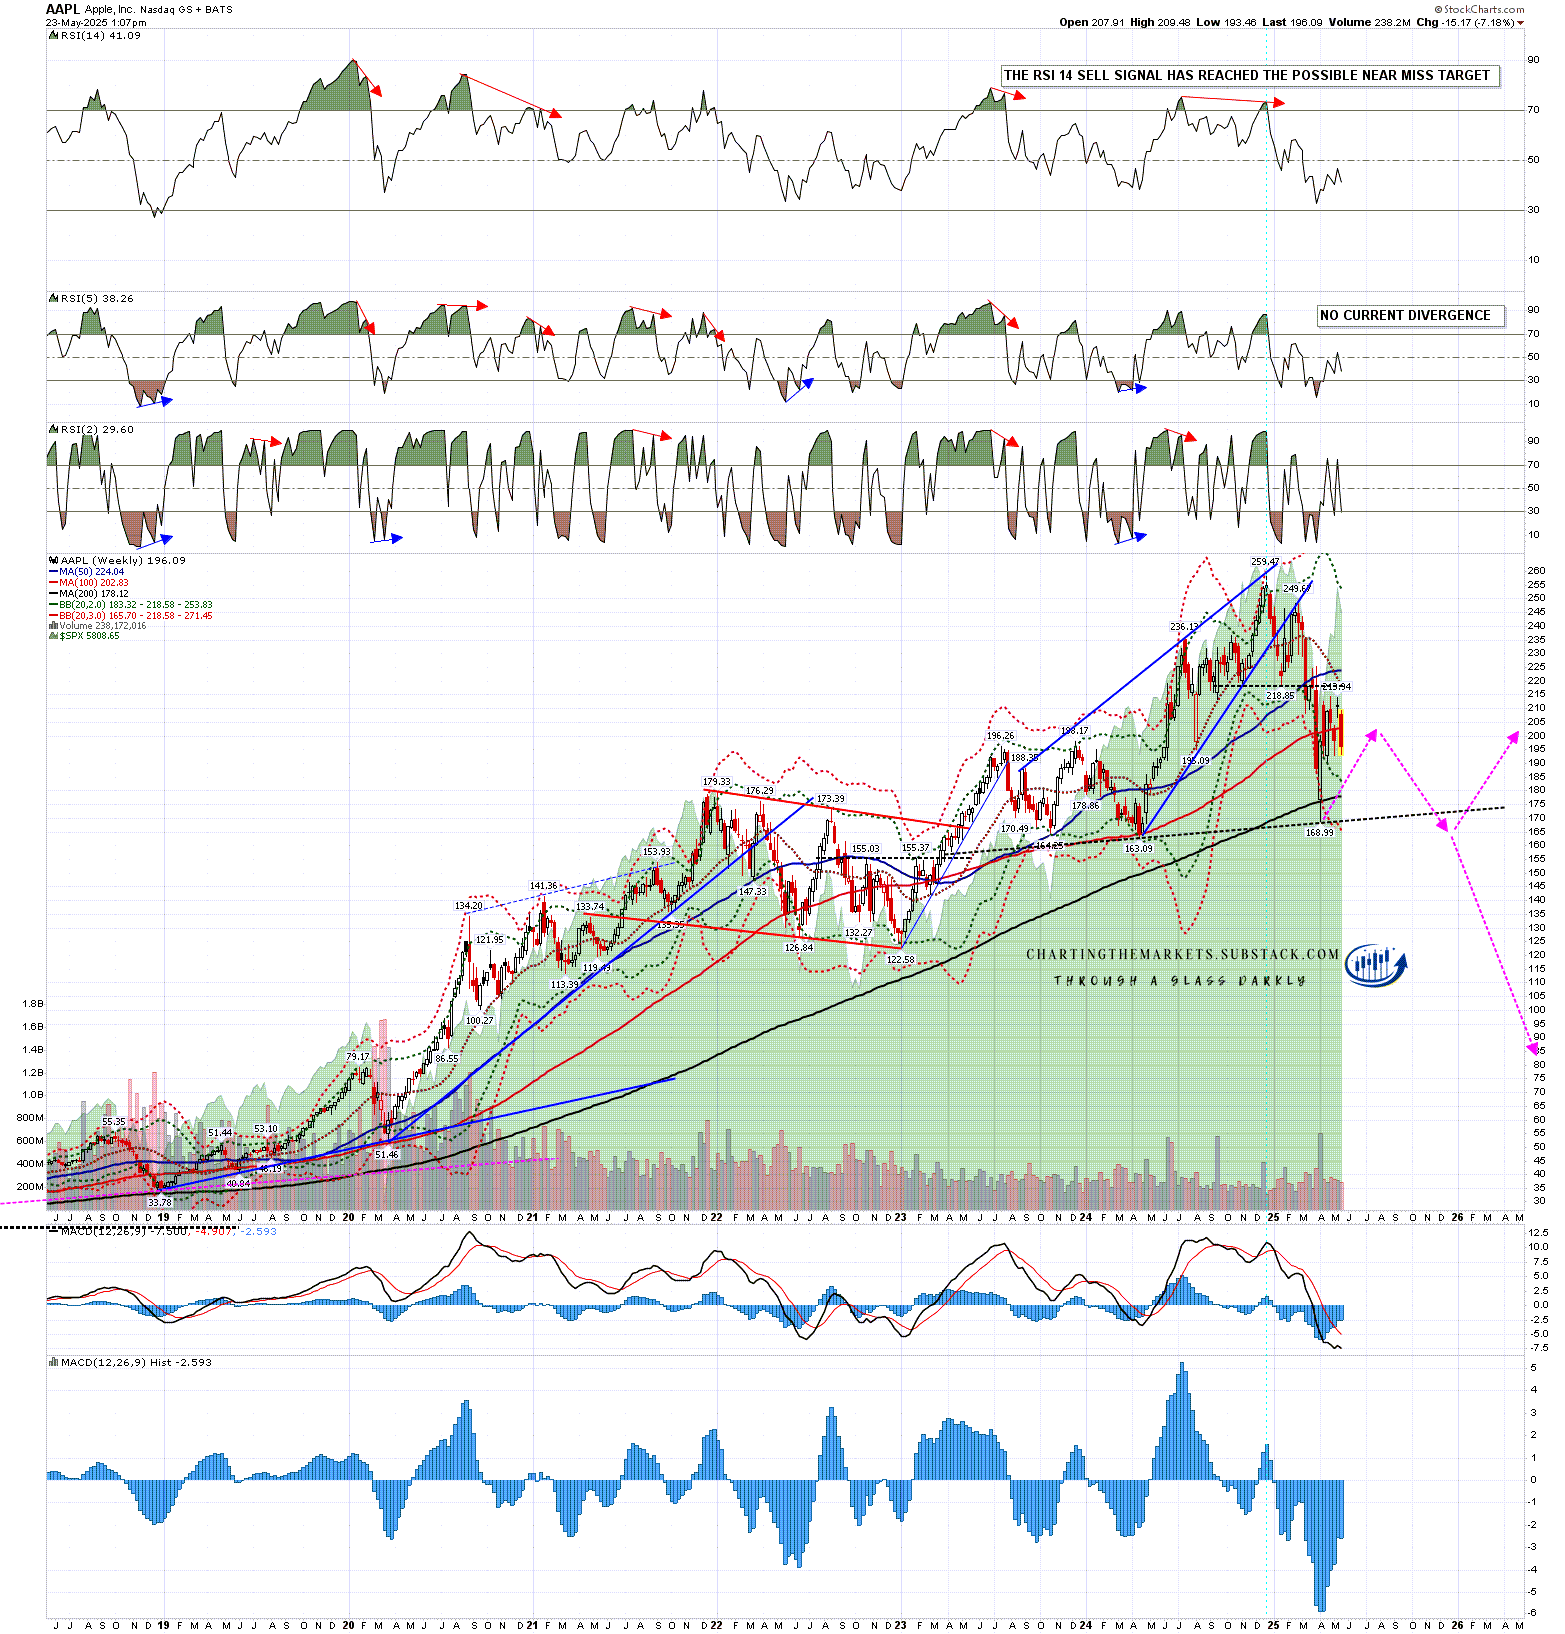
The other thing Trump mentioned this morning was a 25% tariff on iPhones not made in the USA, which I assume would be all of them. This seemed a strange one and he might just have woken up on the wrong side of his random number policy generator but it did remind me that I emailed out an AAPL weekly chart as my Chart of the Day for my substack subscribers earlier this week noting that the arrows I drew on this back in early April to show a possible very large H&S forming are still looking pretty good.

AAPL weekly chart:

I’ve been saying the following on all my posts so far this year:

As I have been since the start of 2025 I’m still leaning on the bigger picture towards a weak first half of 2025 and new all time highs later in the year, very possibly as a topping process for a much more significant high. One way or another I think we’ll be seeing lower soon and I’m not expecting this to be a good year for US equities, not least because both of the last two years have been banner years for US equities. A third straight year of these kinds of gains looks like a big stretch. I could of course however be mistaken. UPDATE 11th March 2025 - I am wondering if this may be a bear market that dominates the whole of 2025.

This is going faster than I expected and it looks like we may see both the initial weakness and the new all time highs in the first half of this year. I remain doubtful about seeing much more than retests of the all time highs and I think we may well see a lot of further market disruption in the second half of 2025. We’ll see how that goes. Everyone have a great weekend. :-)

If you like my analysis and would like to see more, please take a free subscription at my chartingthemarkets substack, where I publish these posts first. I also do a premarket video every day on equity indices, bonds, currencies, energies, precious commodities and other commodities at 8.45am EST. If you’d like to see those I post the links every morning on my twitter, and the videos are posted shortly afterwards on my Youtube channel.

Thursday, 22 May 2025

The Dog That Didn't Bark

My apologies for this unusually long post. This has been a very interesting week on Crypto and there is a lot to look at. I did consider splitting this into two shorter posts but decided it is better to just do a longer post today.

In my last post on Monday 12th May I was looking at the possibility that large IHS reversal patterns might be forming on Solana (SOLUSD) and Ethereum (ETHUSD), and that there might be a large retracement across the board on those two and Bitcoin (BTCUSD) while right shoulders were established on those IHS patterns.

Last Friday, as the modest retracement we have seen this week on equities was setting up, my working assumption was that this retracement on Crypto would happen mostly as that retracement played out on equities, as the retracement between Crypto and equity indices is historically very strong, but that didn’t deliver as I expected and while what did happen was interesting, what didn’t happen was potentially much more interesting. Let’s have a look at that.

What did happen was primarily that Bitcoin made a new all time high. I was expecting that in coming weeks in any case and mentioned that the retracement on Bitcoin clearly looked like a bullish consolidation in my posts on 20th Feb, in detail in my posts on 25th Feb and 28th Feb, and on all of my posts and many of my premarket videos since. That bullish consolidation has now delivered the promised new all time high.

Could this be the second high of a large double top? Possibly though I’m not currently seeing much reason to think so. Historically bull market highs on Crypto occur around December and while the high in January might just have qualified, a high here would not. There are exceptions to every rule of course, but I’m really not seeing much reason to see this as a candidate bull market top yet.

BTCUSD weekly chart:

The main thing that didn’t happen over the last few days of course is that while equities have taken a brief pause in this wild move up since it began when most of the ‘reciprocal’ tariffs were delayed, Bitcoin has not. The correlation between Bitcoin and equity indices is strong though not perfect of course, as you can see on the chart below with AAPL prices used as the background on the chart.

I have mentioned in posts regularly this year, including in my last post, that Crypto may decouple from equity prices this year as trouble grows in the US Treasuries markets, and this might be an early sign that decoupling is starting to happen and that Bitcoin particularly may be starting to be treated as a flight to safety destination when there is trouble elsewhere. There was a lot of trouble in bond markets yesterday of course so this has me wondering.

In the short term there is still a daily RSI 5 sell signal fixed on Bitcoin and yesterday there was also a possible daily RSI 14 sell signal brewing. If Bitcoin closes at current levels as I write, that RSI 14 negative divergence will be lost at the close today and if Bitcoin goes much higher the RSI 5 sell signal will likely fail too.

BTCUSD daily chart:

The hourly chart is very interesting. I’ve been watching this closely in my premarket videos every morning and if you’ve been watching those you’ll know that there is a high quality rising wedge from the April low and that Bitcoin tested and held wedge support at the lows on Monday. I mentioned that unless that trendline support broke then the next obvious target within this rising wedge would be wedge resistance, which was hit and broken slightly last night.

I have marked in on the chart below a possible alternate resistance trendline but the obvious trendline was the original one I posted, so this might be a bearish overthrow signalling that a break down and retracement from this rising wedge may be coming next.

There is a possibility of course that Bitcoin is taking the lower probability option of breaking up from the rising wedge in which case the wedge target would be in the 145k area.

BTCUSD 60min chart:

On the Solana daily chart weak RSI 14 and RSI 5 sell signals have fixed and Solana is currently stalled just under the 200dma, currently at 181.15. This is main resistance and may hold for now, though I’d be expecting this to break and convert to support in any case later.

SOLUSD daily chart:

On the Solana hourly chart I drew in a possible path for an IHS right shoulder retracement in my post last week and I’ve left that neckline and arrows on the chart in purple, while adding the updated possible IHS as we see it now in black. The right shoulder so far is much smaller than the left and didn’t get anywhere close to the ideal right shoulder low so far but the IHS would still be valid on a break up directly from here and the IHS target would be in the 275 area, close to a retest of January’s all time high at 294.95.

A small H&S broke down with a target in the 142 area and failed overnight but this looks likely a bull flag forming on Solana and, that being the case, it is possible that we may see a further lower low under 158.50 before this bull flag breaks up.

SOLUSD 60min chart:

On the Ethereum daily chart weak RSI 14 and RSI 5 sell signals have also fixed and Ethereum is also currently stalled just under the 200dma, currently at 2695.49. This is main resistance and may hold for now, though I’d be expecting this to break and convert to support in any case later.

ETHUSD daily chart:

On the Ethereum hourly chart I drew in a possible path for an IHS right shoulder retracement in my post last week and I’ve left that neckline and arrows on the chart in purple, while adding the updated possible IHS (with a different neckline) as we see it now in black. The right shoulder so far is much smaller than the left and didn’t get anywhere close to the ideal right shoulder low so far but the IHS would still be valid on a break up directly from here and the IHS target would be at a retest of the December high at 4109.05.

ETHUSD 60min chart:

So what are the takeaways here? The bull market in Crypto demonstrably didn’t end in January and likely isn’t ending here either. There is a strong bullish setup in place that may support a big move up in all three of these instruments overall in the next few months.

What does it mean if Crypto is decoupling from equity indices over the next few months? Mainly it means that Crypto would increasingly start to fall as equities rise and rise when equities fall. As I like the upside prospects on Crypto a LOT better than the prospects on equities over the rest of 2025 that might be a very good thing for Crypto.

So far this year I have been and am still leaning towards seeing weakness in the first half of the year and renewed strength in the second half of 2025, with a very possible bull market high on Crypto pencilled in close to the end of the year. That scenario would be a good match with past Crypto bull markets. Is it possible that I am mistaken? Always, but we can only ever try to identify the higher probability paths in the future. Only time can show us the path that is actually taken. Still, I’m with Confucious who said ‘study the past, if you would divine the future’. - 22nd May 2025 - IDEALLY THE PATH FROM HERE TAKES CRYPTO INTO A BULL MARKET HIGH IN OR CLOSE TO DECEMBER 2025

If you’d like to see more of these posts and the other Crypto videos and information I post, please subscribe for free to my Crypto substack. I also do a premarket video every day on Crypto at 9.05am EST. If you’d like to see those I post the links every morning on my twitter, and the videos are posted shortly afterwards on my Youtube channel.

I'm also to be found at Arion Partners, though as a student rather than as a teacher. I've been charting Crypto for some years now, but am learning to trade and invest in them directly, and Arion Partners are my guide around a space that might reasonably be compared to the Wild West in one of their rougher years.

Friday, 16 May 2025

The End of the Beginning & TSLA Update

In my last post on Thursday 8th May I was looking at the bear flag inflection point that US equity markets were in last week. That broke up hard on the 90 day delay on most of the China tariffs over the weekend.

I was saying in that post that a break and conversion of the 200dma on SPX would open a possible retest of the all time highs, and the 200dma on SPX has now been converted with a strong gap over it on Monday and closes well above it every day this week.

Is this the end of market excitement this year? I think probably not, but it is the end of the beginning of that market excitement, and I think a retest of the SPX all time high soon is now likely.

After that I still think that the main event of the markets this year may be based around a crisis in the bond markets but elsewhere there are still important points to remember.

In terms of China, only the tariffs imposed on the 8th & 9th of April were paused, that leaves the 20% imposed by Trump in his first term, and the 10% baseline and 20% fentanyl tariffs imposed by Trump this year. That is still an impressive 50%, not an embargo level but still a level that will limit trade and raise a lot of prices.

In terms of the effect of tariffs the Yale Budget Lab published an interesting analysis that is well worth a read, but key takeaways are that consumers still face an overall effective tariff rate of 17.8%, the highest since 1934, and the increase will likely cost the average US household $2,800 in 2025.

This is the highest effective tax increase on US households since the 1960s I understand and, while the administration is still in denial about that, it will soon enough be unambiguously obvious to every US consumer who isn’t too rich to notice.

The US budget deficit is higher than ever and current tax and spend plans, if they manage to get through both houses, will make that situation significantly worse. This is an important part of why I have been writing since November about a possible major bonds crisis in the second half of 2025.

This is therefore likely just a pause for breath, the US is still likely in recession in my view, and there may still be a significant effect on inflation, which is the reason the Fed has not been cutting interest rates while most other developed world central banks have been cutting theirs.

What this pause for breath should deliver however is an opportunity to see some of these economic and fiscal numbers come through. By the time this ninety day pause expires we will have another couple of months of inflation and deficit numbers numbers and should also have the growth numbers for Q2 2025. That should clarify where the US economy stands here.

So what’s next for US equity markets? Well the first thing that strikes me on the daily chart, apart from the break and conversion of the 200dma of course, is that the RSI 5 is now over 90. This is a very high level, only hit five times in the last two years. What happened on those other five occasions?

Firstly I would note that on all five occasions there was a modest retracement or consolidation within a couple of days of reaching the daily RSI 5 90 level. That was always modest, the largest retracement was 80 points and most were significantly less than that though all delivered a decline in the RSI 5 level, with three of those taking that RSI 5 level under 70.

Secondly I would note that on all five occasions there was then a higher high on price with a lower high on RSI 5, setting an RSI 5 sell signal brewing and then all five fixed that sell signal with a larger decline than the first one. Three of those sell signals then made the sell signal target at 30-5 on the RSI 5, and two failed as price went considerably higher, which is a much worse hit rate than sell signals established at lower levels on the RSI 5, but is indicative of a strong trend, which we may well have here, for now at least.

Only one of these RSI 5 spikes over 90 preceded a significant high delivering a decline of more than 5%.

From here this means that SPX likely at least consolidates without going much higher for two weeks and then we could see a larger retracement but without any strong expectation of a big decline. I am wondering though about a possible backtest of the 200dma, currently in the 5760 area.

SPX daily BBs chart:

What are the shorter term charts telling us here? Well the bear flags from last week are all broken and they have been replaced by …… nothing obvious as yet. The stats already say that we are unlikely to be looking at a significant high here but I also mention regularly that if there are no clear patterns it is usually because the current move is not close to finished. The hourly charts are telling us that price is likely heading significantly higher, and that means that retests of the all time highs on SPX and QQQ are likely, and that a retest of the all time high on DIA is possible.

In the shorter term there is a high quality possible hourly RSI 14 sell signal on SPX and I’m expecting this to fix and play out in a modest retracement in the next three or four trading days.

SPX 60min chart:

On QQQ a high quality hourly RSI 14 sell signal has already fixed.

QQQ 60min chart:

There’s not much prospect of an hourly RSI 14 sell signal on DIA, but I would note that DIA is now starting to test a significant support/resistance price zone 426.5 to 429.5. This would be a very good area to see retracement/consolidation for a few days.

DIA 60min chart:

I’ve been following the TSLA chart with a lot of interest this year and I sent this chart to my free subscribers this morning as the first one in a new series of ‘Chart of the Day’ that I’m starting to send out, as I’ve always found these interesting from other analysts in the past.

In my post on 12th March I showed the H&S on TSLA that had broken down with a target in the 148 area. On 17th April I then showed an updated chart with a possible double bottom on it that on a sustained break up would look for the 370 area.

That double bottom did break up hard and so far TSLA has managed to reached the 50% retracement of the decline from the all time high. This is where those two patterns come into conflict. If TSLA reaches that double bottom target in the 370 area it will need to rise past the H&S right shoulder high at 367.34. That would invalidate the H&S and the H&S target, and potentially open a retest of the all time high, though in this particular case I’m very doubtful about seeing that retest this year, or possibly ever. We’ll see.

TSLA daily chart:

I’ve been saying the following on all my posts so far this year:

As I have been since the start of 2025 I’m still leaning on the bigger picture towards a weak first half of 2025 and new all time highs later in the year, very possibly as a topping process for a much more significant high. One way or another I think we’ll be seeing lower soon and I’m not expecting this to be a good year for US equities, not least because both of the last two years have been banner years for US equities. A third straight year of these kinds of gains looks like a big stretch. I could of course however be mistaken. UPDATE 11th March 2025 - I am wondering if this may be a bear market that dominates the whole of 2025.

This is going faster than I expected and it looks like we may see both the initial weakness and the new all time highs in the first half of this year. I remain doubtful about seeing much more than retests of the all time highs and I think we may well see a lot of further market disruption in the second half of 2025. We’ll see how that goes. Everyone have a great weekend. :-)

If you like my analysis and would like to see more, please take a free subscription at my chartingthemarkets substack, where I publish these posts first. I also do a premarket video every day on equity indices, bonds, currencies, energies, precious commodities and other commodities at 8.45am EST. If you’d like to see those I post the links every morning on my twitter, and the videos are posted shortly afterwards on my Youtube channel.

Monday, 12 May 2025

Canaries and Cheerleaders

I called the likely start of a strong rally on Crypto in my post on 11th April, and we have seen that rally. This has been, as I titled my post that day, a distorted mirror image of the rally on equities at the same time.

As of this morning I had not called a candidate rally high on either Crypto or equities for the move up from there as the setups didn’t look ready yet. That’s still the case on equities but there is now a high quality setup to reverse down here on Crypto for at least a strong retracement, and possibly a 2025 low retest.

I have a number of instruments I watch to warn me of possible direction changes coming on equities and Crypto is one of those, along with oil, copper, lumber and some others. I’m not assuming that equities will set up to reverse back down as well shortly but they may well. At the least there is a good case to see some consolidation on equities here. Crypto and equities do tend to be strongly correlated, but they aren’t in full sync all the time, and it may be that this move can happen without anything more than some sideways consolidation on equities.

In terms of how well correlated Crypto and equities are you can see that on the chart below. I’m thinking that may start to decouple later this year but there’s been no sign of that yet.

BTCUSD weekly (LOG) vs NDX chart:

I’ve been saying consistently in my posts since the all time high this year that there was no obvious reason to think that Bitcoin (BTCUSD) was doing anything more than consolidating before the next move up in the current bull market.

This wasn’t a common view on Crypto twitter but mostly the players there are cheerleaders rather than analysts. A friend directed me to a few of their comments yesterday predicting a big break up on Crypto on the news from the China talks, and I told him that cheerleaders like to cheer, but I had a very nice reversal setup telling me that likely wouldn’t happen, though obviously it could.

Equities, where I didn’t have a similar setup, broke up but Crypto did not, further validating this reversal setup on Crypto.

Just to start with I mentioned last week that a high quality daily RSI 5 sell signal had fixed on Bitcoin and in my post on Friday I said that resistance on Bitcoin was in the 105k area, with possible backstop resistance at the all time high at 109.3k. 105k held so far and it looks like the retracement has started, barring any possible high retest. This was what I said then:

I’m watching resistance on all of these carefully. On Bitcoin that resistance is at 105k with possible backstop resistance at a retest of the all time high at 109.2k. Resistance on Solana and Ethereum are at the March highs and possible larger IHS necklines at 179.93 and 2551.36 respectively. I am thinking 70% odds that these are all topping out in these areas for at least a strong retracement.

BTCUSD daily chart:

On the hourly chart on Bitcoin the double bottom targets in the 102-4k area were hit, an RSI 14 sell signal then fixed, and a high quality rising wedge has been established from the low. That wedge resistance was the resistance level at 105k and the next obvious target within the rising wedge is rising wedge support currently in the 98k area. That is currently a decent match with the daily middle band currently in the 97.2k area.

There are no lower targets currently though I would note that the daily sell signal is suggesting that we may well see a 50% retracement of the move up from the lows, and that would get us to the 89k to 90k area.

Is there a case for going lower? Yes, and if we see Bitcoin break with confidence below 90 I’ll be looking again at the case for a backtest of the 69k to 70k area, as part of a possible bigger picture bull flag forming, but until we see that break it isn’t interesting enough to spend time on today.

BTCUSD 60min chart:

Solana (SOLUSD) almost hit the first double bottom target in the 184 area and may well top out without a full hit. I was seeing main resistance on Solana at the early March high at 179.93, and the 20dma, currently at 181. Solana has held at 181.38 so far. An hourly RSI 14 sell signal then also fixed after Solana hit the 180/1 resistance area.

Now this was very interesting, as I have another very decent quality rising wedge on Solana and, as I mentioned on Friday, the March high at 179.93 is a possible IHS neckline. There is a serious possibility that this will be a retracement to form the right shoulder on a large IHS. The ideal right shoulder low would be in the 125.43 area and on a subsequent sustained break over 182 the IHS target would be in the 265 area. This is a very nice setup.

This rising wedge may alternatively be a bear flag though, so if there was a strong break below 125 then the obvious next target would be a retest of the April low at 95.25.

SOLUSD 60min chart:

I really like looking for confirmation of likely moves on related instruments, so I was very encouraged that the two high quality rising wedges on Bitcoin and Solana were backing each other up.

For that same reason I was very encouraged to see that there is also a possible large IHS forming on Ethereum (ETHUSD)

A smaller IHS formed on Ethereum though I missed it befre the break up as the rally on Ethereum has been so weak that I wasn’t giving it enough attention. That broke up suddenly, and very hard, last week, made the IHS target in the 2400 area and topped out at 2624, sightly above the early March high at 2551.

That March high was also a possible large IHS neckline area, as I mentioned on Friday, and a retracement has now started that may well also be to form the right shoulder on that IHS. An hourly RSI 14 sell signal has also fixed and a small double bottom has broken down with a target in the 2250-70 area.

The ideal right shoulder low would be in the 2074.27 area and on a subsequent sustained break over 2650 the IHS target would be in the 38.8k area. Again this is a very nice setup & here there is no obvious bear flag alternative.

ETHUSD 60min chart:

Since I started writing this post the hourly RSI 14 sell signal on Bitcoin has reached target.

Crypto has been moving today and you might currently be thinking that you’d have preferred to have seen all this at the start of the current trading day rather than at the end. Well, anyone who watched my premarket video this morning could see all this before the RTH market open today, and the email with the video also included the charts and explanatory notes. If you’d like to see those in future you just need to join my substack. The link is below.

So far this year I have been and am still leaning towards seeing weakness in the first half of the year and renewed strength in the second half of 2025, with a very possible bull market high on Crypto pencilled in close to the end of the year. That scenario would be a good match with past Crypto bull markets. Is it possible that I am mistaken? Always, but we can only ever try to identify the higher probability paths in the future. Only time can show us the path that is actually taken. Still, I’m with Confucious who said ‘study the past, if you would divine the future’.

If you’d like to see more of these posts and the other Crypto videos and information I post, please subscribe for free to my Crypto substack. I also do a premarket video every day on Crypto at 9.05am EST. If you’d like to see those I post the links every morning on my twitter, and the videos are posted shortly afterwards on my Youtube channel.

I'm also to be found at Arion Partners, though as a student rather than as a teacher. I've been charting Crypto for some years now, but am learning to trade and invest in them directly, and Arion Partners are my guide around a space that might reasonably be compared to the Wild West in one of their rougher years.

Friday, 9 May 2025

Bitcoin Reaches Double Bottom Targets

I wrote a post on 11th April looking at a possible rally options on Bitcoin (BTCUSD), Solana (SOLUSD) and Ethereum (ETHUSD). I wrote a follow up post on 23rd April after Bitcoin broke up from that double top.

On Bitcoin there was a good quality double bottom that on a sustained break over 88k would look for a target in the 102-4k area. Bitcoin made a high at 105k last night so that double bottom target has been reached. So what now?

Well I was looking in that first post at the larger double top target in the 69-70k area and if there is an overall bull flag forming here then Bitcoin may reverse down from here and then hit that target as that overall bull flag forms.

There is also a high quality rising wedge here with Bitcoin having just hit and confirmed the wedge resistance trendline, so there is a possible high forming here.

At points like this I look for negative divergence and I am seeing a lot of that here. Hourly RSI 14 and RSI 5 sell signals have now fixed overnight, suggesting that we may be looking at a swing high here that may be a strong match for the high I think is likely forming on equities.

BTCUSD 60min chart:

On the daily chart my favorite sell signal is the RSI 5 sell signal and one of those fixed a few days ago. That has not been invalidated and all eight of the previous fixed daily RSI 5 sell signals shown on the chart below reached at least the minimum target in the 35 area on the daily RSI 5. I’d expect this one to reach that too.

BTCUSD daily chart:

Could Bitcoin and Crypto generally break up here even if equities reverse back down? Likely no. The chart below charts Bitcoin against NDX and Bitcoin is still very strongly positively correlated with equities. I think that may start changing later this year if there is a significant loss of confidence in the safety of US treasuries, but there is no evidence at all so far suggesting that decoupling is already starting to happen.

Whether equities reverse down hard here (higher probability IMO) or break higher (lower probability IMO), Bitcoin will likely go with equities.

BTCUSD weekly (LOG) vs NDX chart:

Looking at Solana I have a decent looking rising wedge here that may be a bear flag and is overthrowing slightly this morning. I was suggesting a target at that wedge resistance trendline in the 170 area and Solana has made it to 176.

A possible RSI 5 sell signal is now brewing and as with Bitcoin I am looking for a high here. I’m watching this high carefully because the March high is at 179.93 and is a possible larger IHS neckline, and that resistance is backstopped by the 200dma currently at 181. I’m not expecting that 180-1 resistance to be significantly broken if Solana is topping out here.

SOLUSD 60min chart:

Ethereum is a strange one here, as it spent the first five weeks of this rally painfully crawling up less than $450 bucks, and then spiked up $650 yesterday. Is there a bear flag setup here? Nothing that is obvious but I would note that Ethereum has unexpectedly managed to catch up with Solana and is now also close to a test of the March high at 2551.36, and that level is also a possible IHS neckline.

No current negative divergence on Ethereum on either the daily or hourly charts, as the daily RSI 5 sell signal that had fixed on Ethereum failed in the wild spike upwards yesterday. If Bitcoin and Solana top out here though, then Ethereum will very likely follow.

ETHUSD daily chart:

I’m watching resistance on all of these carefully. On Bitcoin that resistance is at 105k with possible backstop resistance at a retest of the all time high at 109.2k. Resistance on Solana and Ethereum are at the March highs and possible larger IHS necklines at 179.93 and 2551.36 respectively. I am thinking 70% odds that these are all topping out in these areas for at least a strong retracement. .

Everyone have a great weekend. :-)

So far this year I have been and am still leaning towards seeing weakness in the first half of the year and renewed strength in the second half of 2025, with a very possible bull market high on Crypto pencilled in close to the end of the year. That scenario would be a good match with past Crypto bull markets. Is it possible that I am mistaken? Always, but we can only ever try to identify the higher probability paths in the future. Only time can show us the path that is actually taken. Still, I’m with Confucious who said ‘study the past, if you would divine the future’.

If you’d like to see more of these posts and the other Crypto videos and information I post, please subscribe for free to my Crypto substack. I also do a premarket video every day on Crypto at 9.05am EST. If you’d like to see those I post the links every morning on my twitter, and the videos are posted shortly afterwards on my Youtube channel.

I'm also to be found at Arion Partners, though as a student rather than as a teacher. I've been charting Crypto for some years now, but am learning to trade and invest in them directly, and Arion Partners are my guide around a space that might reasonably be compared to the Wild West in one of their rougher years.


Thursday, 8 May 2025

Assessing This Bear Flag Inflection Point

In my post on 17th April I posted some 15min charts with arrows showing an ideal path to forming bear flag wedges on SPX, QQQ and DIA. I added one for IWM in the post after that. I’ve updated these since but left the original arrows where I first drew them for reference on the last four charts today so you can see I wasn’t that far off.

In my post on Tuesday 29th April I was saying that ideally we would see a modest decline (by recent standards) to play out some negative divergence on SPX, QQQ, ES and NQ and we saw that play out over the next few days with all the hourly and 15min sell signals I mentioned in that post reaching target. After that I was looking for another and probably last leg up within those bear flags and since then we have seen new rally highs on all four.

In my last post on Thursday 1st May I was looking for more upside with a likely high early this week, and that hasn’t quite delivered, though I think there is a good case for seeing my target area hit today or tomorrow.

In my premarket video on Monday 5th May I was looking for a decline that lasted a couple of days and then retests of the rally highs to set possible daily RSI 5 sell signals brewing across the board on the US indices I cover, SPX, QQQ, DIA and IWM, and in my premarket video this morning, after that decline delivered, I was looking for a retest of the rally highs across the board on these today or tomorrow, and at the time of writing that looks very likely to happen today.

So how are the ideal bear flag setups that I drew and posted on 17th April on SPX, QQQ and DIA looking now? Bottom line the rally has gone higher and lasted longer than I expected then, but the overall setup still looks decent.

I think the most important of these four charts is likely to be SPX, though I might be mistaken, so I’m still expecting the ideal flag resistance trendline that I drew on 17th April to be hit. That trendline is currently in the 5760 area, so SPX would need to go up another 60 handles over the rally high so far.

SPX 15min chart:

That might seem a little ambitious, but it is also a decent match with the last major resistance level left on SPX, which is of course the 200dma, currently in the 5748 area. A break and conversion of the 200dma would open a possible retest of the all time highs, which I think is unlikely directly from here but is still a significant possibility worth considering if we exit this inflection point to the upside.

SPX daily chart:

On the QQQ chart the ideal flag resistance trendline was hit last week and broken slightly at the current rally high. That might hold as resistance and, if so, then SPX likely won’t reach the 200dma. We’ll see.

QQQ 15min chart:

DIA also reached the ideal trendline I drew on 17th April last week and the same applies as on QQQ.

DIA 15min chart:

I drew in the ideal bear flag wedge resistance trendline on IWM shortly after the others but that trendline, like the one on SPX, has not yet been reached. That’s now a whisker under 206 and if SPX reaches the 200dma then I’ll be expecting this to be hit too.

IWM 15min chart:

Are these actually bear flags forming? I don’t see much reason to think not as not much in terms of the overall economic and political background has changed during the course of this rally. I think that the delayed tariffs will likely never be reimposed but the White House is still very keen on tariffs, and the tariffs already imposed, with the ongoing trade war with China, still constitute a huge tax rise for ordinary Americans, a serious inflationary risk and a major economic shock.

Growth in 2025 QI was negative (subject to revisions) and if current policy remains on track then I think growth in Q2 will likely be a lot worse, and growth in Q3 and Q4 may well be significantly negative too. Stock markets don’t tend to perform well in recessions. If the whole tariff policy was to be reversed tomorrow I think the shock and uncertainty of recent months would still likely follow through into at least another quarter of significantly negative growth. Unless the 2025 Q1 GDP numbers are revised into positive territory, the odds that the US is now in recession are at least 90% in my opinion.

Could we still see all time high retests before we see lower lows in 2025? Yes, SPX really likes high retests and those high retests could set up some very nice double tops, but I think at least a significant retracement from this area is very likely, and that would likely into lower lows for 2025.

I posted a big H&S scenario on a SPX weekly chart in my post on Tuesday 1st April on my bigger picture substack. I was first looking for a large decline into the 5100 area to reach a possible H&S neckline and then a strong multi-week rally to form a right shoulder on that H&S. That first decline went lower than 5100 but the H&S scenario still looked good and this rally since then may well have been forming that large H&S right shoulder. An updated version of that scenario is on the daily chart below.

Since I started writing this post new rally highs have been made on SPX, QQQ, DIA and IWM so possible daily RSI 5 sell signals are now brewing across the board. This puts us firmly into the inflection point and if US markets reverse hard then the scenario below is on the table here. There are two H&S neckline options show now, but in terms of targets they would both be looking for a retest of the Oct 2022 low at 3491.58.

Do I think that target could be on the table in current months? Yes, though I would note that if and when that H&S should break down there would be another opportunity then to retest the all time high, as the H&S might break down and then fail, which would trigger a target back at the all time high.

SPX daily chart - bear market projection:

In the short term I am leaning 70% towards at least a strong retracement here and 40% towards a retest of the 2025 low in the next three to four months. That may be hard to imagine here, but that is the essence of recency bias. Just before this rally started recency bias had many people leaning short, and after five weeks of a strong rally recency bias has many people leaning long.

If recency bias was useful in real life though then selling low and buying high would often be a profitable strategy. It isn’t, and recency bias just clouds the judgement. Very little has fundamentally changed during this rally and both growth and inflation numbers have got worse, with more of the same expected. The economic outlook for the rest of 2025 looks grim. That is objectively not a bullish backdrop for equities.

I’m doing a series of (currently four) posts at the moment on my The Bigger Picture substack on the US Dollar, US Treasuries, and the reasons to be very concerned about the possible further sharp declines on both that may be coming this year. The first of these posts is looking at the potentially bearish setup on the US Dollar, the second is looking at the potentially very bearish setup on US Treasuries, the third is looking at the reasons that we may see a bond market crisis this year, and will be published this week and the fourth will be looking at why the US Dollar may lose its status as the main reserve currency for the world, what that would likely look at and what other currencies and instruments might partly replace it. Everyone trading equities in this wild year should read these.

I have been a bit slow posting in recent days as I’ve been distracted setting up some paywalls at my substacks, but I’ll have a post out on Cryptos later today and the third post in my series above will be out in the next couple of days.

As I have been since the start of 2025 I’m still leaning on the bigger picture towards a weak first half of 2025 and new all time highs later in the year, very possibly as a topping process for a much more significant high. One way or another I think we’ll be seeing lower soon and I’m not expecting this to be a good year for US equities, not least because both of the last two years have been banner years for US equities. A third straight year of these kinds of gains looks like a big stretch. I could of course however be mistaken. UPDATE 11th March 2025 - I am wondering if this may be a bear market that dominates the whole of 2025.

If you like my analysis and would like to see more, please take a free subscription at my chartingthemarkets substack, where I publish these posts first. I also do a premarket video every day on equity indices, bonds, currencies, energies, precious commodities and other commodities at 8.45am EST. If you’d like to see those I post the links every morning on my twitter, and the videos are posted shortly afterwards on my Youtube channel.