
I called the likely start of a strong rally on Crypto in my post on 11th April, and we have seen that rally. This has been, as I titled my post that day, a distorted mirror image of the rally on equities at the same time.
As of this morning I had not called a candidate rally high on either Crypto or equities for the move up from there as the setups didn’t look ready yet. That’s still the case on equities but there is now a high quality setup to reverse down here on Crypto for at least a strong retracement, and possibly a 2025 low retest.
I have a number of instruments I watch to warn me of possible direction changes coming on equities and Crypto is one of those, along with oil, copper, lumber and some others. I’m not assuming that equities will set up to reverse back down as well shortly but they may well. At the least there is a good case to see some consolidation on equities here. Crypto and equities do tend to be strongly correlated, but they aren’t in full sync all the time, and it may be that this move can happen without anything more than some sideways consolidation on equities.
In terms of how well correlated Crypto and equities are you can see that on the chart below. I’m thinking that may start to decouple later this year but there’s been no sign of that yet.
BTCUSD weekly (LOG) vs NDX chart:
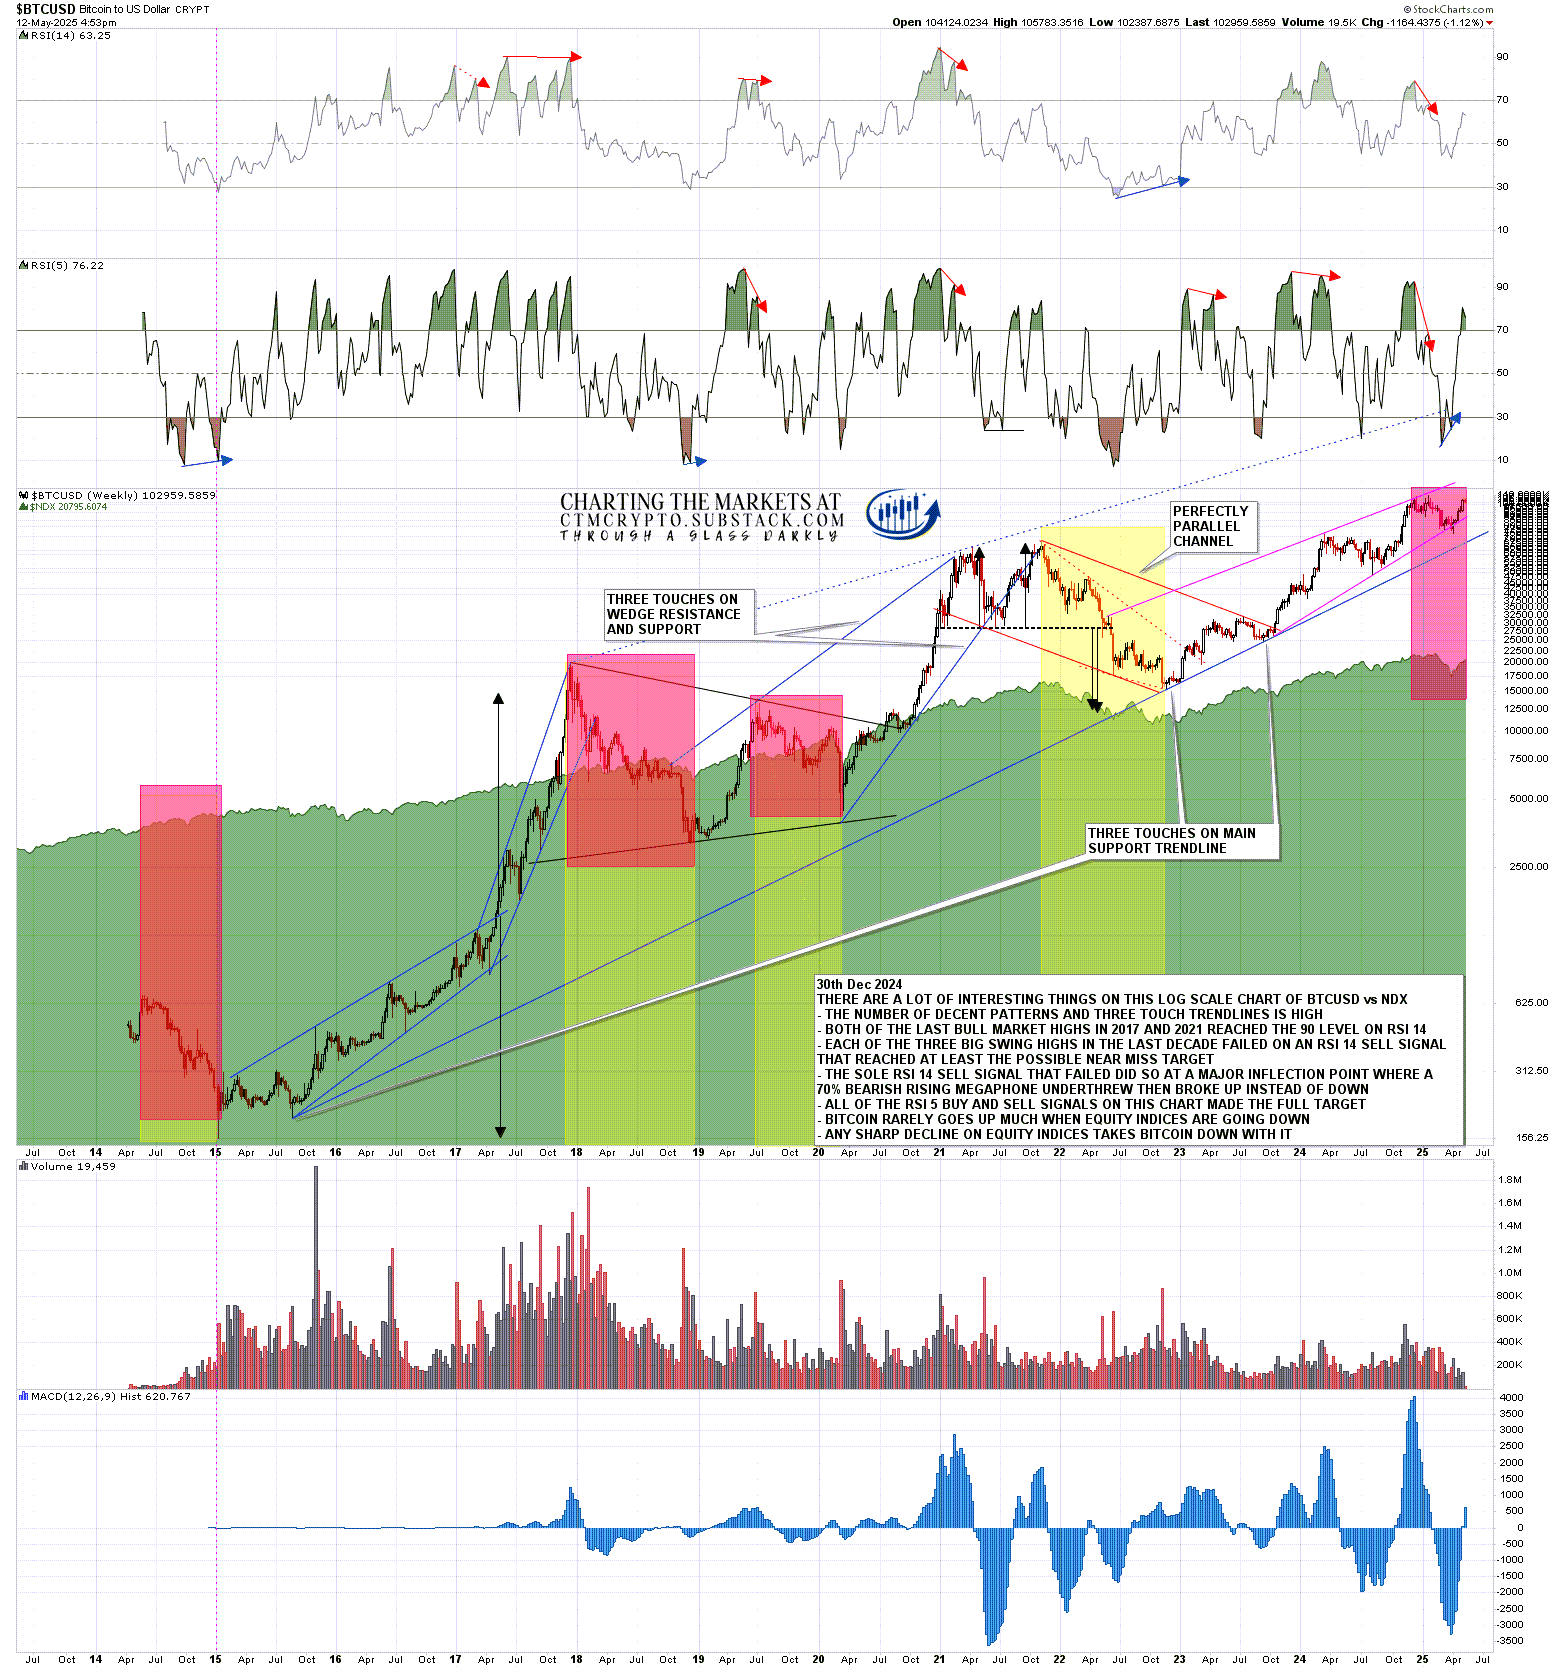
I’ve been saying consistently in my posts since the all time high this year that there was no obvious reason to think that Bitcoin (BTCUSD) was doing anything more than consolidating before the next move up in the current bull market.
This wasn’t a common view on Crypto twitter but mostly the players there are cheerleaders rather than analysts. A friend directed me to a few of their comments yesterday predicting a big break up on Crypto on the news from the China talks, and I told him that cheerleaders like to cheer, but I had a very nice reversal setup telling me that likely wouldn’t happen, though obviously it could.
Equities, where I didn’t have a similar setup, broke up but Crypto did not, further validating this reversal setup on Crypto.
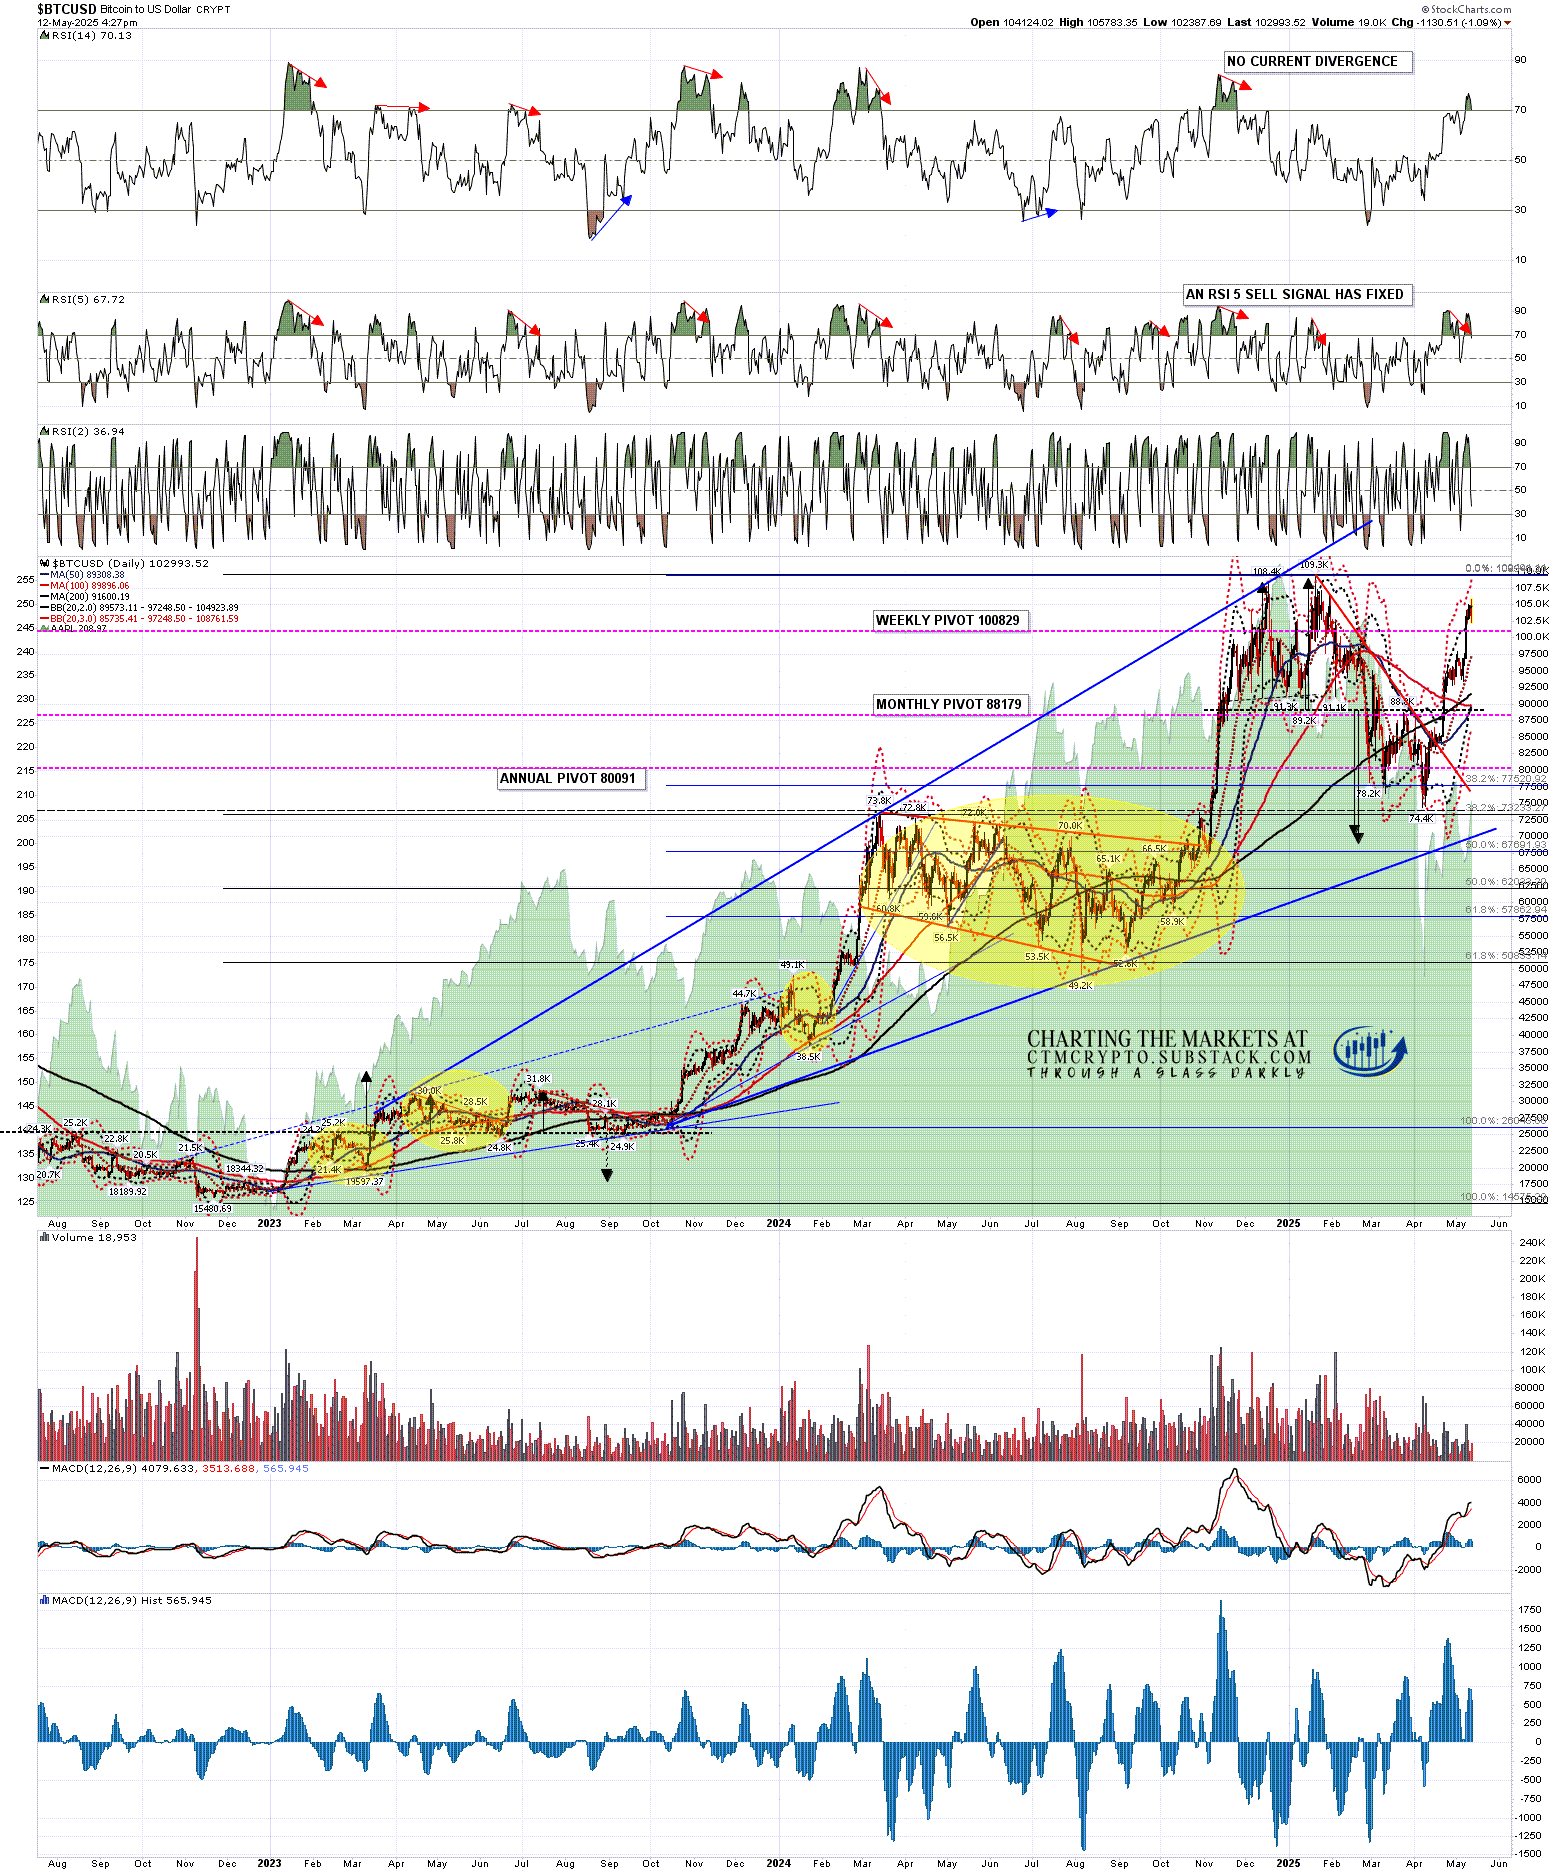
Just to start with I mentioned last week that a high quality daily RSI 5 sell signal had fixed on Bitcoin and in my post on Friday I said that resistance on Bitcoin was in the 105k area, with possible backstop resistance at the all time high at 109.3k. 105k held so far and it looks like the retracement has started, barring any possible high retest. This was what I said then:
I’m watching resistance on all of these carefully. On Bitcoin that resistance is at 105k with possible backstop resistance at a retest of the all time high at 109.2k. Resistance on Solana and Ethereum are at the March highs and possible larger IHS necklines at 179.93 and 2551.36 respectively. I am thinking 70% odds that these are all topping out in these areas for at least a strong retracement.
BTCUSD daily chart:
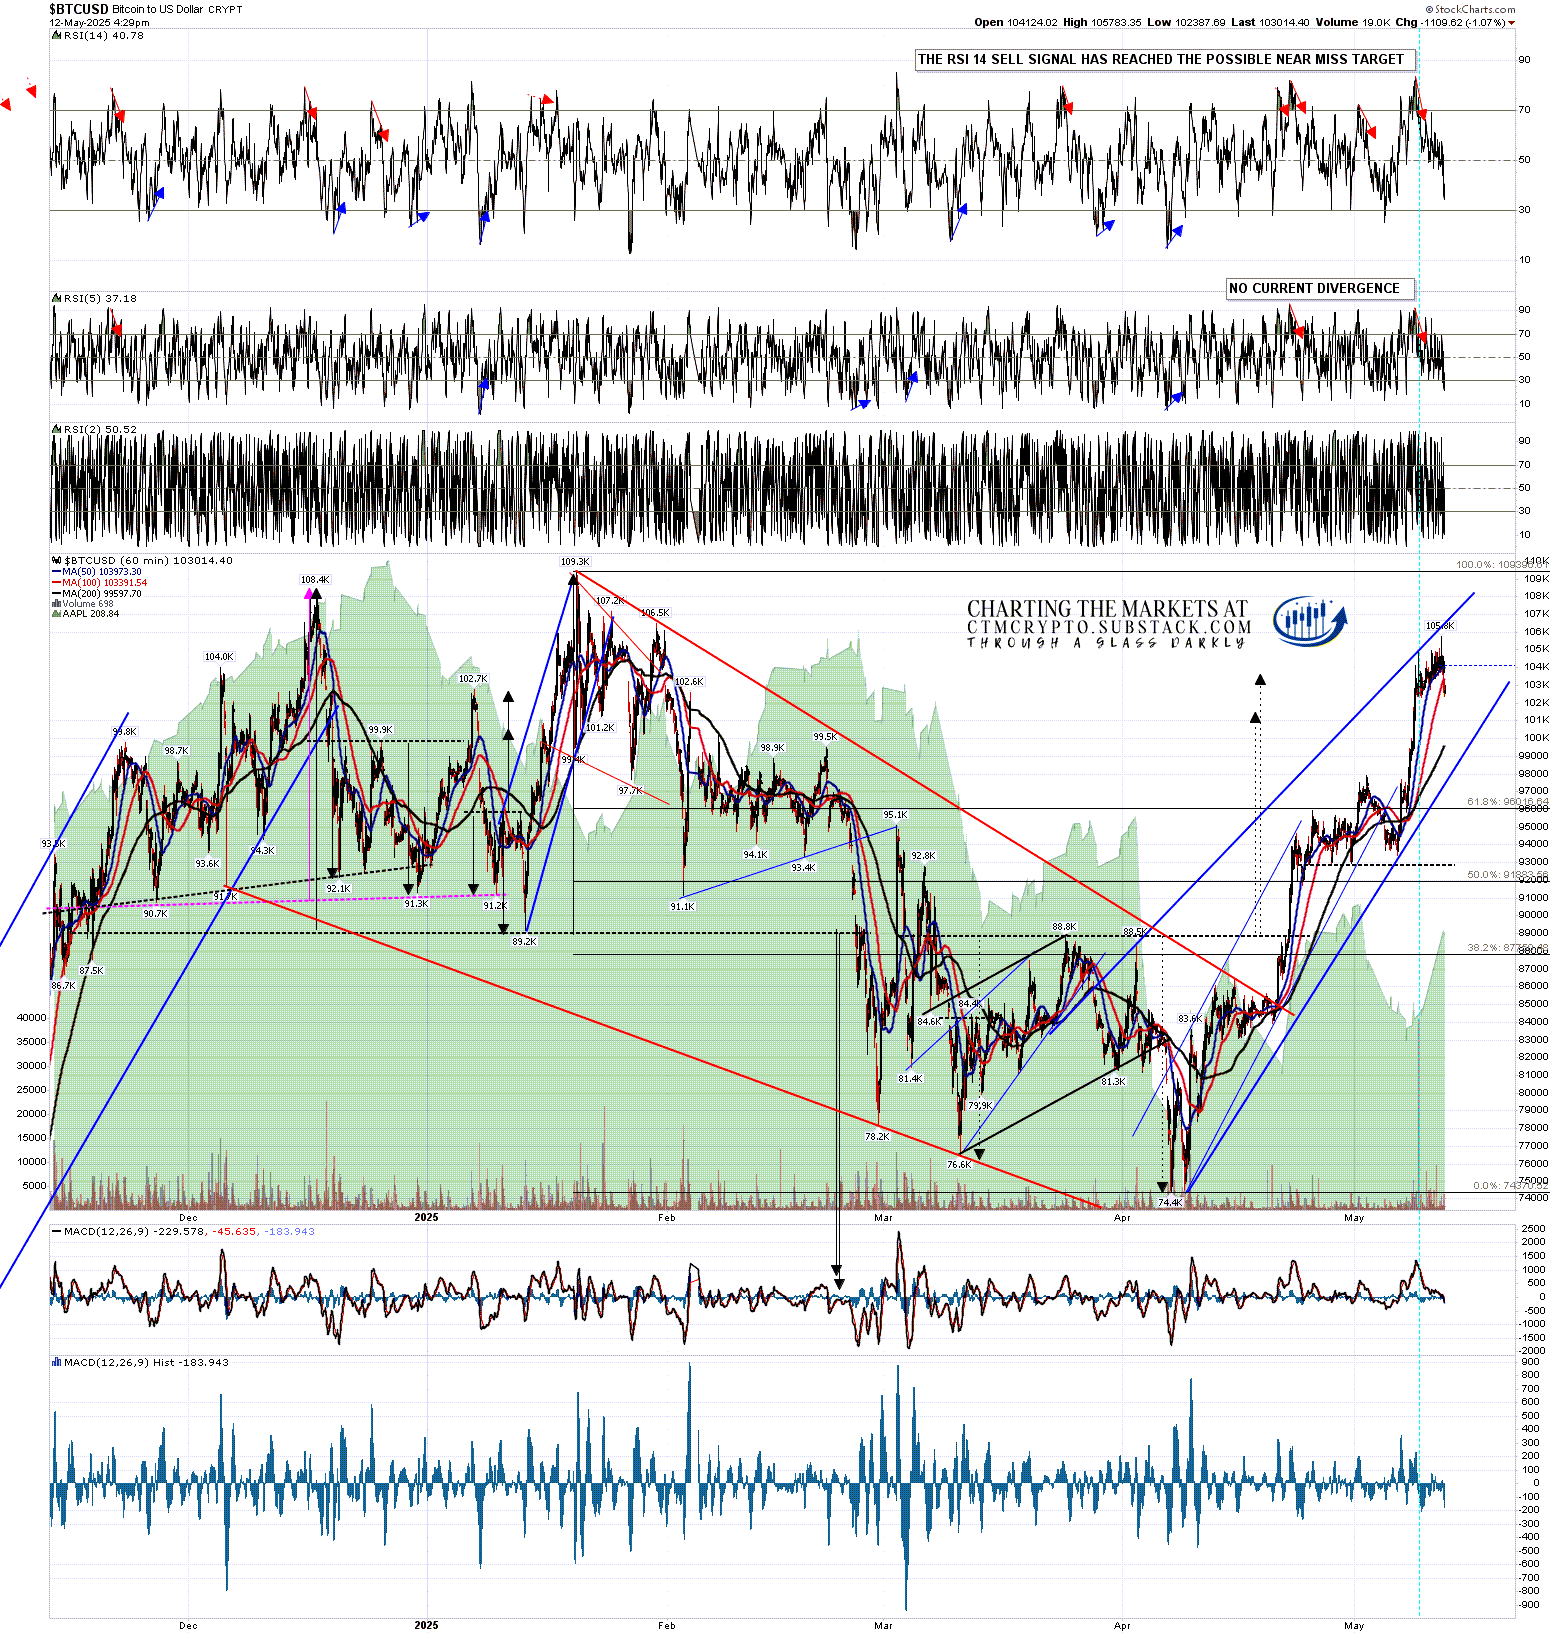
On the hourly chart on Bitcoin the double bottom targets in the 102-4k area were hit, an RSI 14 sell signal then fixed, and a high quality rising wedge has been established from the low. That wedge resistance was the resistance level at 105k and the next obvious target within the rising wedge is rising wedge support currently in the 98k area. That is currently a decent match with the daily middle band currently in the 97.2k area.
There are no lower targets currently though I would note that the daily sell signal is suggesting that we may well see a 50% retracement of the move up from the lows, and that would get us to the 89k to 90k area.
Is there a case for going lower? Yes, and if we see Bitcoin break with confidence below 90 I’ll be looking again at the case for a backtest of the 69k to 70k area, as part of a possible bigger picture bull flag forming, but until we see that break it isn’t interesting enough to spend time on today.
BTCUSD 60min chart:
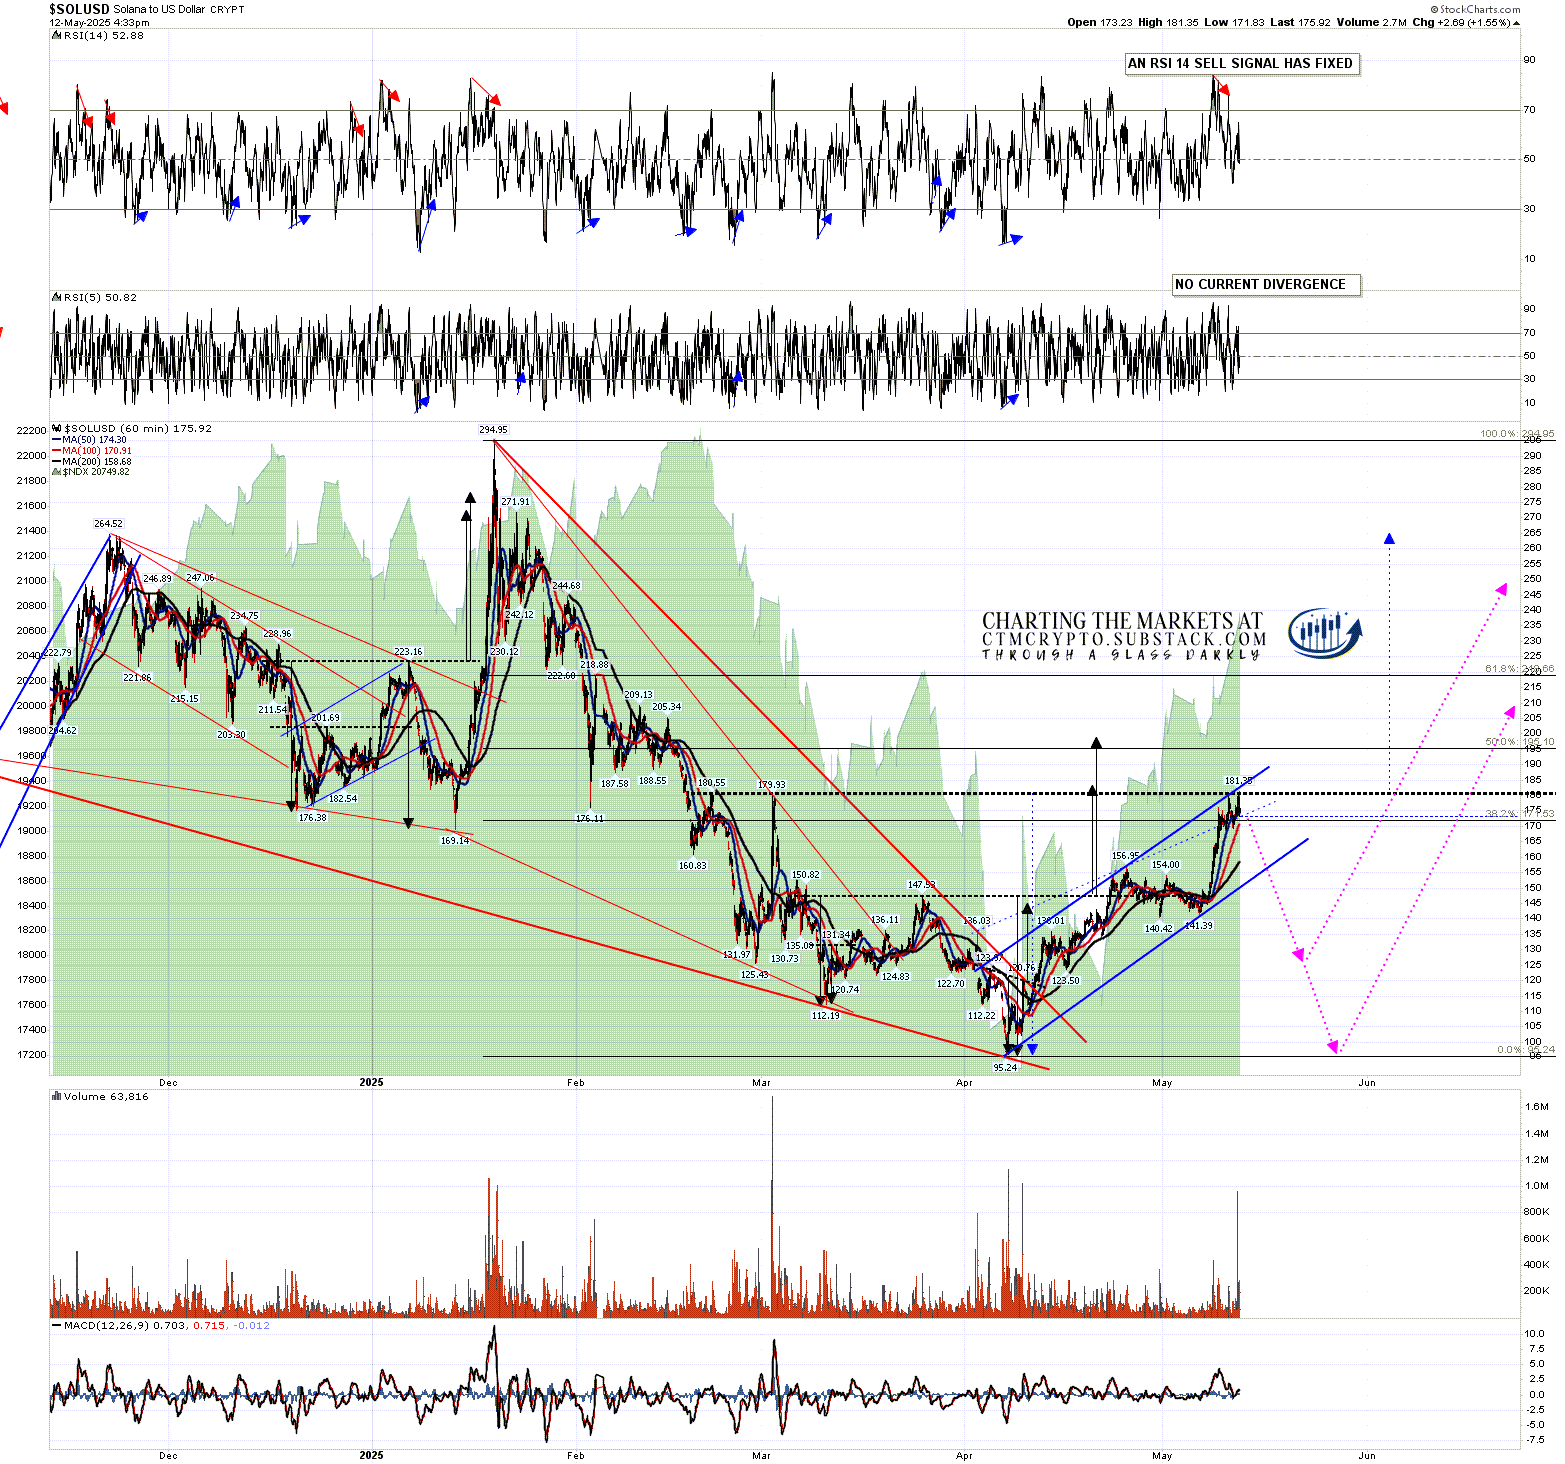
Solana (SOLUSD) almost hit the first double bottom target in the 184 area and may well top out without a full hit. I was seeing main resistance on Solana at the early March high at 179.93, and the 20dma, currently at 181. Solana has held at 181.38 so far. An hourly RSI 14 sell signal then also fixed after Solana hit the 180/1 resistance area.
Now this was very interesting, as I have another very decent quality rising wedge on Solana and, as I mentioned on Friday, the March high at 179.93 is a possible IHS neckline. There is a serious possibility that this will be a retracement to form the right shoulder on a large IHS. The ideal right shoulder low would be in the 125.43 area and on a subsequent sustained break over 182 the IHS target would be in the 265 area. This is a very nice setup.
This rising wedge may alternatively be a bear flag though, so if there was a strong break below 125 then the obvious next target would be a retest of the April low at 95.25.
SOLUSD 60min chart:
I really like looking for confirmation of likely moves on related instruments, so I was very encouraged that the two high quality rising wedges on Bitcoin and Solana were backing each other up.
For that same reason I was very encouraged to see that there is also a possible large IHS forming on Ethereum (ETHUSD)
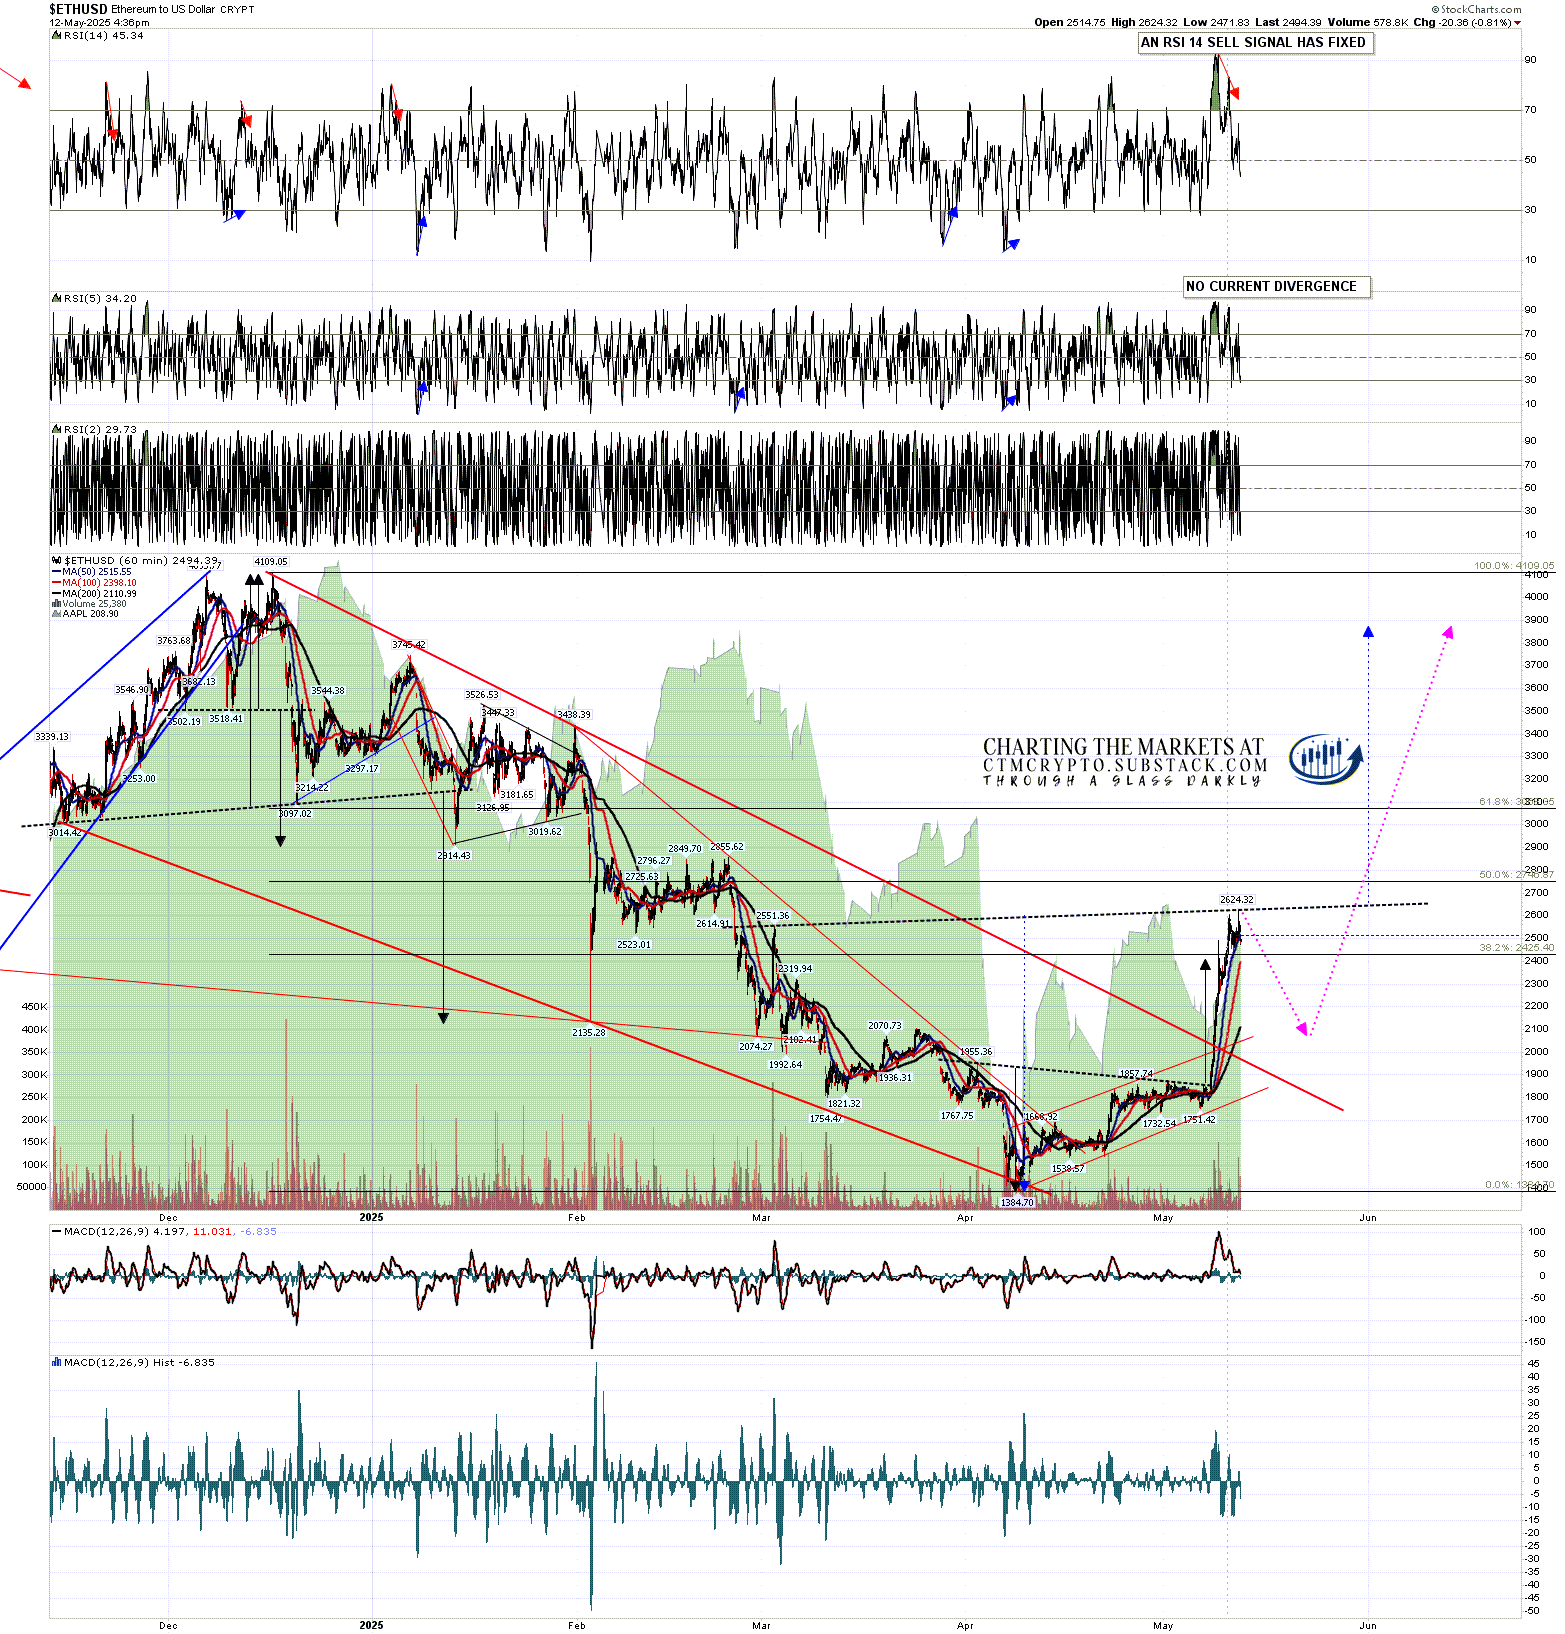
A smaller IHS formed on Ethereum though I missed it befre the break up as the rally on Ethereum has been so weak that I wasn’t giving it enough attention. That broke up suddenly, and very hard, last week, made the IHS target in the 2400 area and topped out at 2624, sightly above the early March high at 2551.
That March high was also a possible large IHS neckline area, as I mentioned on Friday, and a retracement has now started that may well also be to form the right shoulder on that IHS. An hourly RSI 14 sell signal has also fixed and a small double bottom has broken down with a target in the 2250-70 area.
The ideal right shoulder low would be in the 2074.27 area and on a subsequent sustained break over 2650 the IHS target would be in the 38.8k area. Again this is a very nice setup & here there is no obvious bear flag alternative.
ETHUSD 60min chart:
Since I started writing this post the hourly RSI 14 sell signal on Bitcoin has reached target.
Crypto has been moving today and you might currently be thinking that you’d have preferred to have seen all this at the start of the current trading day rather than at the end. Well, anyone who watched my premarket video this morning could see all this before the RTH market open today, and the email with the video also included the charts and explanatory notes. If you’d like to see those in future you just need to join my substack. The link is below.
So far this year I have been and am still leaning towards seeing weakness in the first half of the year and renewed strength in the second half of 2025, with a very possible bull market high on Crypto pencilled in close to the end of the year. That scenario would be a good match with past Crypto bull markets. Is it possible that I am mistaken? Always, but we can only ever try to identify the higher probability paths in the future. Only time can show us the path that is actually taken. Still, I’m with Confucious who said ‘study the past, if you would divine the future’.
If you’d like to see more of these posts and the other Crypto videos and information I post, please subscribe for free to my Crypto substack. I also do a premarket video every day on Crypto at 9.05am EST. If you’d like to see those I post the links every morning on my twitter, and the videos are posted shortly afterwards on my Youtube channel.
I'm also to be found at Arion Partners, though as a student rather than as a teacher. I've been charting Crypto for some years now, but am learning to trade and invest in them directly, and Arion Partners are my guide around a space that might reasonably be compared to the Wild West in one of their rougher years.

No comments:
Post a Comment