
My apologies for this unusually long post. This has been a very interesting week on Crypto and there is a lot to look at. I did consider splitting this into two shorter posts but decided it is better to just do a longer post today.
In my last post on Monday 12th May I was looking at the possibility that large IHS reversal patterns might be forming on Solana (SOLUSD) and Ethereum (ETHUSD), and that there might be a large retracement across the board on those two and Bitcoin (BTCUSD) while right shoulders were established on those IHS patterns.
Last Friday, as the modest retracement we have seen this week on equities was setting up, my working assumption was that this retracement on Crypto would happen mostly as that retracement played out on equities, as the retracement between Crypto and equity indices is historically very strong, but that didn’t deliver as I expected and while what did happen was interesting, what didn’t happen was potentially much more interesting. Let’s have a look at that.
What did happen was primarily that Bitcoin made a new all time high. I was expecting that in coming weeks in any case and mentioned that the retracement on Bitcoin clearly looked like a bullish consolidation in my posts on 20th Feb, in detail in my posts on 25th Feb and 28th Feb, and on all of my posts and many of my premarket videos since. That bullish consolidation has now delivered the promised new all time high.
Could this be the second high of a large double top? Possibly though I’m not currently seeing much reason to think so. Historically bull market highs on Crypto occur around December and while the high in January might just have qualified, a high here would not. There are exceptions to every rule of course, but I’m really not seeing much reason to see this as a candidate bull market top yet.
BTCUSD weekly chart:
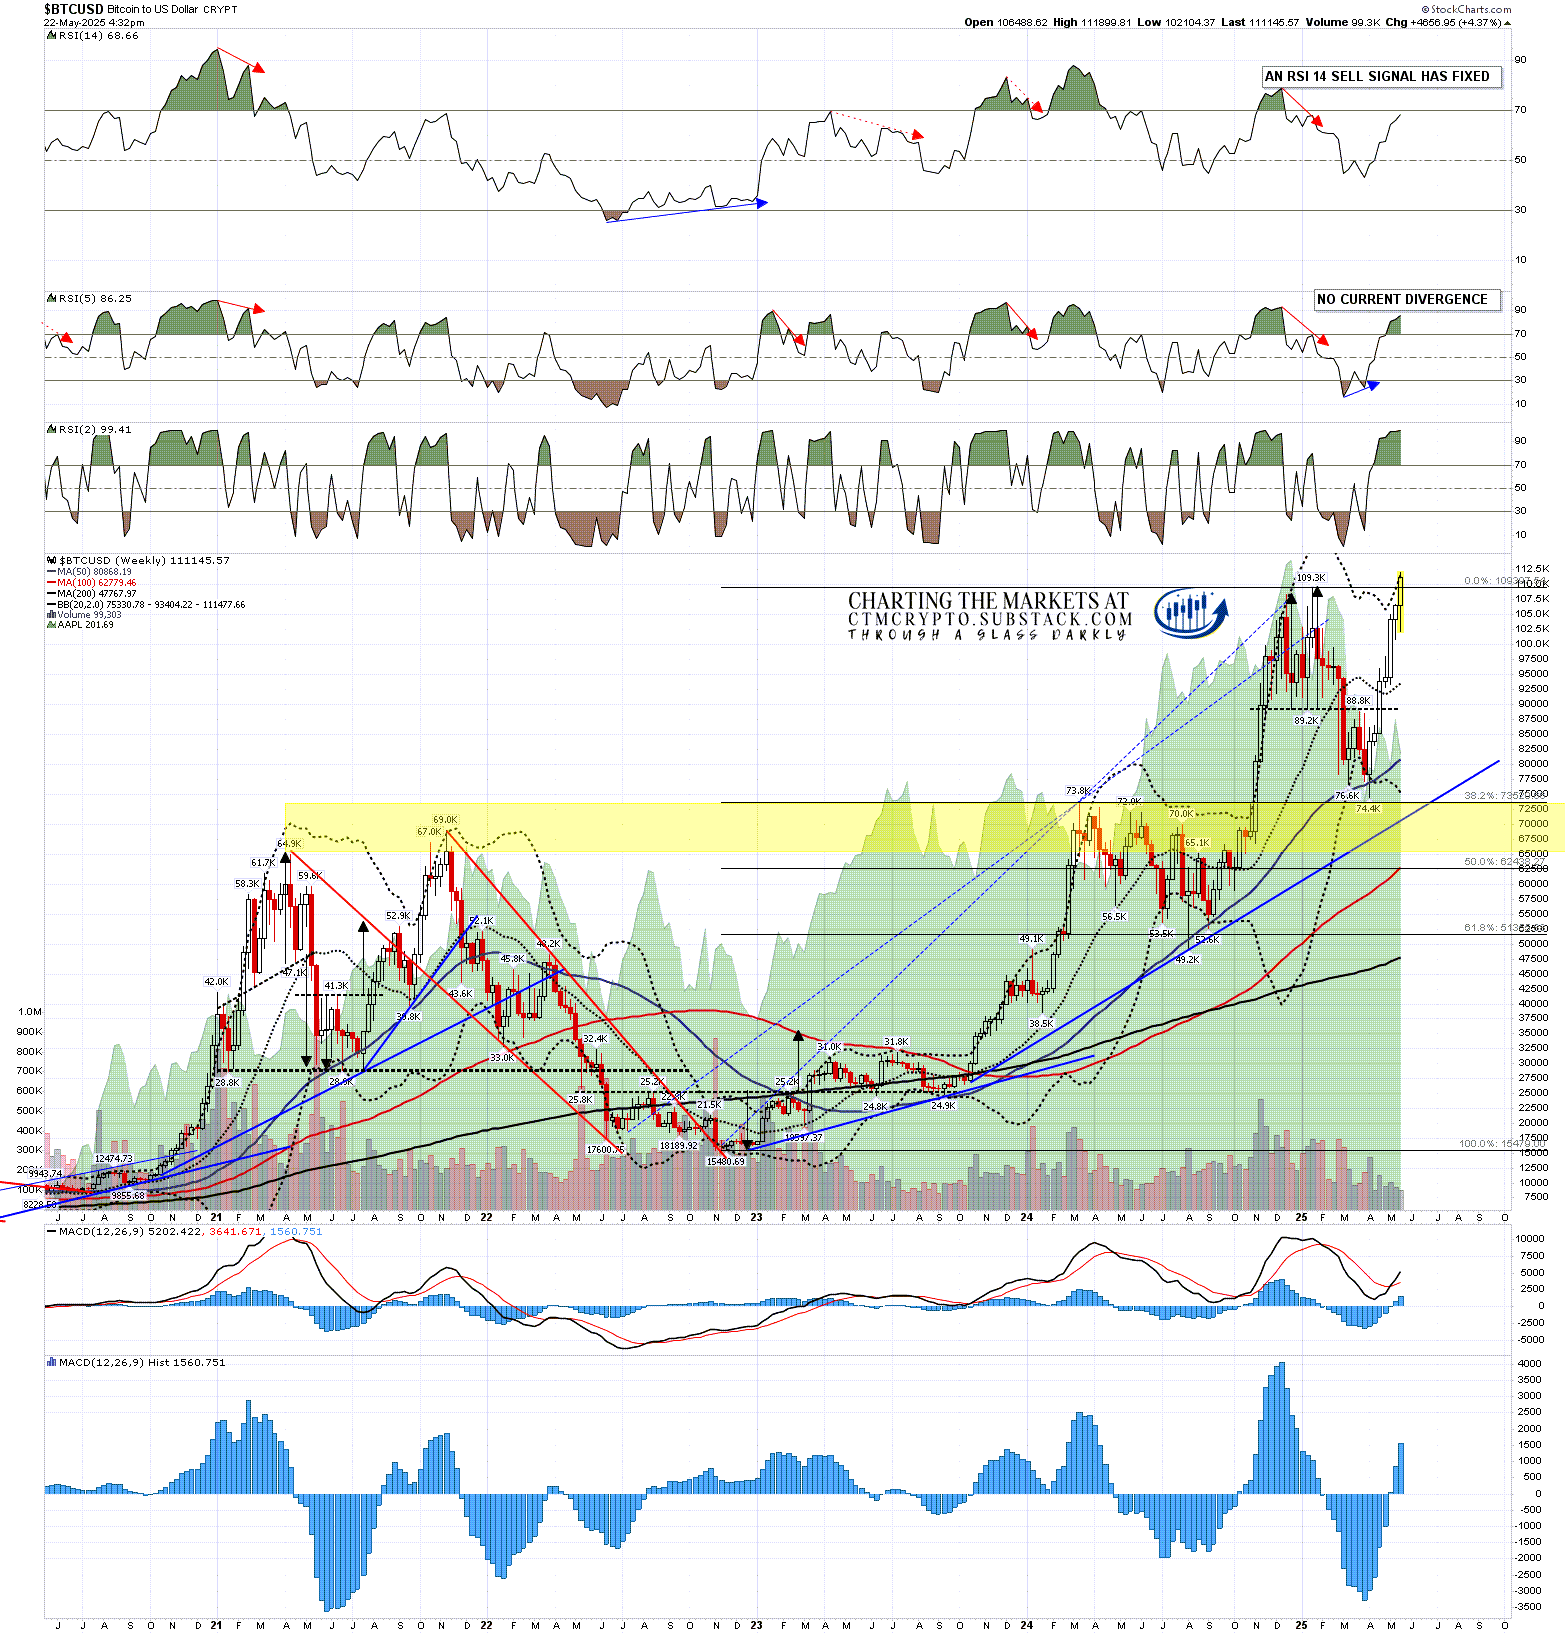
The main thing that didn’t happen over the last few days of course is that while equities have taken a brief pause in this wild move up since it began when most of the ‘reciprocal’ tariffs were delayed, Bitcoin has not. The correlation between Bitcoin and equity indices is strong though not perfect of course, as you can see on the chart below with AAPL prices used as the background on the chart.
I have mentioned in posts regularly this year, including in my last post, that Crypto may decouple from equity prices this year as trouble grows in the US Treasuries markets, and this might be an early sign that decoupling is starting to happen and that Bitcoin particularly may be starting to be treated as a flight to safety destination when there is trouble elsewhere. There was a lot of trouble in bond markets yesterday of course so this has me wondering.
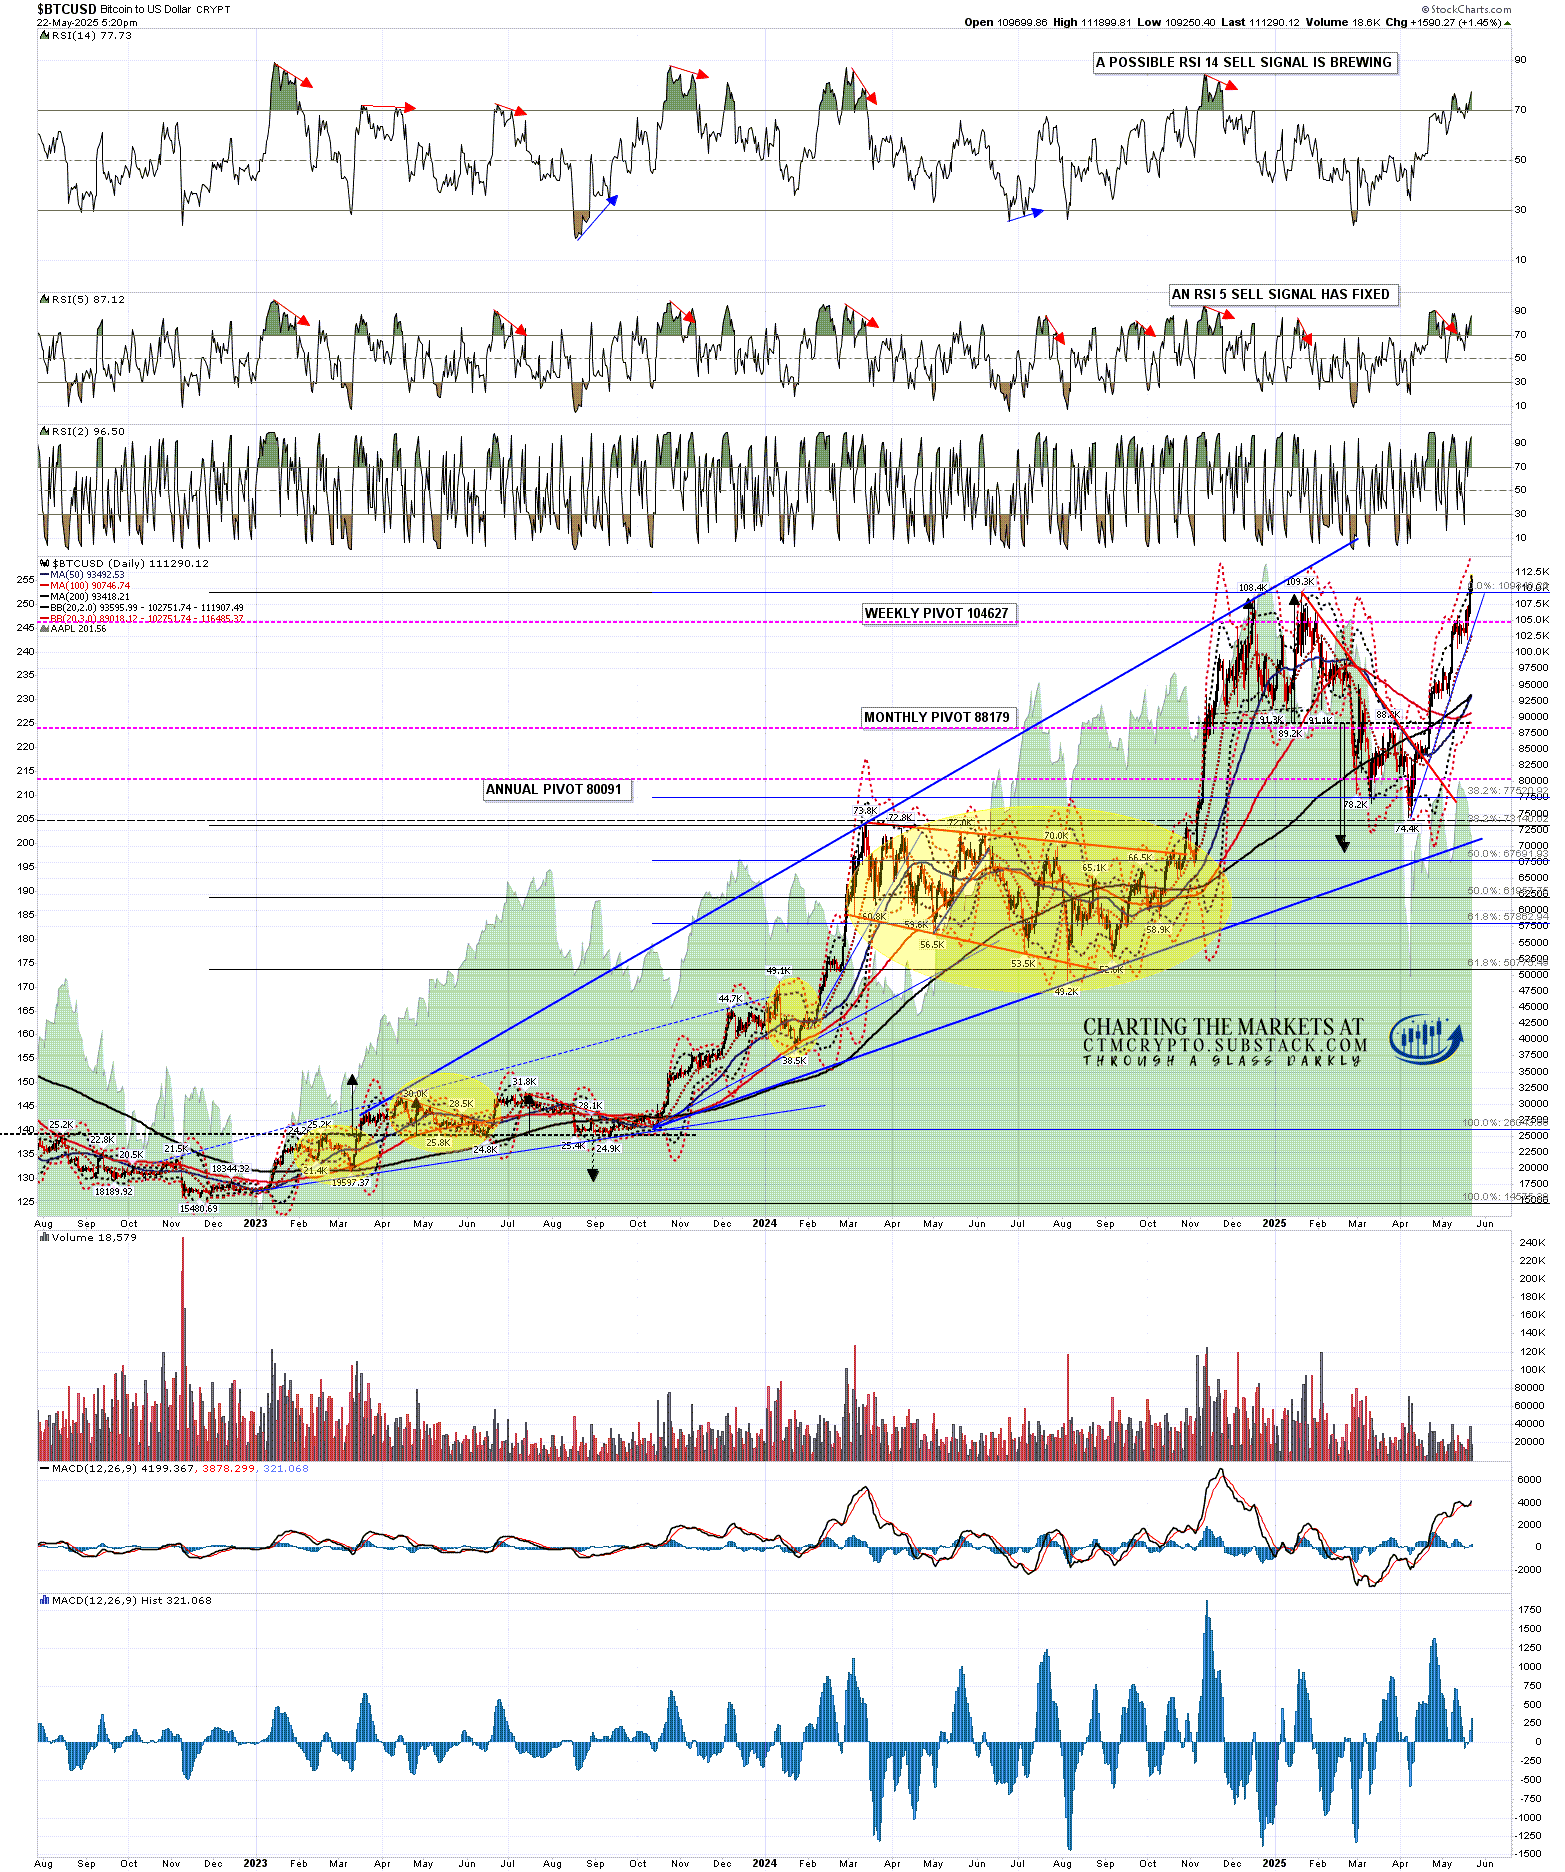
In the short term there is still a daily RSI 5 sell signal fixed on Bitcoin and yesterday there was also a possible daily RSI 14 sell signal brewing. If Bitcoin closes at current levels as I write, that RSI 14 negative divergence will be lost at the close today and if Bitcoin goes much higher the RSI 5 sell signal will likely fail too.
BTCUSD daily chart:
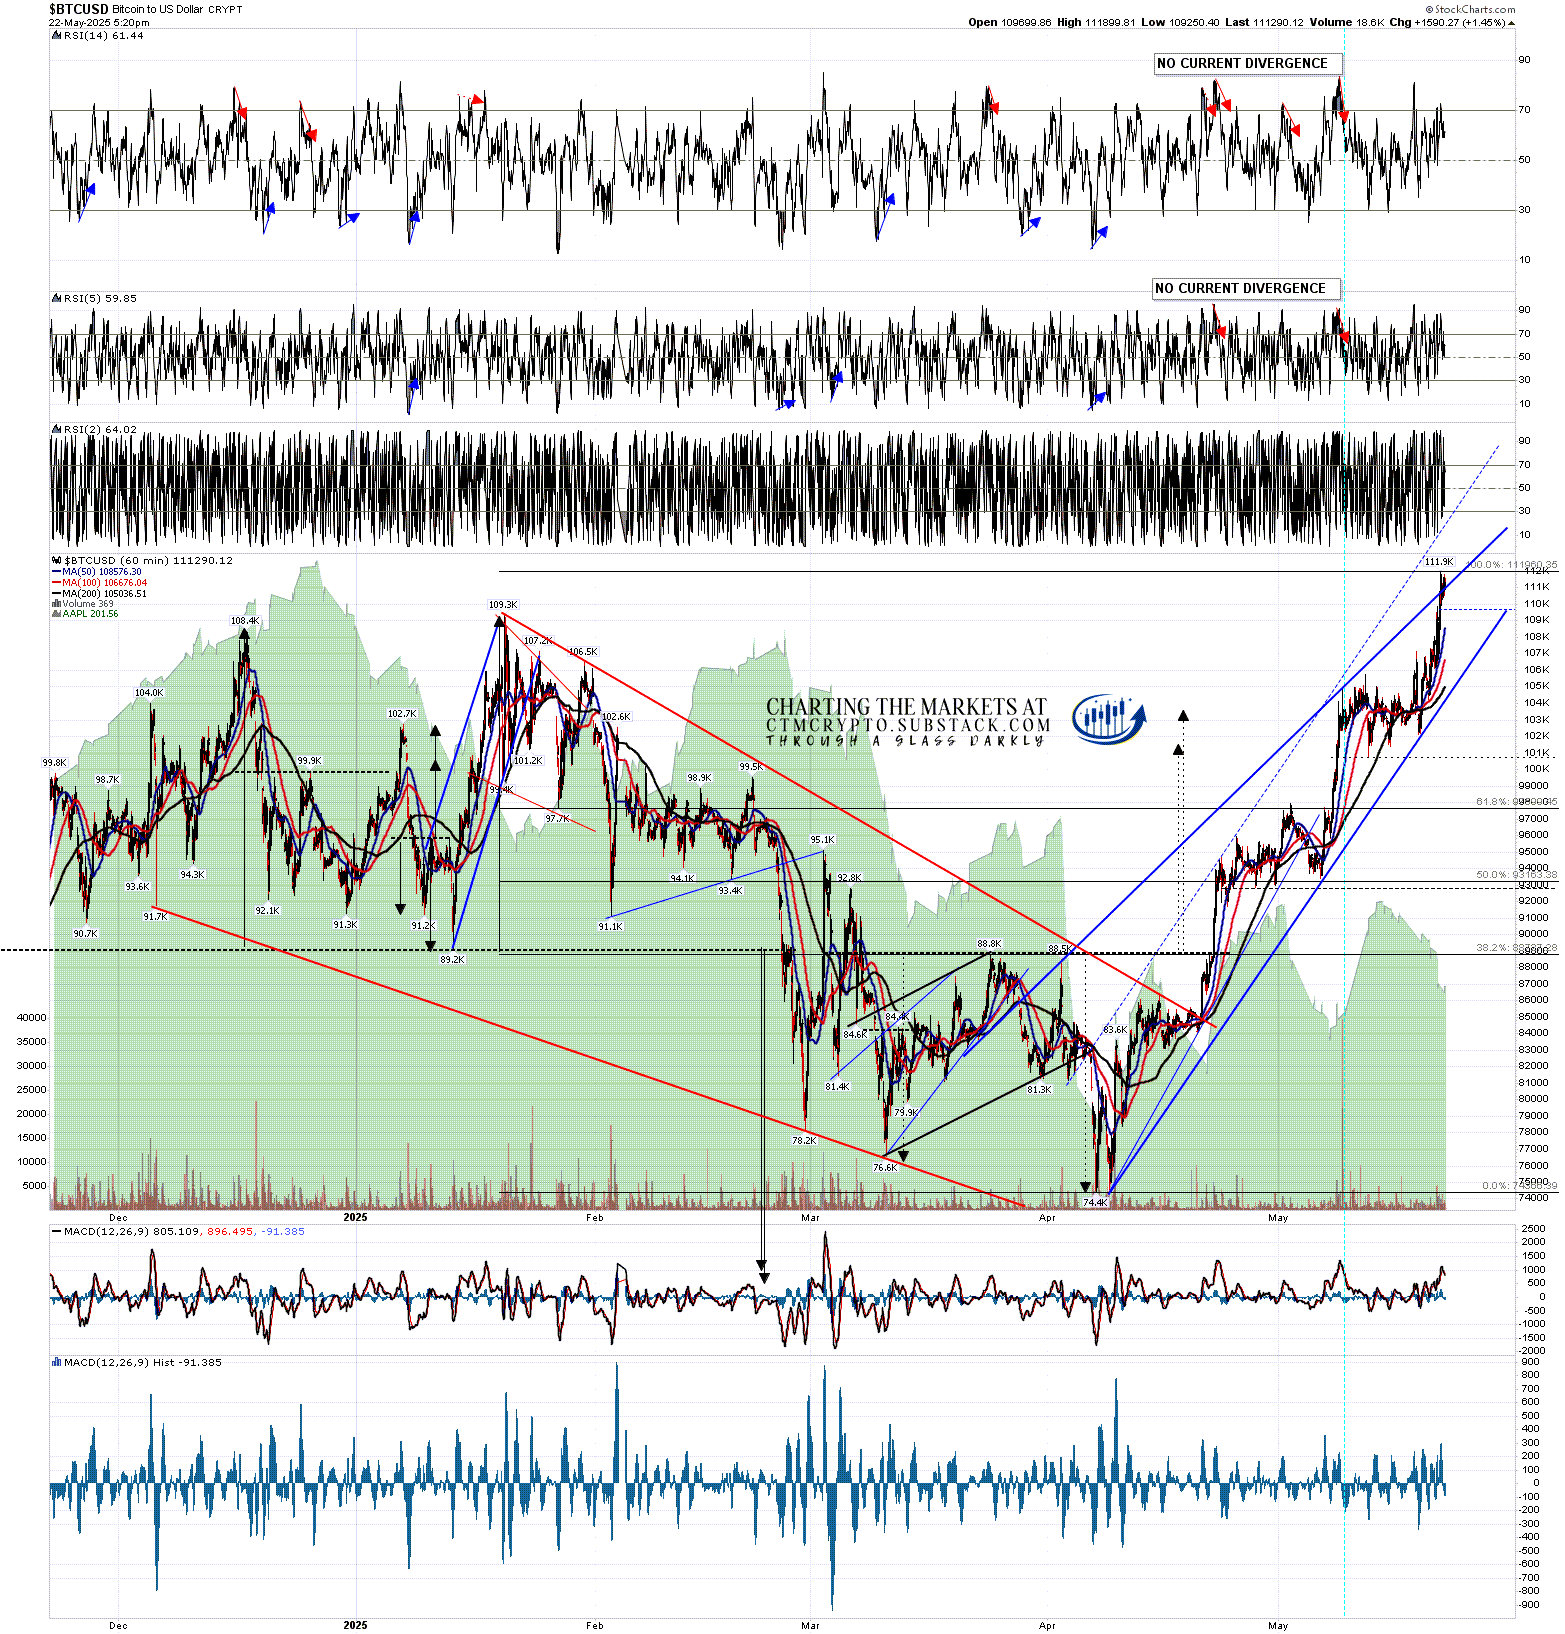
The hourly chart is very interesting. I’ve been watching this closely in my premarket videos every morning and if you’ve been watching those you’ll know that there is a high quality rising wedge from the April low and that Bitcoin tested and held wedge support at the lows on Monday. I mentioned that unless that trendline support broke then the next obvious target within this rising wedge would be wedge resistance, which was hit and broken slightly last night.
I have marked in on the chart below a possible alternate resistance trendline but the obvious trendline was the original one I posted, so this might be a bearish overthrow signalling that a break down and retracement from this rising wedge may be coming next.
There is a possibility of course that Bitcoin is taking the lower probability option of breaking up from the rising wedge in which case the wedge target would be in the 145k area.
BTCUSD 60min chart:
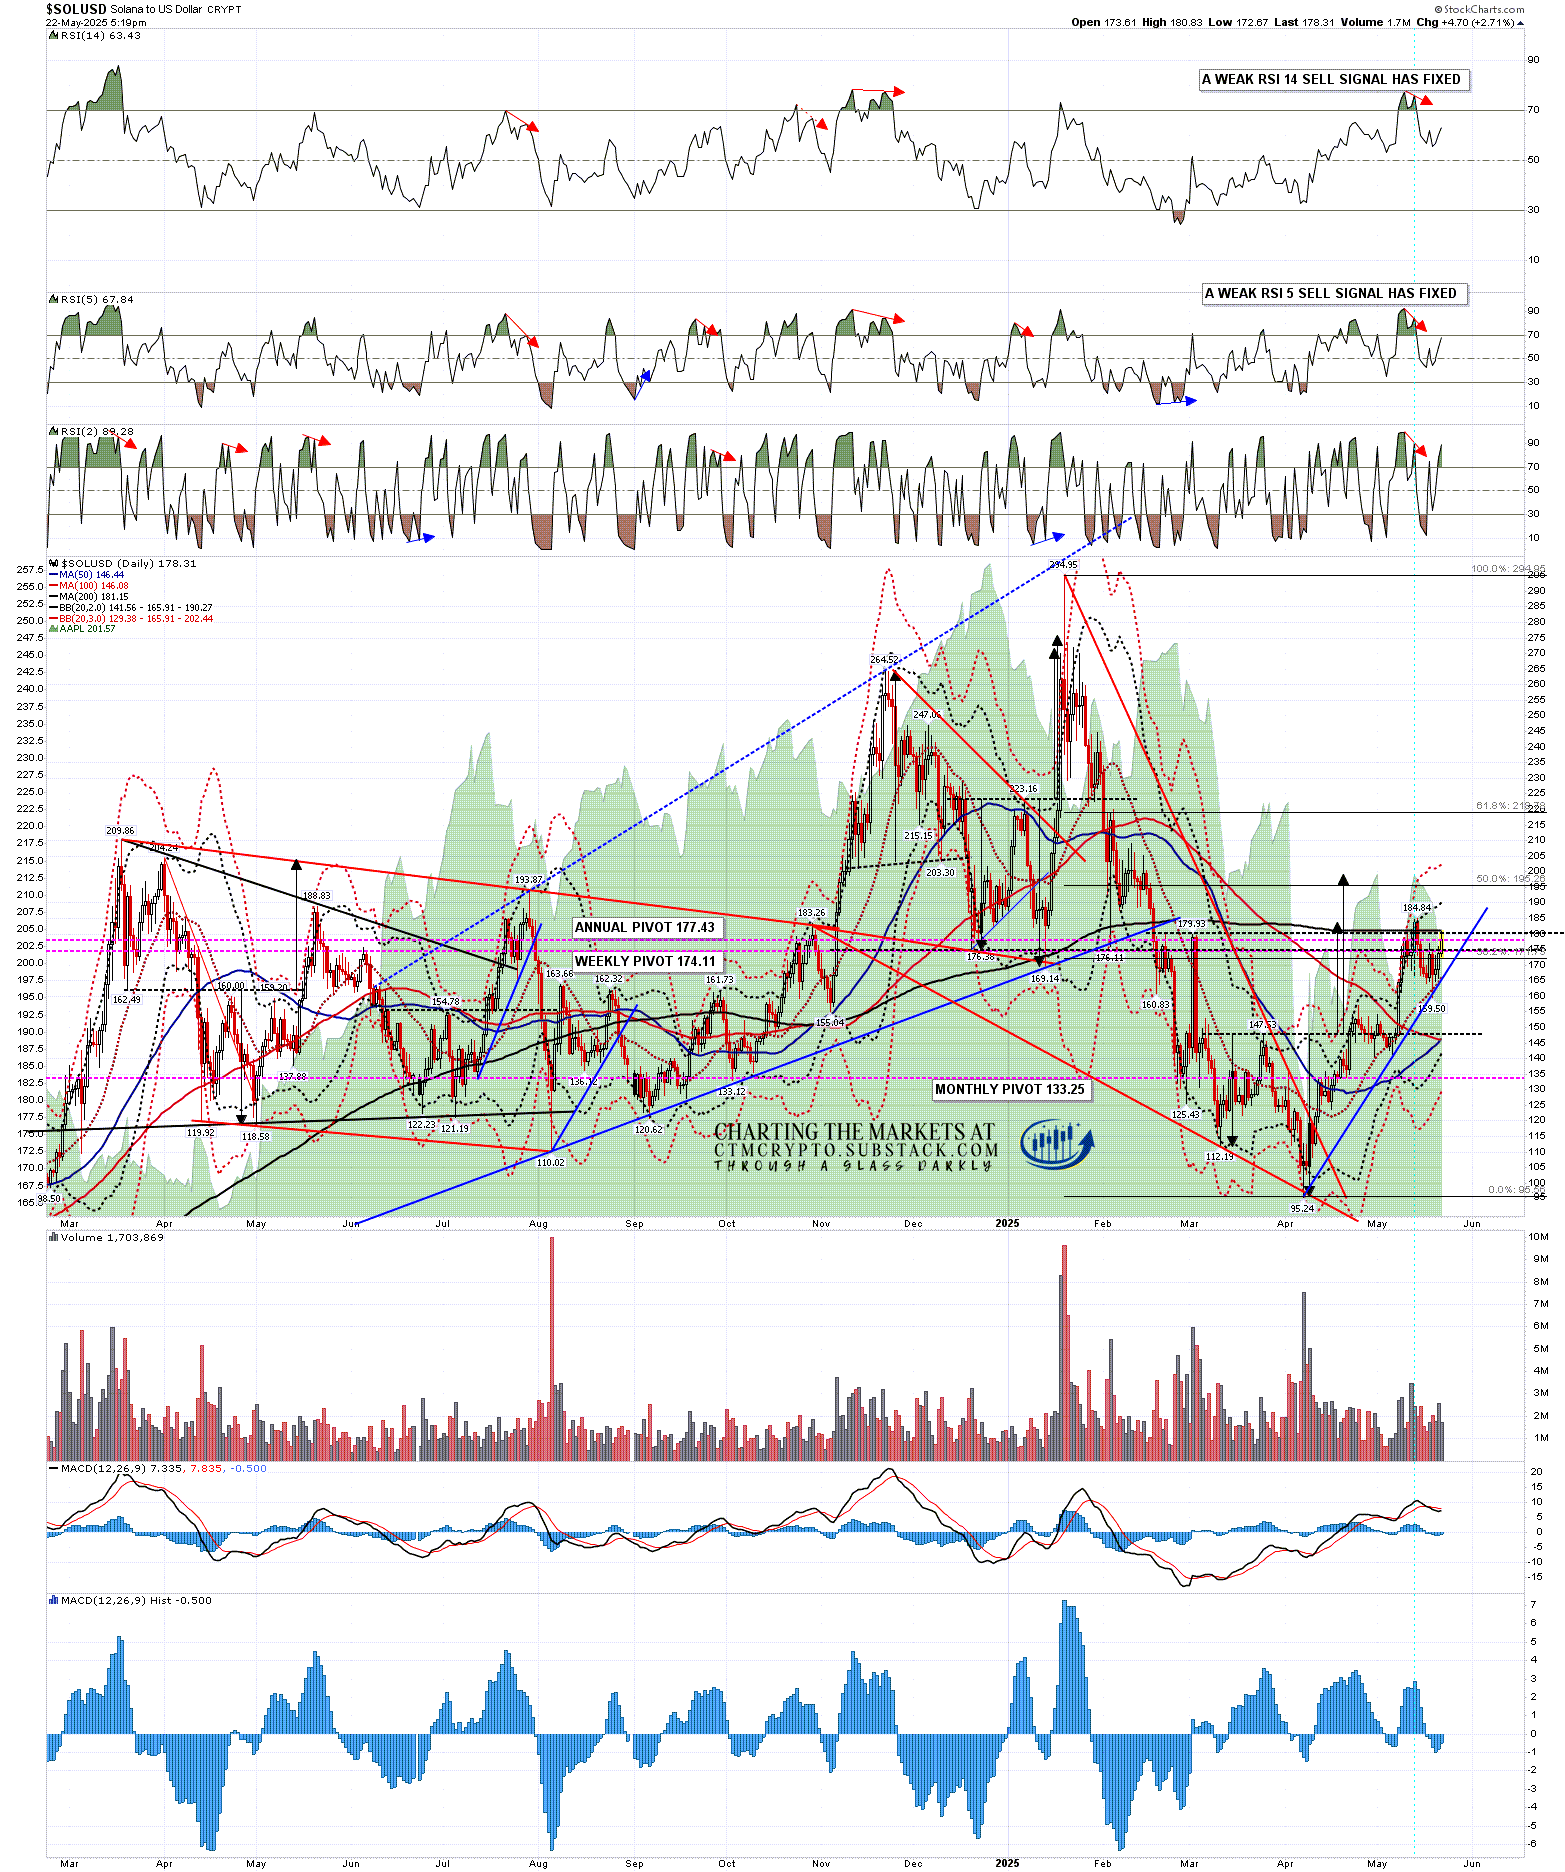
On the Solana daily chart weak RSI 14 and RSI 5 sell signals have fixed and Solana is currently stalled just under the 200dma, currently at 181.15. This is main resistance and may hold for now, though I’d be expecting this to break and convert to support in any case later.
SOLUSD daily chart:
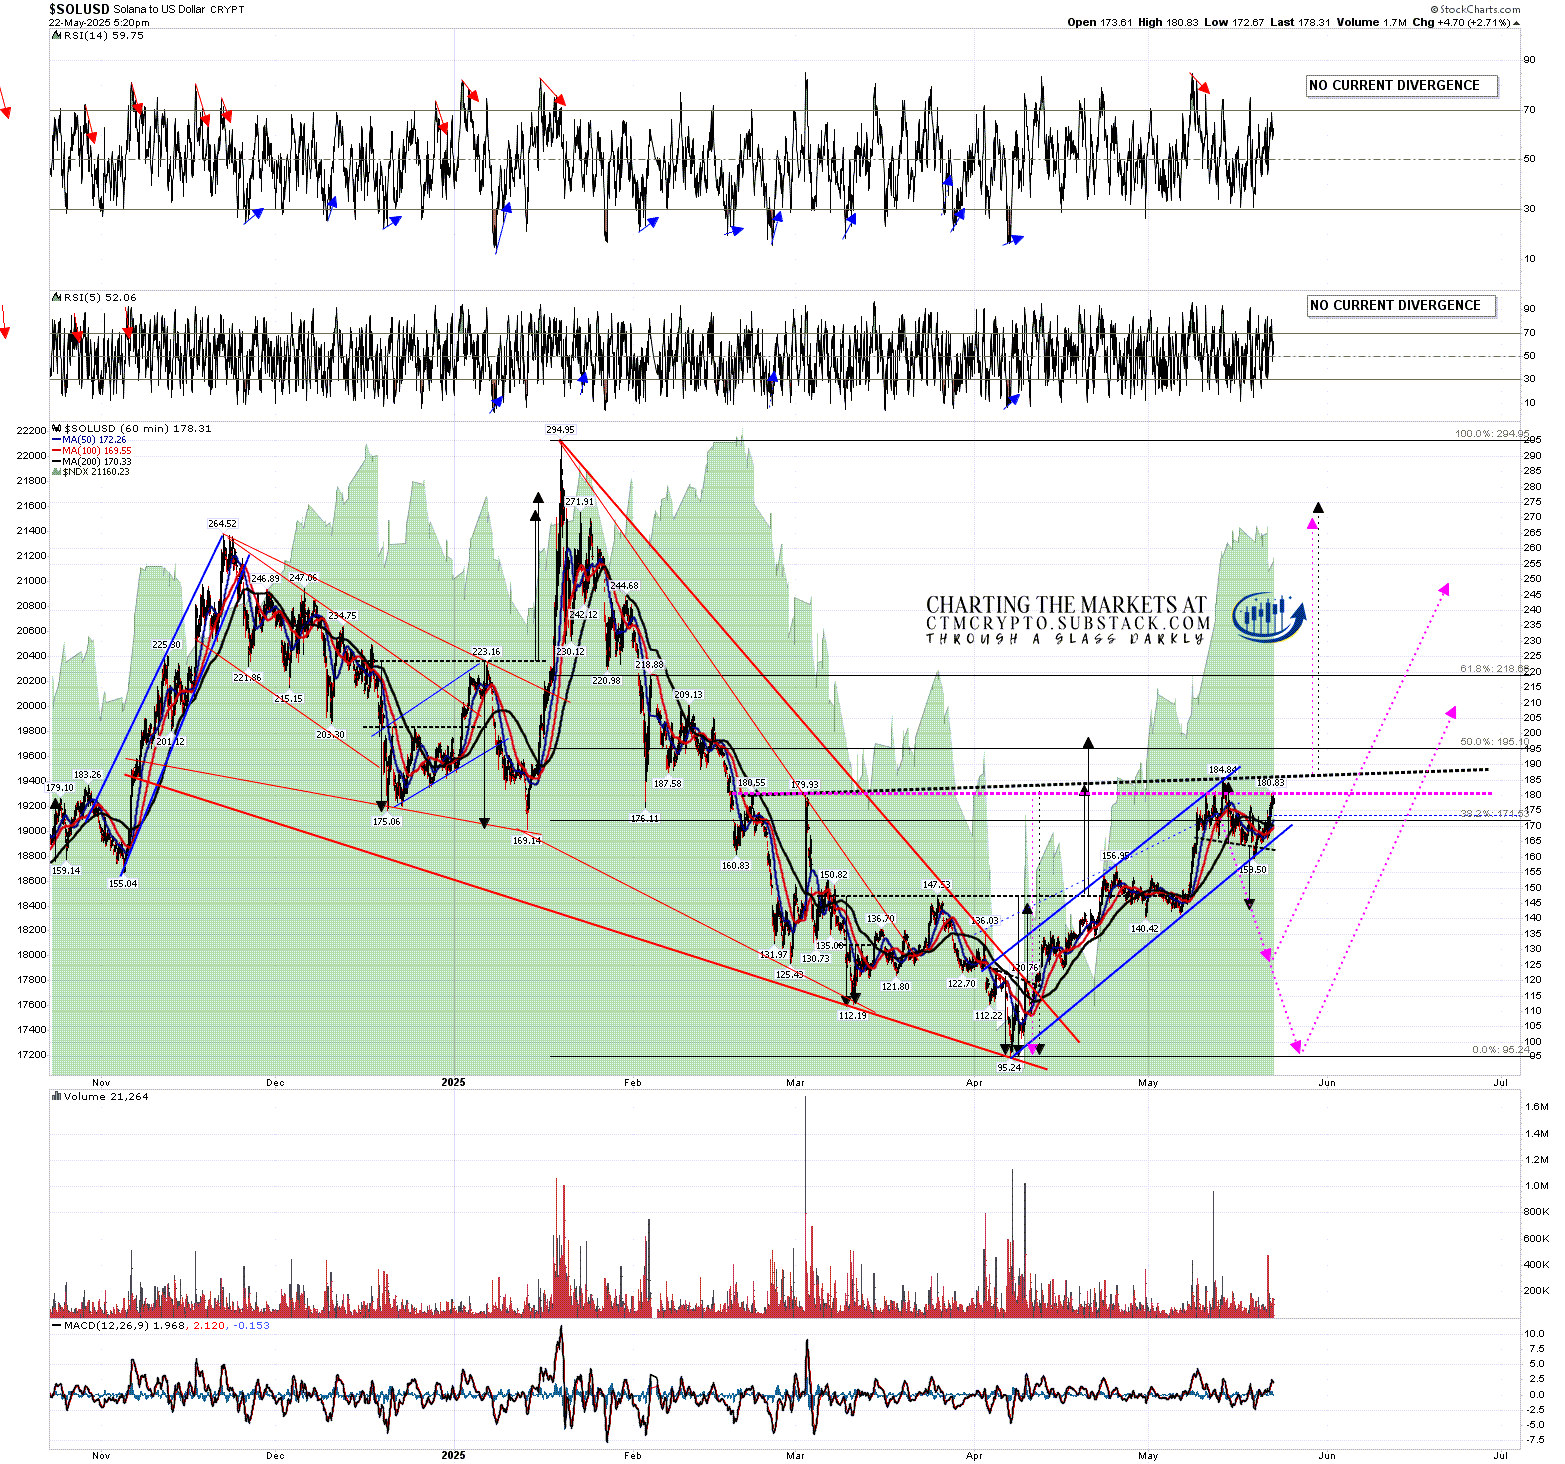
On the Solana hourly chart I drew in a possible path for an IHS right shoulder retracement in my post last week and I’ve left that neckline and arrows on the chart in purple, while adding the updated possible IHS as we see it now in black. The right shoulder so far is much smaller than the left and didn’t get anywhere close to the ideal right shoulder low so far but the IHS would still be valid on a break up directly from here and the IHS target would be in the 275 area, close to a retest of January’s all time high at 294.95.
A small H&S broke down with a target in the 142 area and failed overnight but this looks likely a bull flag forming on Solana and, that being the case, it is possible that we may see a further lower low under 158.50 before this bull flag breaks up.
SOLUSD 60min chart:
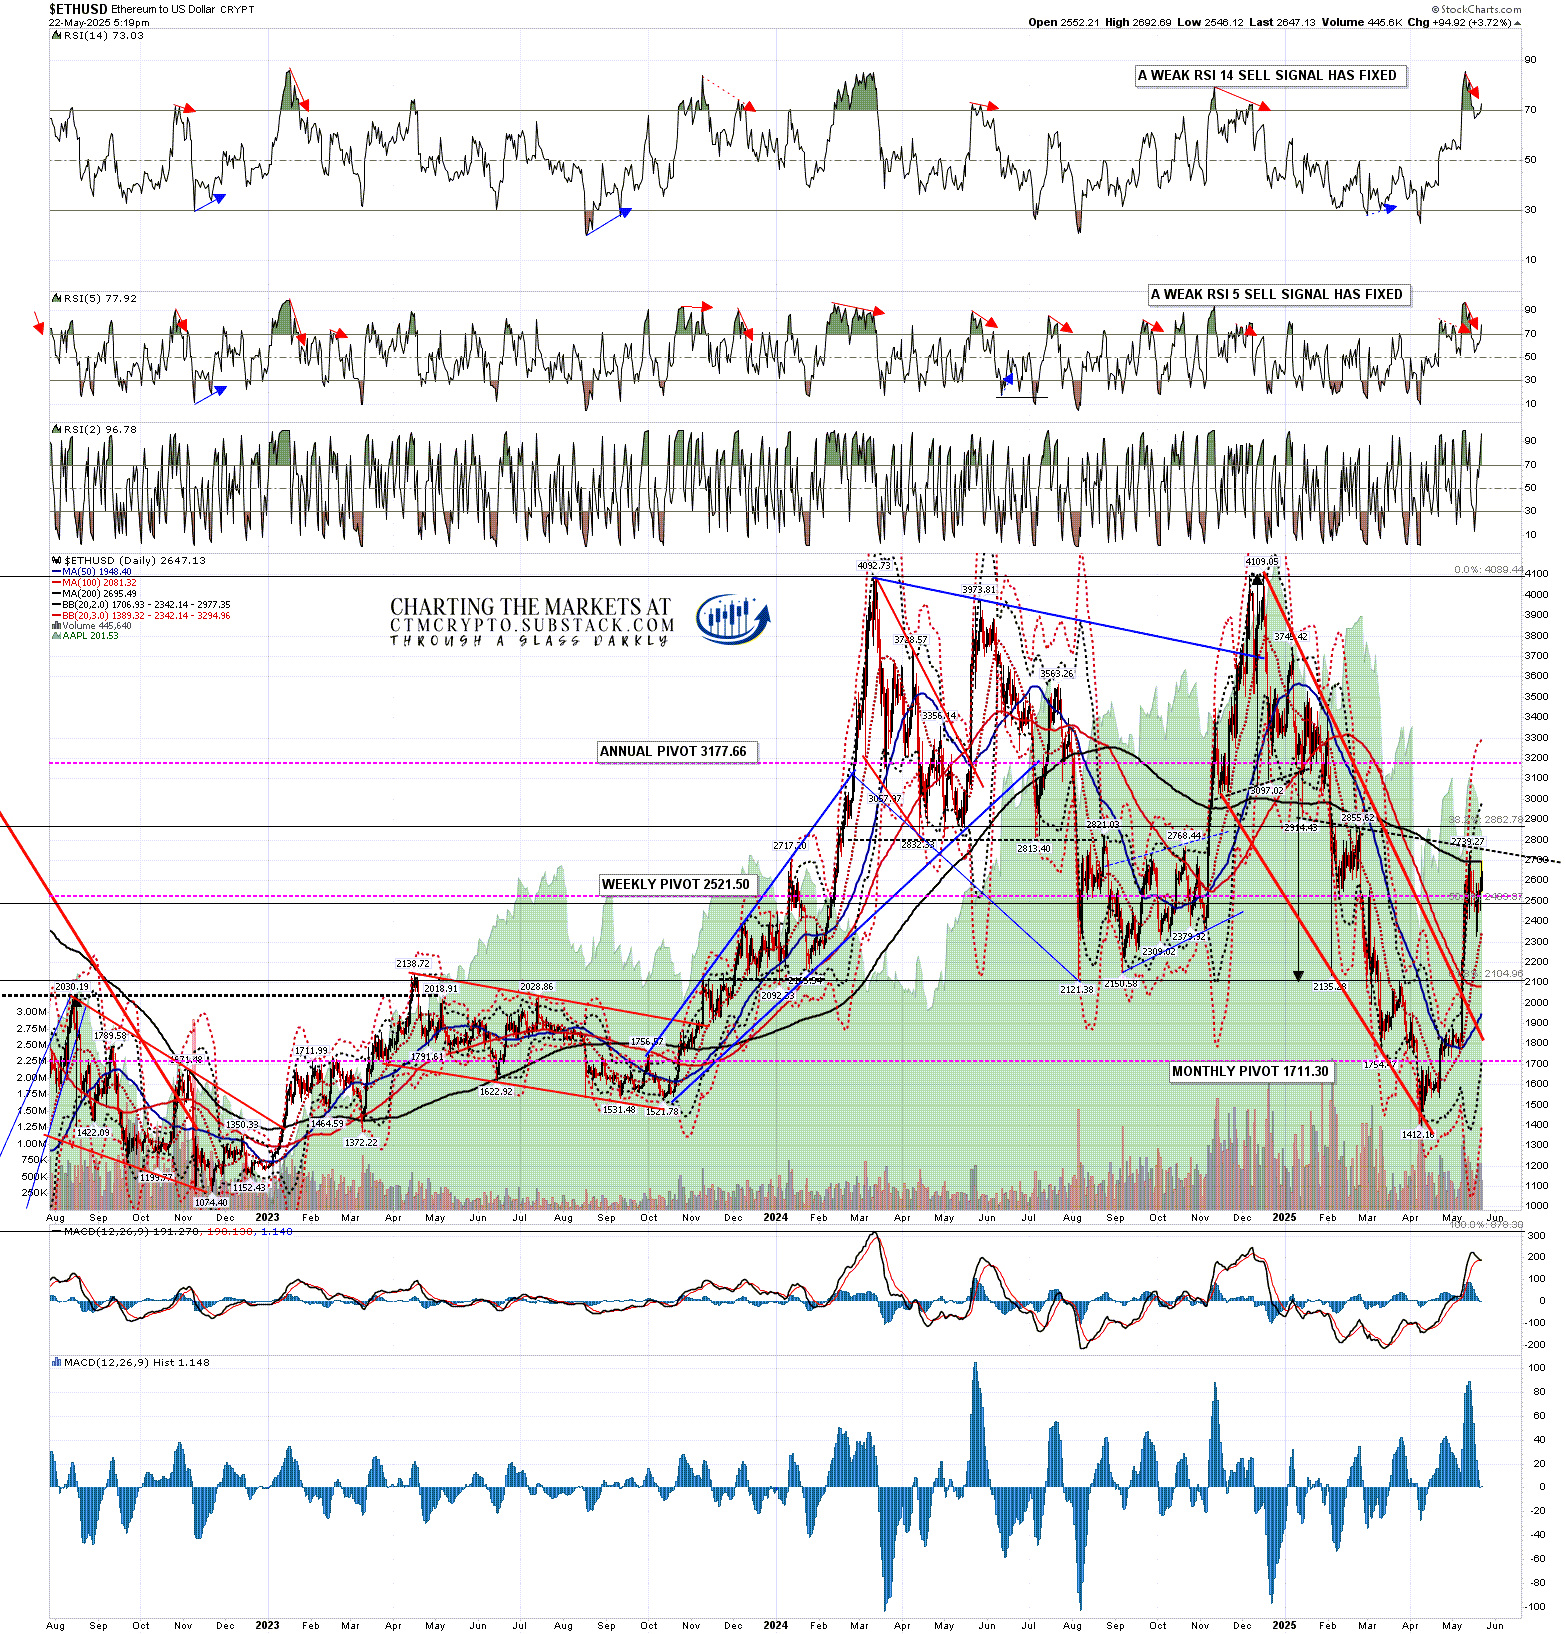
On the Ethereum daily chart weak RSI 14 and RSI 5 sell signals have also fixed and Ethereum is also currently stalled just under the 200dma, currently at 2695.49. This is main resistance and may hold for now, though I’d be expecting this to break and convert to support in any case later.
ETHUSD daily chart:
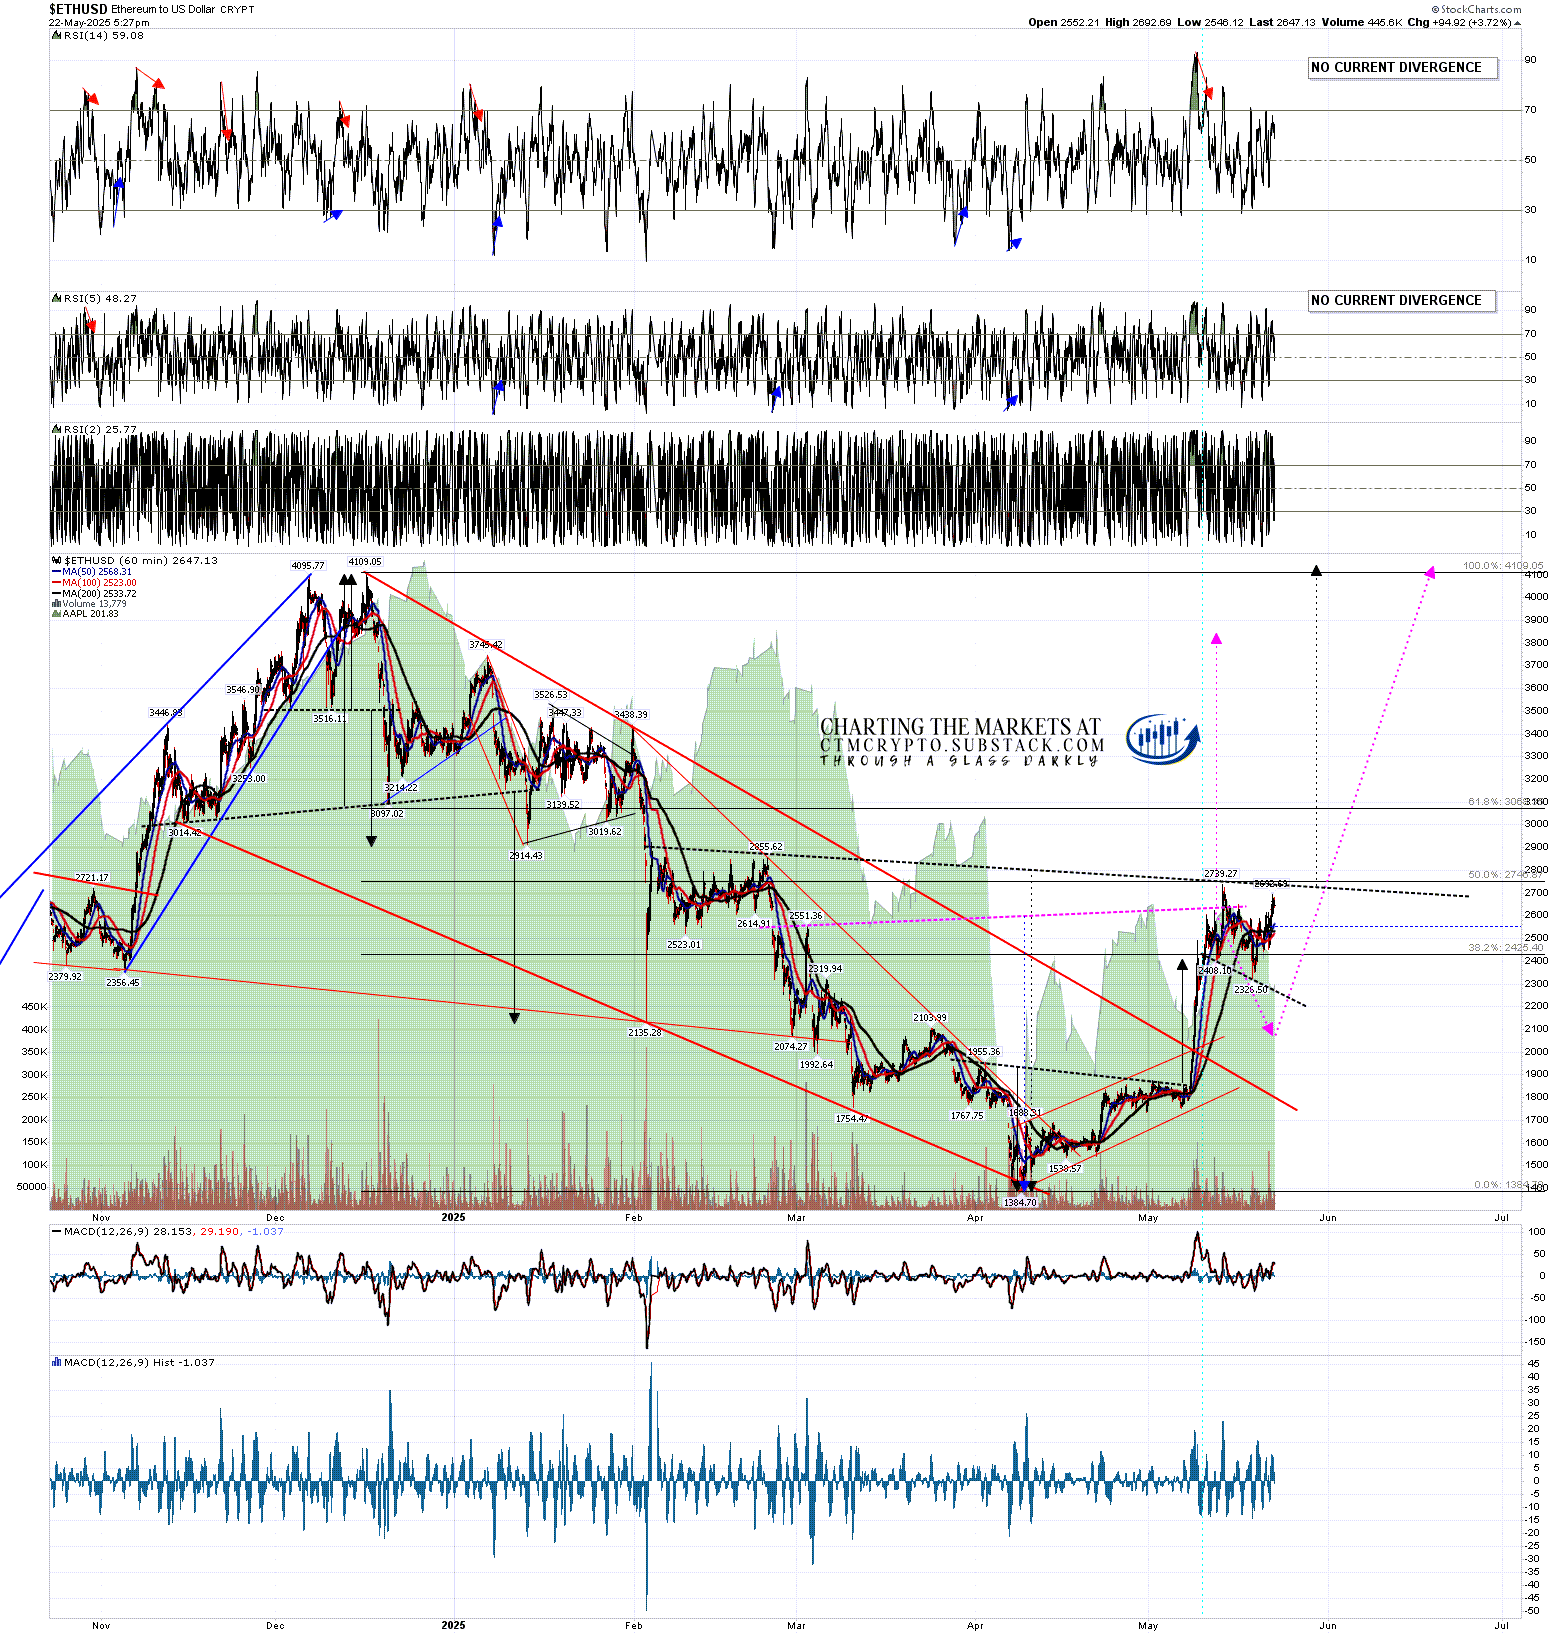
On the Ethereum hourly chart I drew in a possible path for an IHS right shoulder retracement in my post last week and I’ve left that neckline and arrows on the chart in purple, while adding the updated possible IHS (with a different neckline) as we see it now in black. The right shoulder so far is much smaller than the left and didn’t get anywhere close to the ideal right shoulder low so far but the IHS would still be valid on a break up directly from here and the IHS target would be at a retest of the December high at 4109.05.
ETHUSD 60min chart:
So what are the takeaways here? The bull market in Crypto demonstrably didn’t end in January and likely isn’t ending here either. There is a strong bullish setup in place that may support a big move up in all three of these instruments overall in the next few months.
What does it mean if Crypto is decoupling from equity indices over the next few months? Mainly it means that Crypto would increasingly start to fall as equities rise and rise when equities fall. As I like the upside prospects on Crypto a LOT better than the prospects on equities over the rest of 2025 that might be a very good thing for Crypto.
So far this year I have been and am still leaning towards seeing weakness in the first half of the year and renewed strength in the second half of 2025, with a very possible bull market high on Crypto pencilled in close to the end of the year. That scenario would be a good match with past Crypto bull markets. Is it possible that I am mistaken? Always, but we can only ever try to identify the higher probability paths in the future. Only time can show us the path that is actually taken. Still, I’m with Confucious who said ‘study the past, if you would divine the future’. - 22nd May 2025 - IDEALLY THE PATH FROM HERE TAKES CRYPTO INTO A BULL MARKET HIGH IN OR CLOSE TO DECEMBER 2025
If you’d like to see more of these posts and the other Crypto videos and information I post, please subscribe for free to my Crypto substack. I also do a premarket video every day on Crypto at 9.05am EST. If you’d like to see those I post the links every morning on my twitter, and the videos are posted shortly afterwards on my Youtube channel.
I'm also to be found at Arion Partners, though as a student rather than as a teacher. I've been charting Crypto for some years now, but am learning to trade and invest in them directly, and Arion Partners are my guide around a space that might reasonably be compared to the Wild West in one of their rougher years.

No comments:
Post a Comment