
In my post on Wednesday 22nd October I was looking at the major support being tested on Bitcoin (BTCUSD), Solana (SOLUSD), and Ethereum (ETHUSD), and saying that sustained breaks below those support levels would boost the case that the bull market on Crypto has already ended, barring possible high retests as part of the topping process. This was and is a major inflection point, and the direction of the break from this inflection point is still in the balance.
I was noting that the last two bull market highs on Bitcoin were in December 2017 and November 2021, close to the end of the year and four years apart, so the end of 2025 is the obvious period to be looking for an end to the current bull market, and I’ve had that pencilled in at the likely topping area all year.
In my last post on Thursday 30th October I was looking in detail at the key support levels on the weekly and daily charts and looking at the possible H&S patterns forming on the Solana and Ethereum charts.
Today all three of these are at the bottom of the inflection point, with Bitcoin well under the 200dma, and both Solana and Ethereum having completed and broken down from those H&S patterns with targets a long way lower. At this point I’m expecting that either they reject near here back into high retests, or continue down towards those targets and the double top target on Bitcoin, in which case the current bull market on Crypto has likely ended a few weeks earlier than I expected.
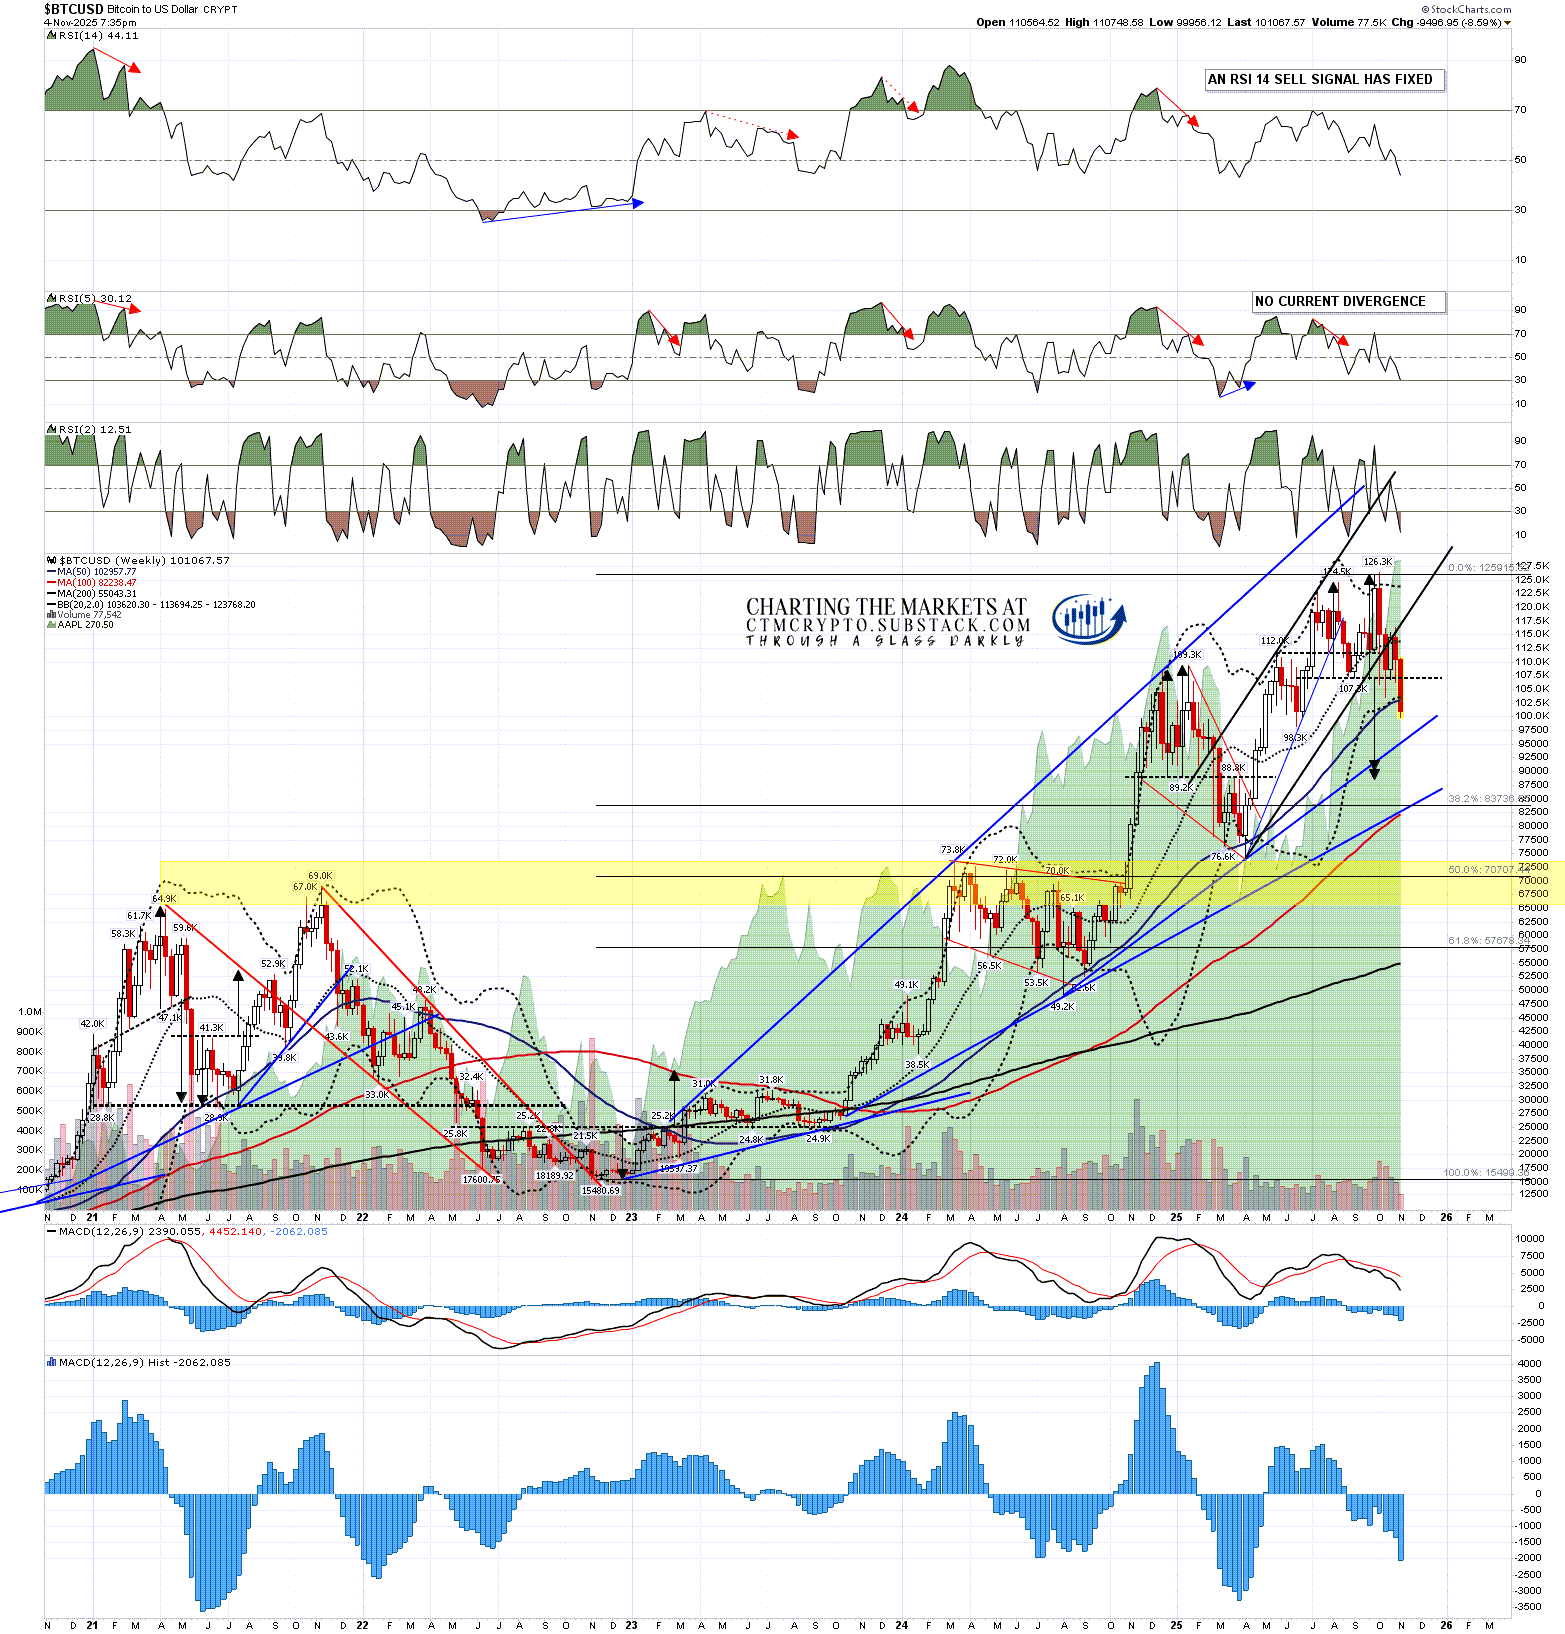
On Bitcoin the 200dma, currently at 109.990 has broken hard and Bitcoin is also currently below the key 50 week MA, currently at 102,958. This held on the last bull market until after the final high and a closing (weekly close on Sunday night) below the 50 week MA would be a very significant support break. At the time of writing Bitcoin is also testing the psychologically important 100k level.
BTCUSD weekly chart:
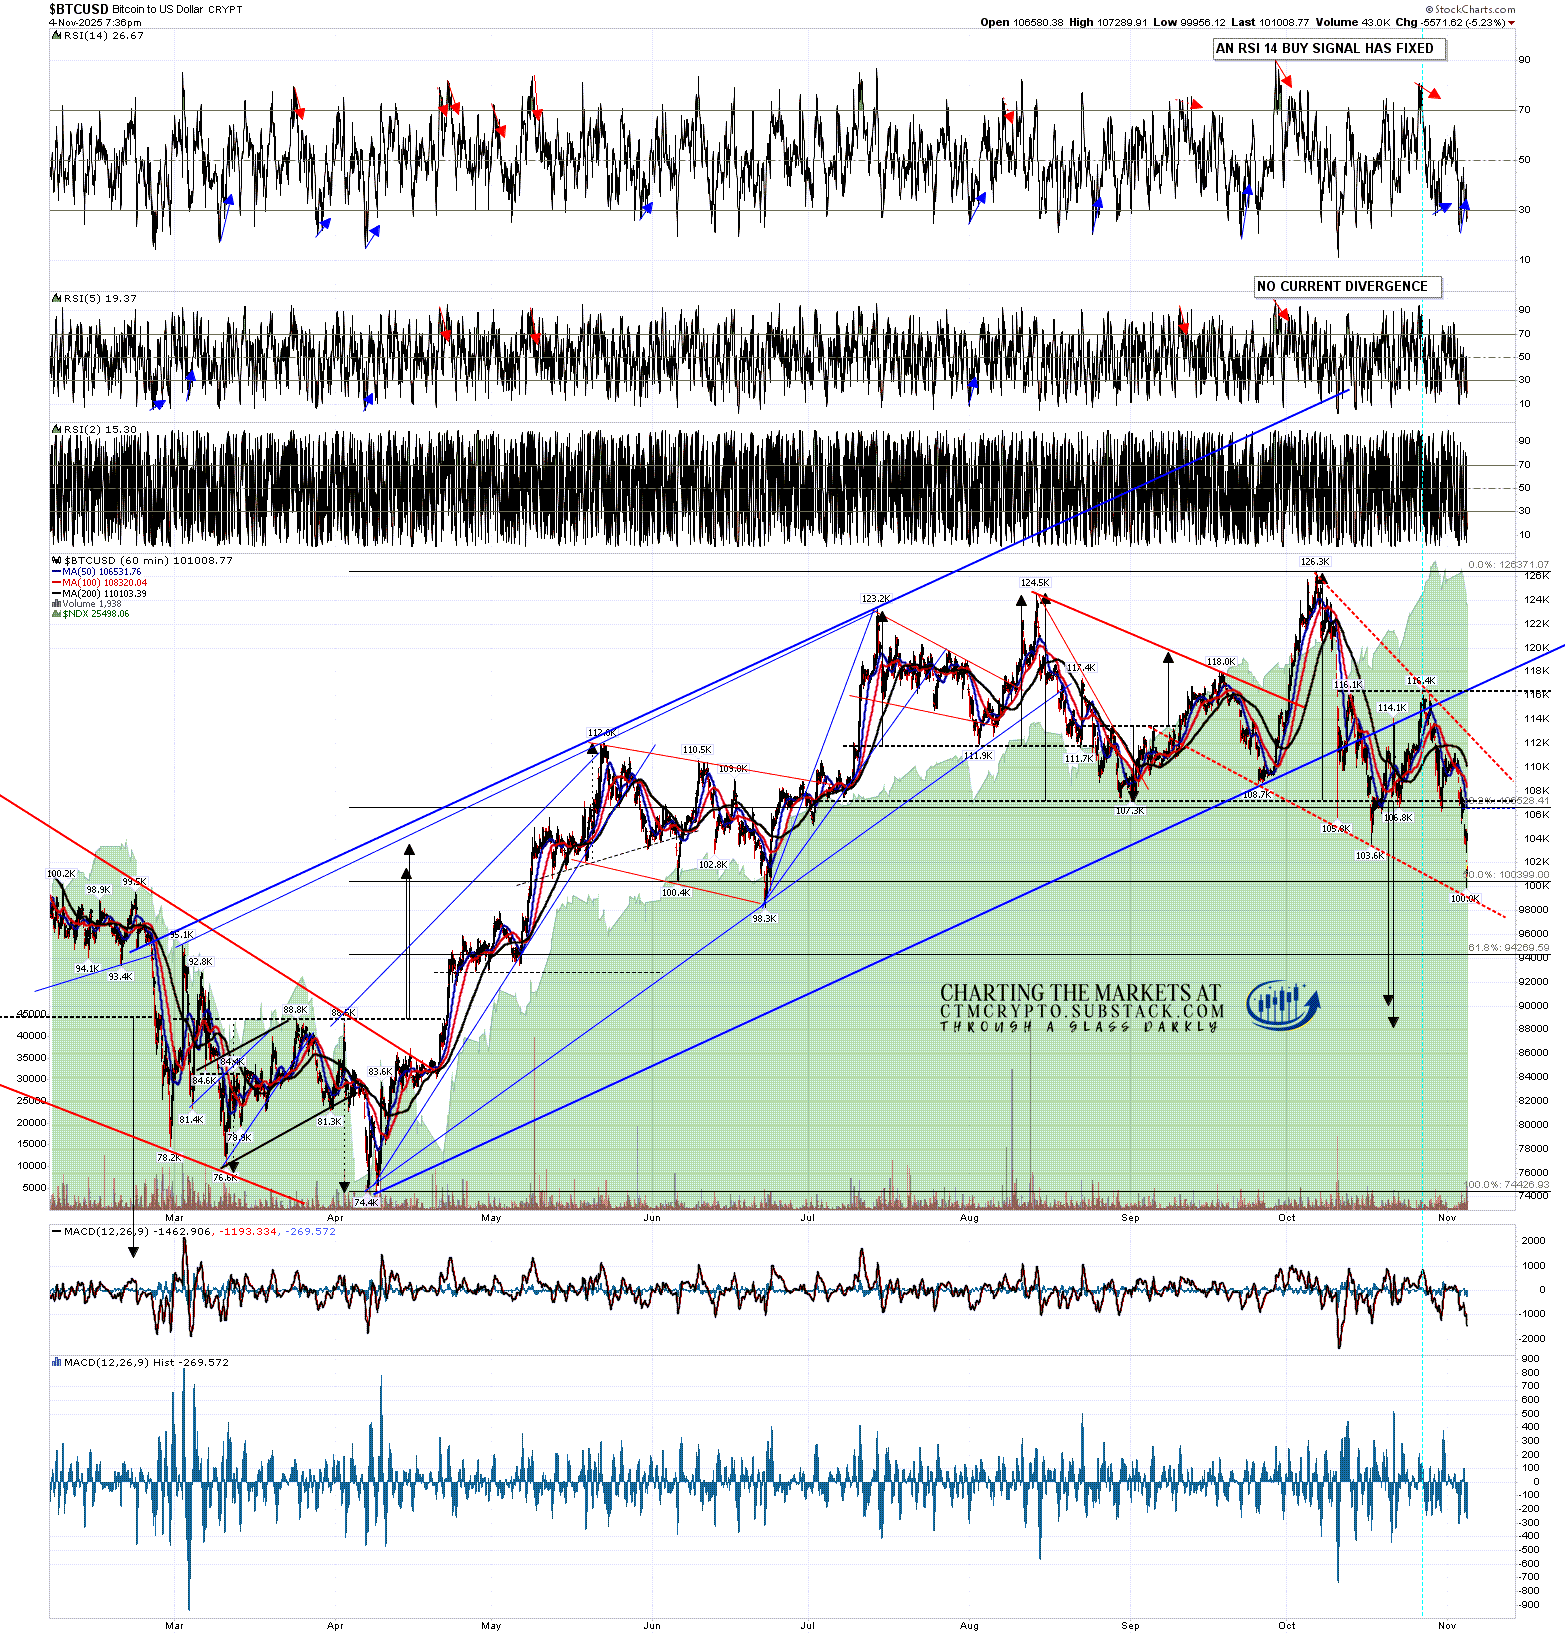
On the hourly chart an RSI 14 buy signal fixed today and I have a possible bull flag wedge forming, with an ideal support trendline currently in the 99k area.
BTCUSD 60min chart:
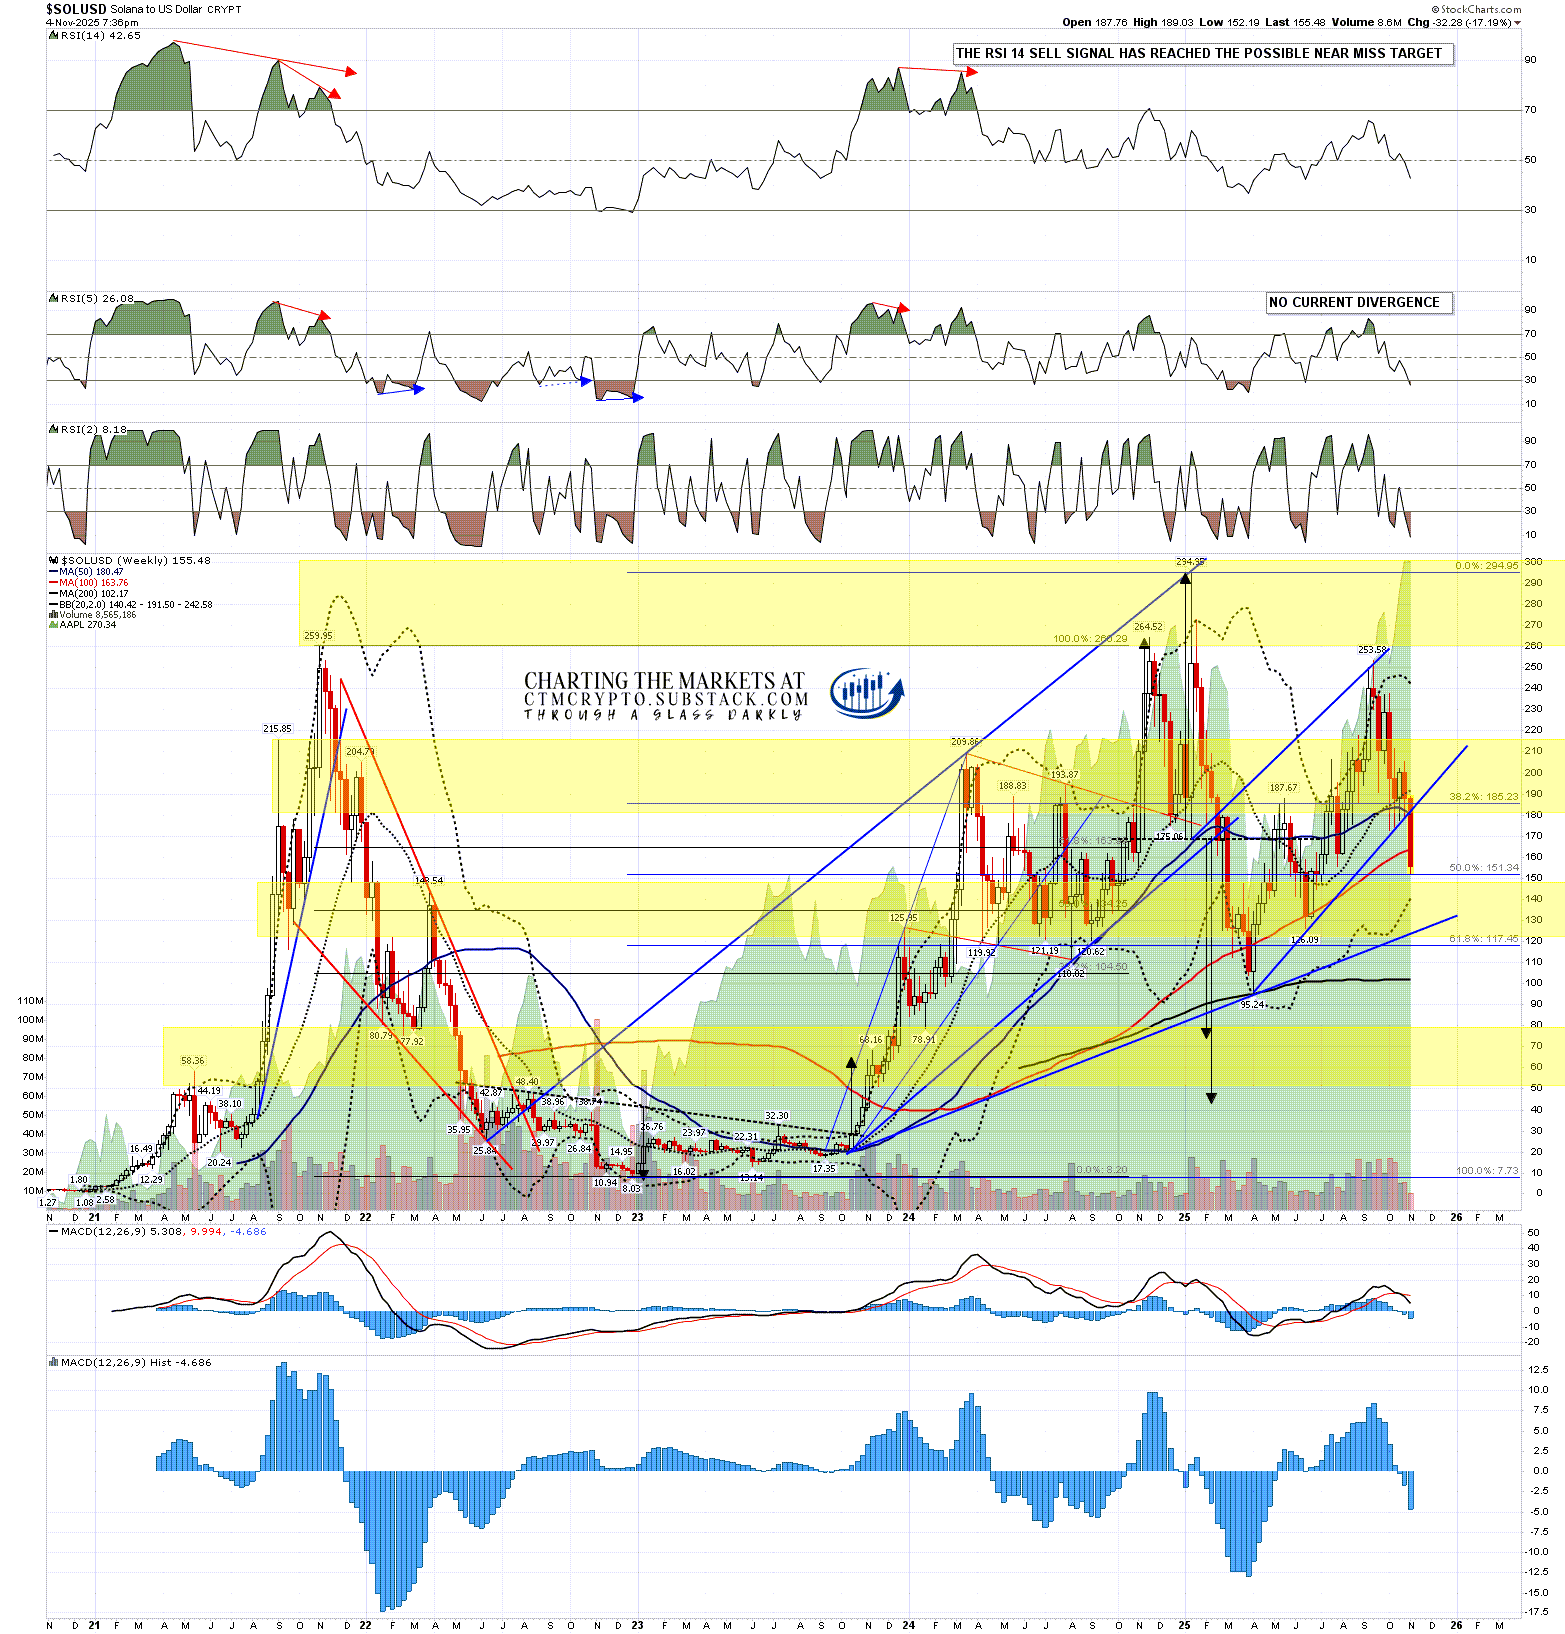
On Solana the weekly middle band has been tested as support every week for the last four weeks and finally broke at last week’s close. The 50 week MA was again only broken after the last bull market high in Q3 2021, but was broken hard in this bull market weeks after the all time high made in January, with Solana only breaking back above it with confidence in July.
The 50 week MA was triple support with rising wedge support from the April low and the 200dma both also in the 180 area and Solana has broken hard below all three yesterday and today. The only other decent support I’m watching here is rising support from the October 2023 low and that is currently in the 130 area.
I would also note from this weekly chart that there is still an open double top target on Solana in the 43 to 73 area. I had been assuming that double top was failing as I was expecting Solana to retest the all time high but as that hasn’t happened, that target is still valid.
SOLUSD weekly chart:
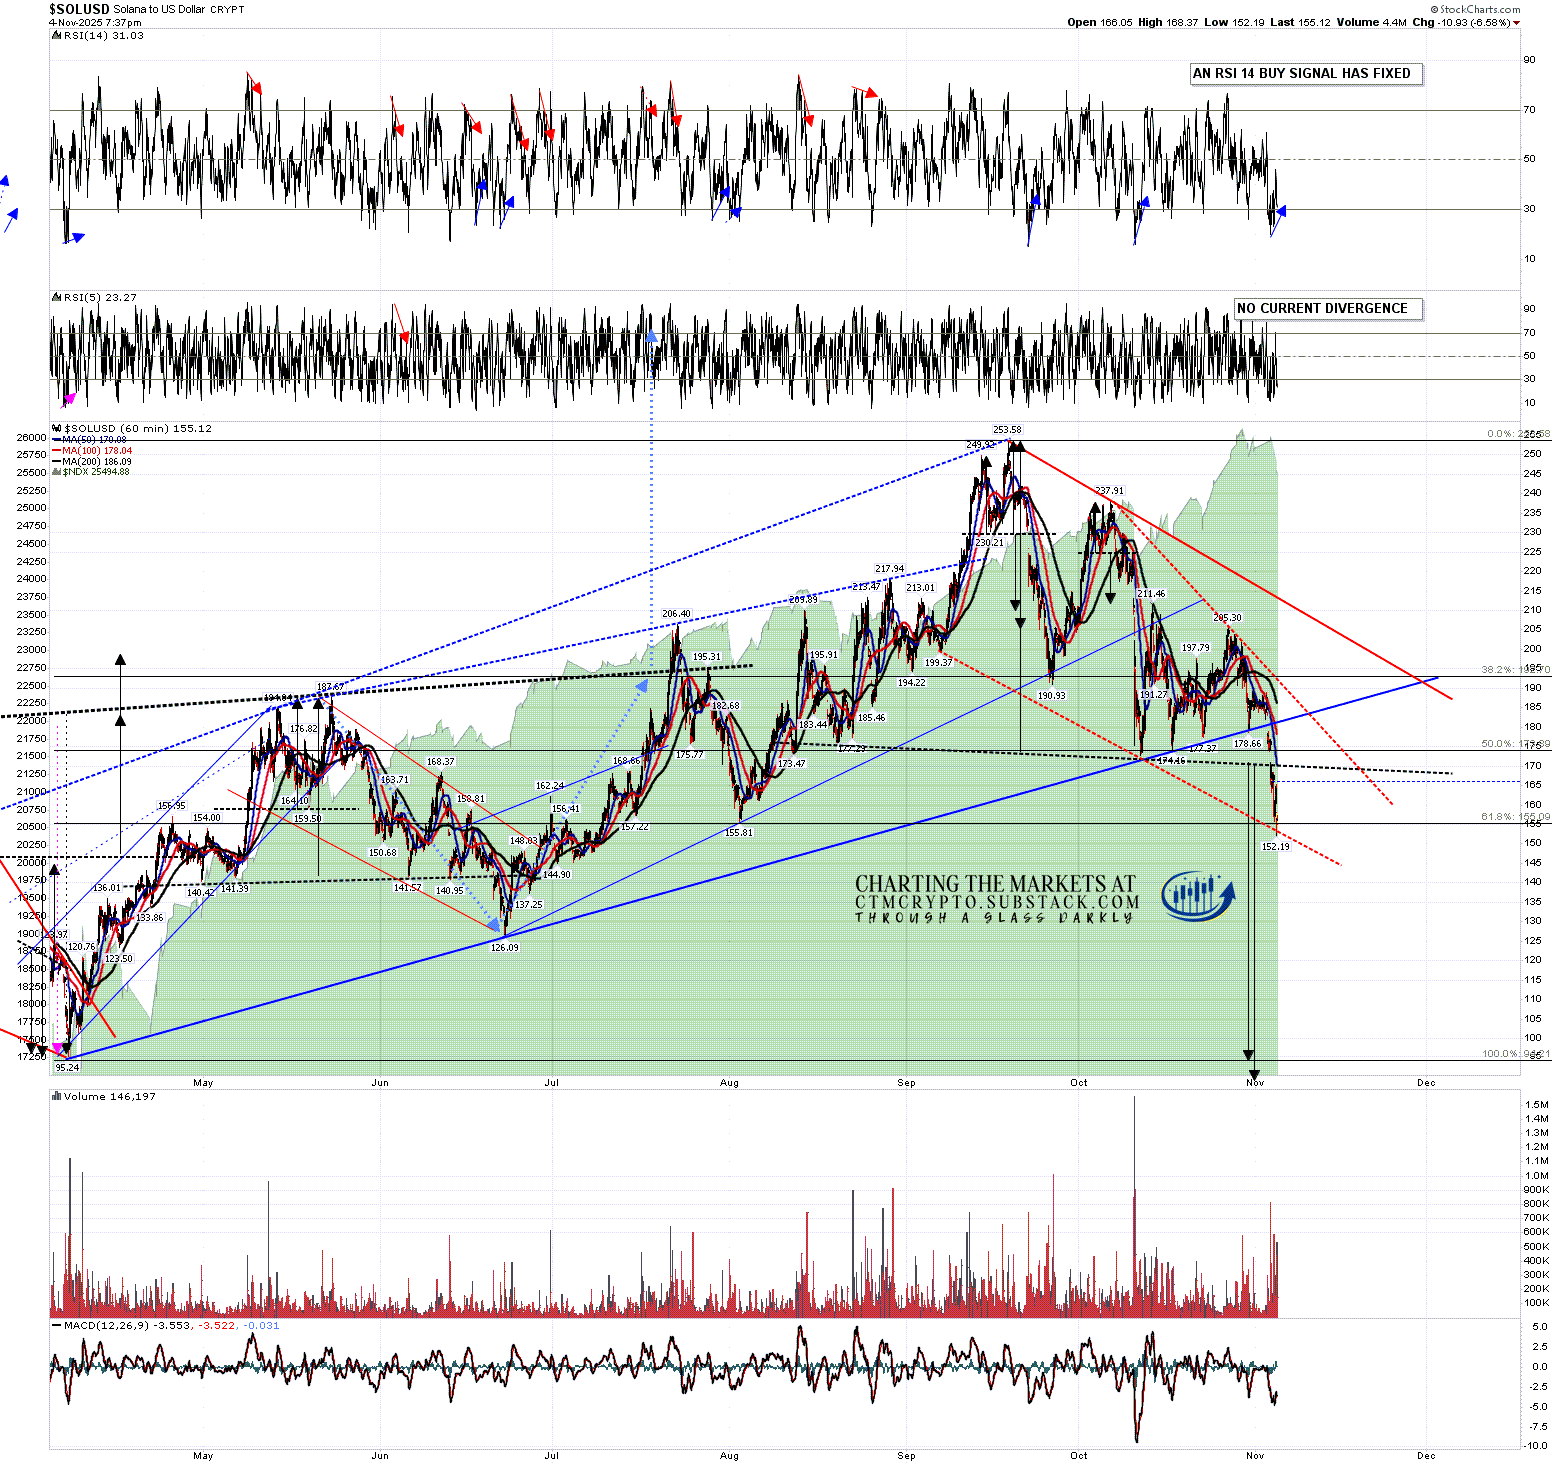
On the hourly chart another RSI 14 buy signal fixed today and while Solana remains above 126.09 there is still an open IHS target above in the 283 area. I have mentioned regularly before that when H&S patterns fail, it often happens with an H&S having formed in the opposite direction.
That may well be the case here as the H&S I was looking at last week completed forming and has broken down with a target at a retest of the April low at 95.24.
When H&S patterns fail it is generally not too long after the break down and with Solana having now retraced close to 61.8% of rising wedge from the April low, this would be a good time to reverse back up, if Solana can stop falling here.
SOLUSD 60min chart:
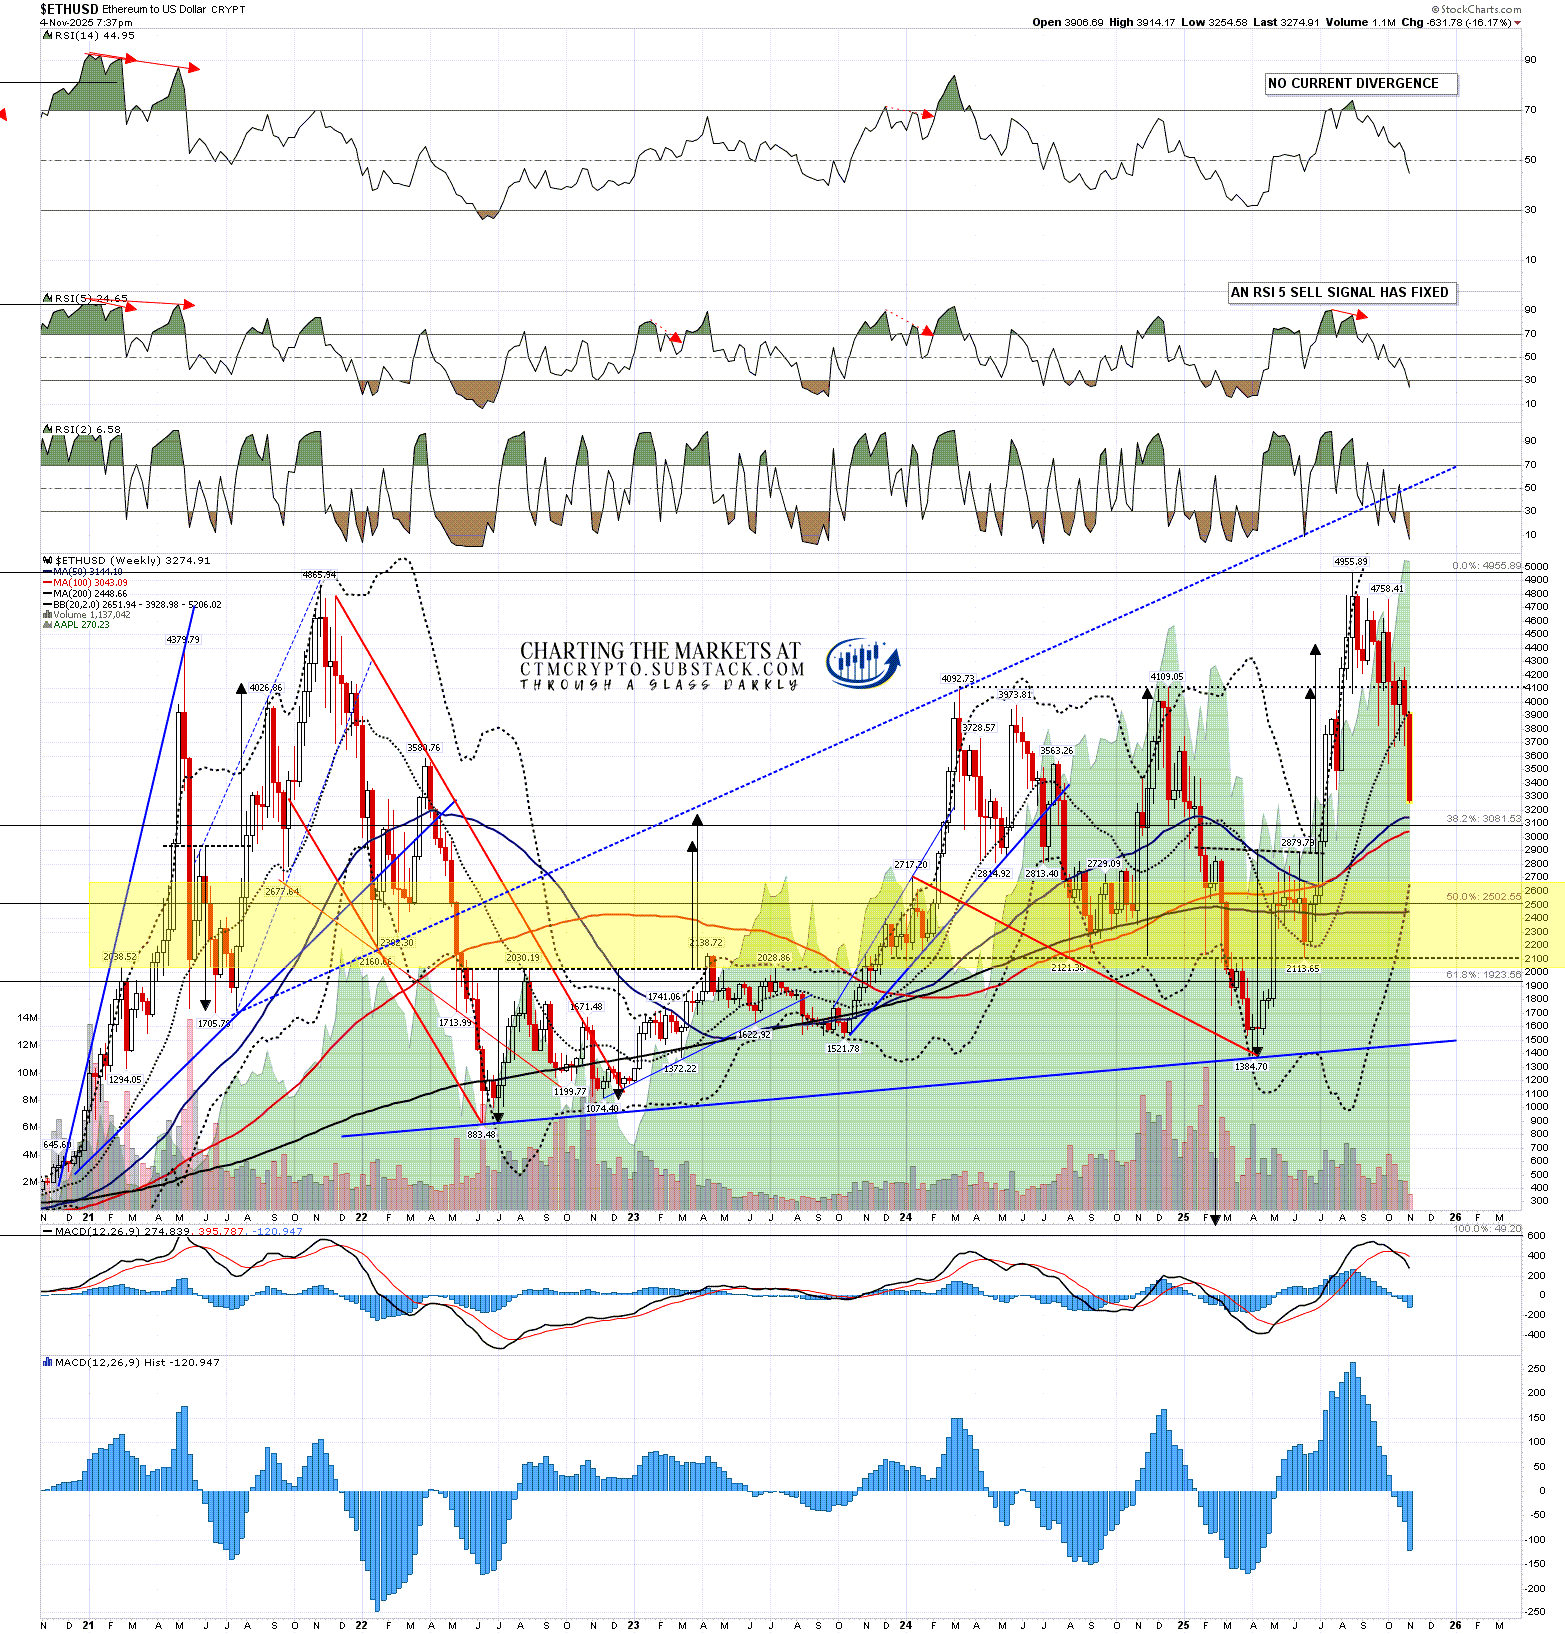
On Ethereum the weekly middle band has been tested as support every week for the last four weeks and has still not been broken on a weekly close basis. That’s currently at 3930.79. That is a big level on the weekly chart, with the other bigger level at the 50 week MA, currently at 3144.82. The 50 week MA on Ethereum was not broken until after the highs on the last two bull markets in early 2018 (on Ethereum, but in late 2017 on Bitcoin), and late 2021.
The low today is at 3297.63 at the time of writing, so we may see the 50 week MA tested soon.
ETHUSD weekly chart:
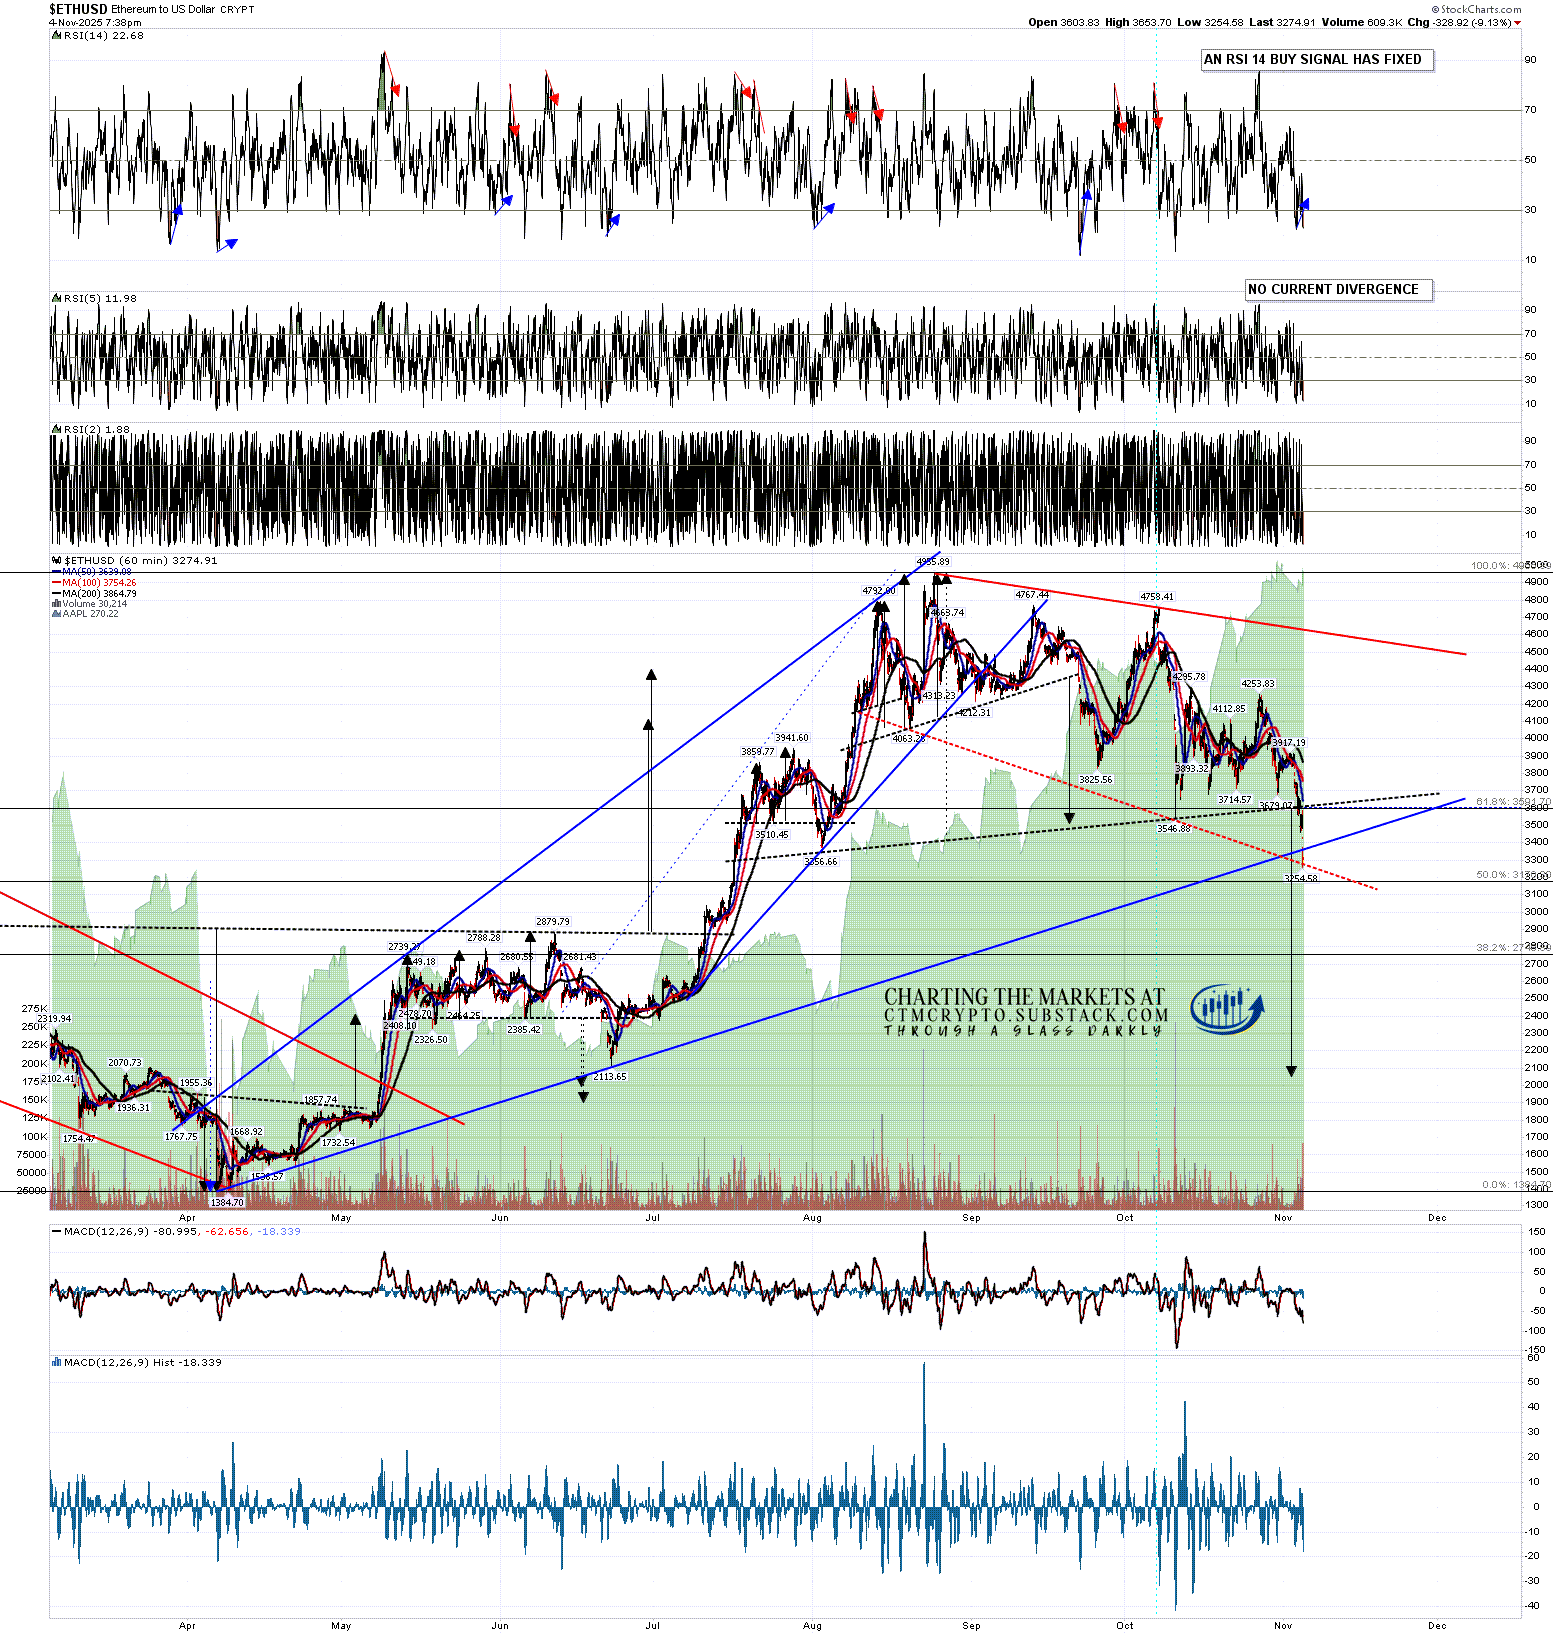
On the hourly chart another RSI 14 buy signal fixed today and as with all three of these a bull flag could still be forming here.
Alternatively, the H&S I was looking at last week has now completed and broken down with a target in the 2050 area.
ETHUSD 60min chart:
What’s the bottom line here? Well that this inflection point has formed now at all is suggesting that the bull market high is close, but then I’ve been talking about a high in the December 2025 area all year, and we are now in November.
This is a potential major support break and if prices continue down then I’d be leaning towards the bull market in Solana and Ethereum being over. The same would apply on Bitcoin, but with higher odds that we might see a final all time high retest before the main decline begins.
Since I started doing daily videos on Crypto early last year I’ve got Crypto direction right most of the time and more so than any other analyst anywhere that I’m aware of. I’m a very good analyst and all three of these instruments are very classical chartist friendly. I’m not much of a marketer though, and the free Crypto substack I set up last August still has less than 200 readers. I’d like to increase that readership and invite any suggestions on how I could do that.
If you’d like to see more of these posts please subscribe for free to my Crypto substack. I also do a premarket video every day on Crypto at 9.05am EST with morning charts for paying subscribers. All the videos I record are posted shortly afterwards on my Youtube channel, and every post I publish is linked on my twitter.
No comments:
Post a Comment