
In my posts on 20th October, 24th October, and 28th October I was looking at the rising wedges on SPX, QQQ, DIA and IWM from the April lows and weighing the odds of these breaking down into a substantial retracement in the near future.
I was saying that these are all good quality mature patterns that I would normally expect to break down, but was concerned that we might instead see the start of a larger break up into December.
My concerns to the upside were firstly that November and December lean significantly bullish, and that remains the case of course.
Shorter term I was concerned that the Fed cut might trigger an upside break but that didn’t happen.
I was concerned that an agreement with China might trigger an upside break but that didn’t happen.
I was concerned that this week is historically one of the most bullish weeks of the year and might kick off an upside break but that didn’t happen either.
Instead we have seen all of the rising wedges except the one on DIA (so far) break down and the downside has been persistent, delivering breaks below the daily middle bands on SPX and QQQ yesterday, a test of the daily middle band as support yesterday on DIA and a move to the daily lower band on IWM.
So what now? Well the first obvious point to reverse back up to the highs earlier this week was on Wednesday morning, when I was looking in my premarket video at the hourly buy signals fixed or forming on ES, NQ, RTY and DAX. That delivered a decent rally, the buy signals reached their targets, and the downtrend then resumed.
There is another opportunity to do that this morning, with hourly buy signals currently forming on ES, NQ, RTY, YM and DAX. That too could deliver a full reversal back up, but in the event that also fails to deliver that I’m going to look at the obvious target areas below on SPX, QQQ, DIA & IWM.
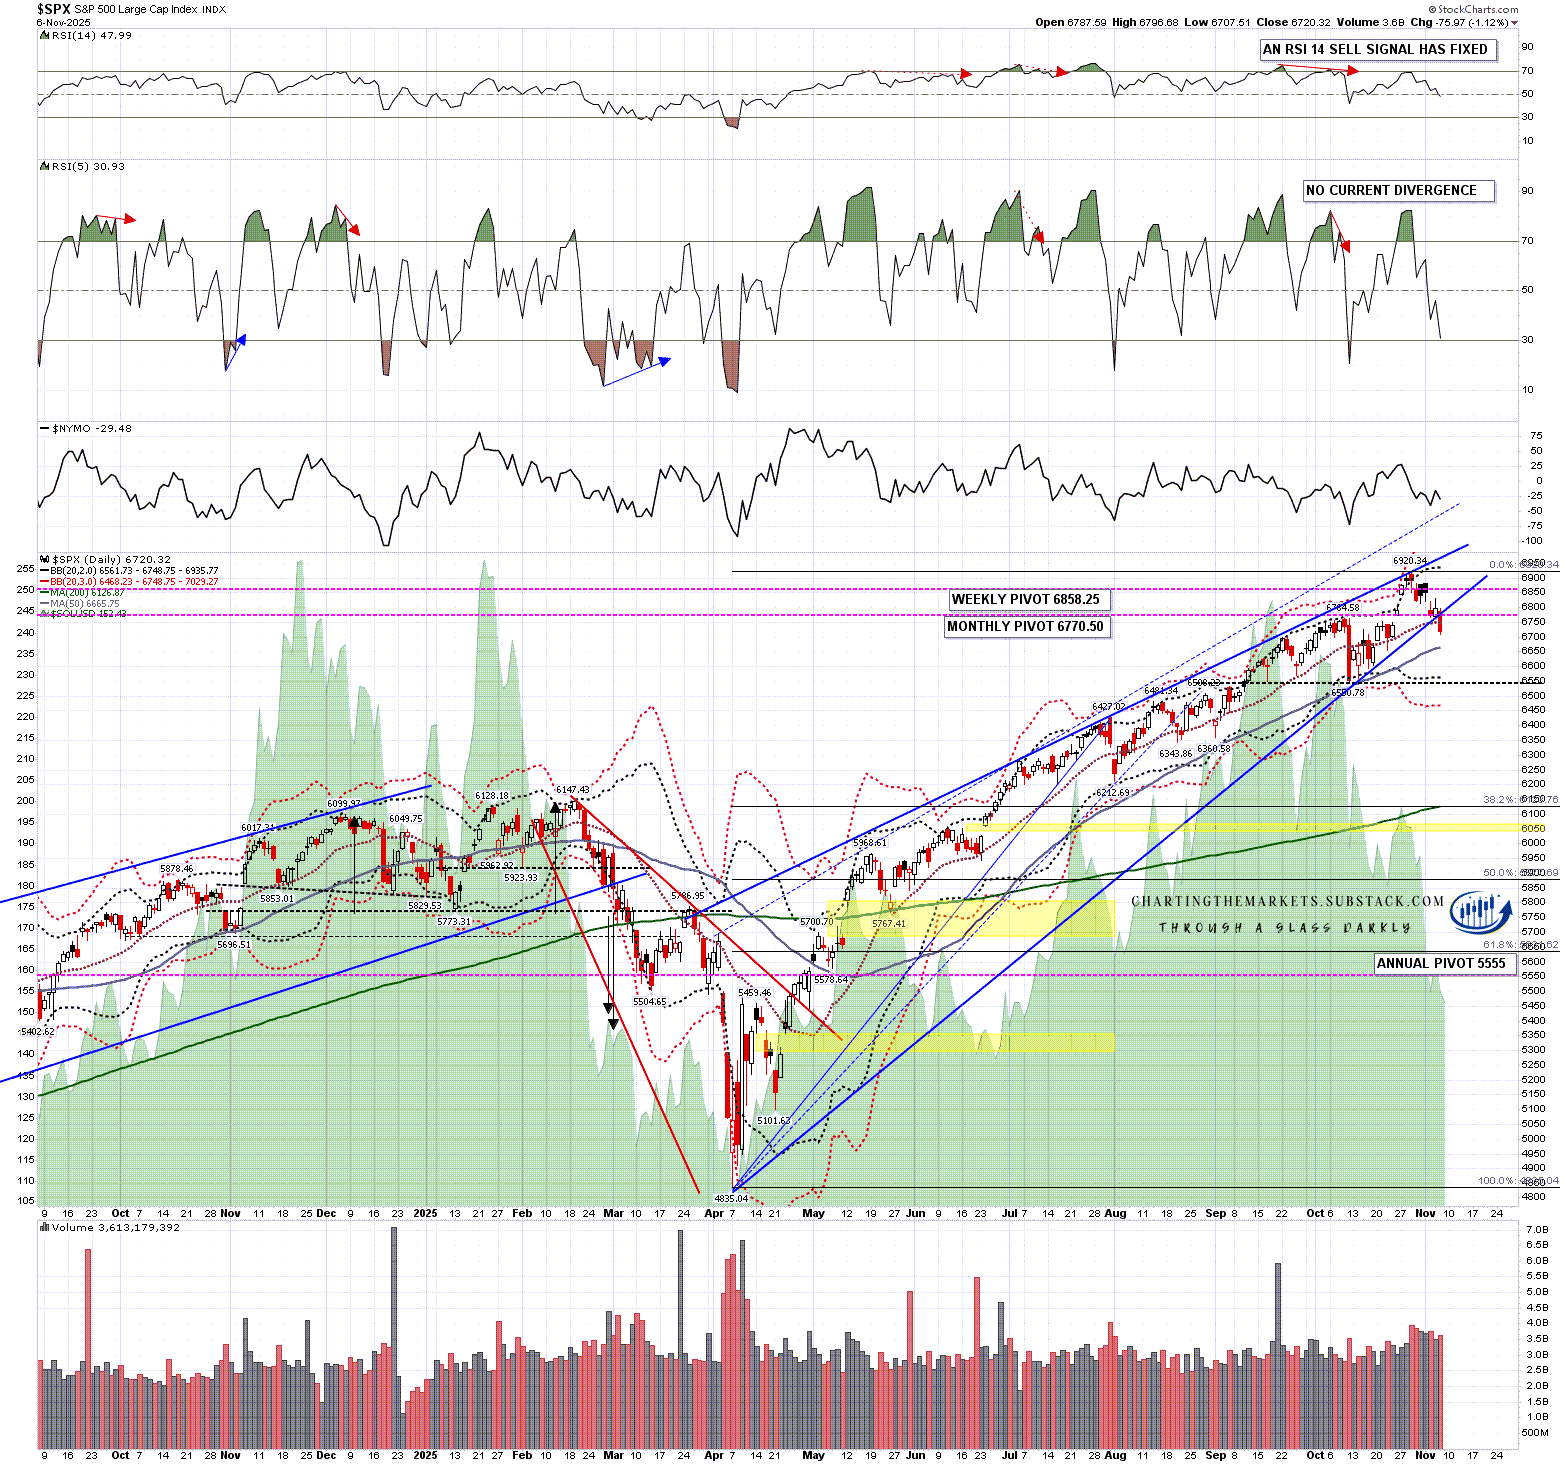
Looking at SPX there was a clear break yesterday below the daily middle band, which closed yesterday at 6748.75. If we see a close back above that today then that may be the start of a rejection back to the highs. If not then that would invite more downside. There was also a clear break below rising wedge support.
Where would the obvious downside target be? I have two levels. The first is the rising support trendline from the August low, currently in the 6675 area, but the main one would be a retest of the October low and possible H&S neckline at 6555.
SPX daily chart:
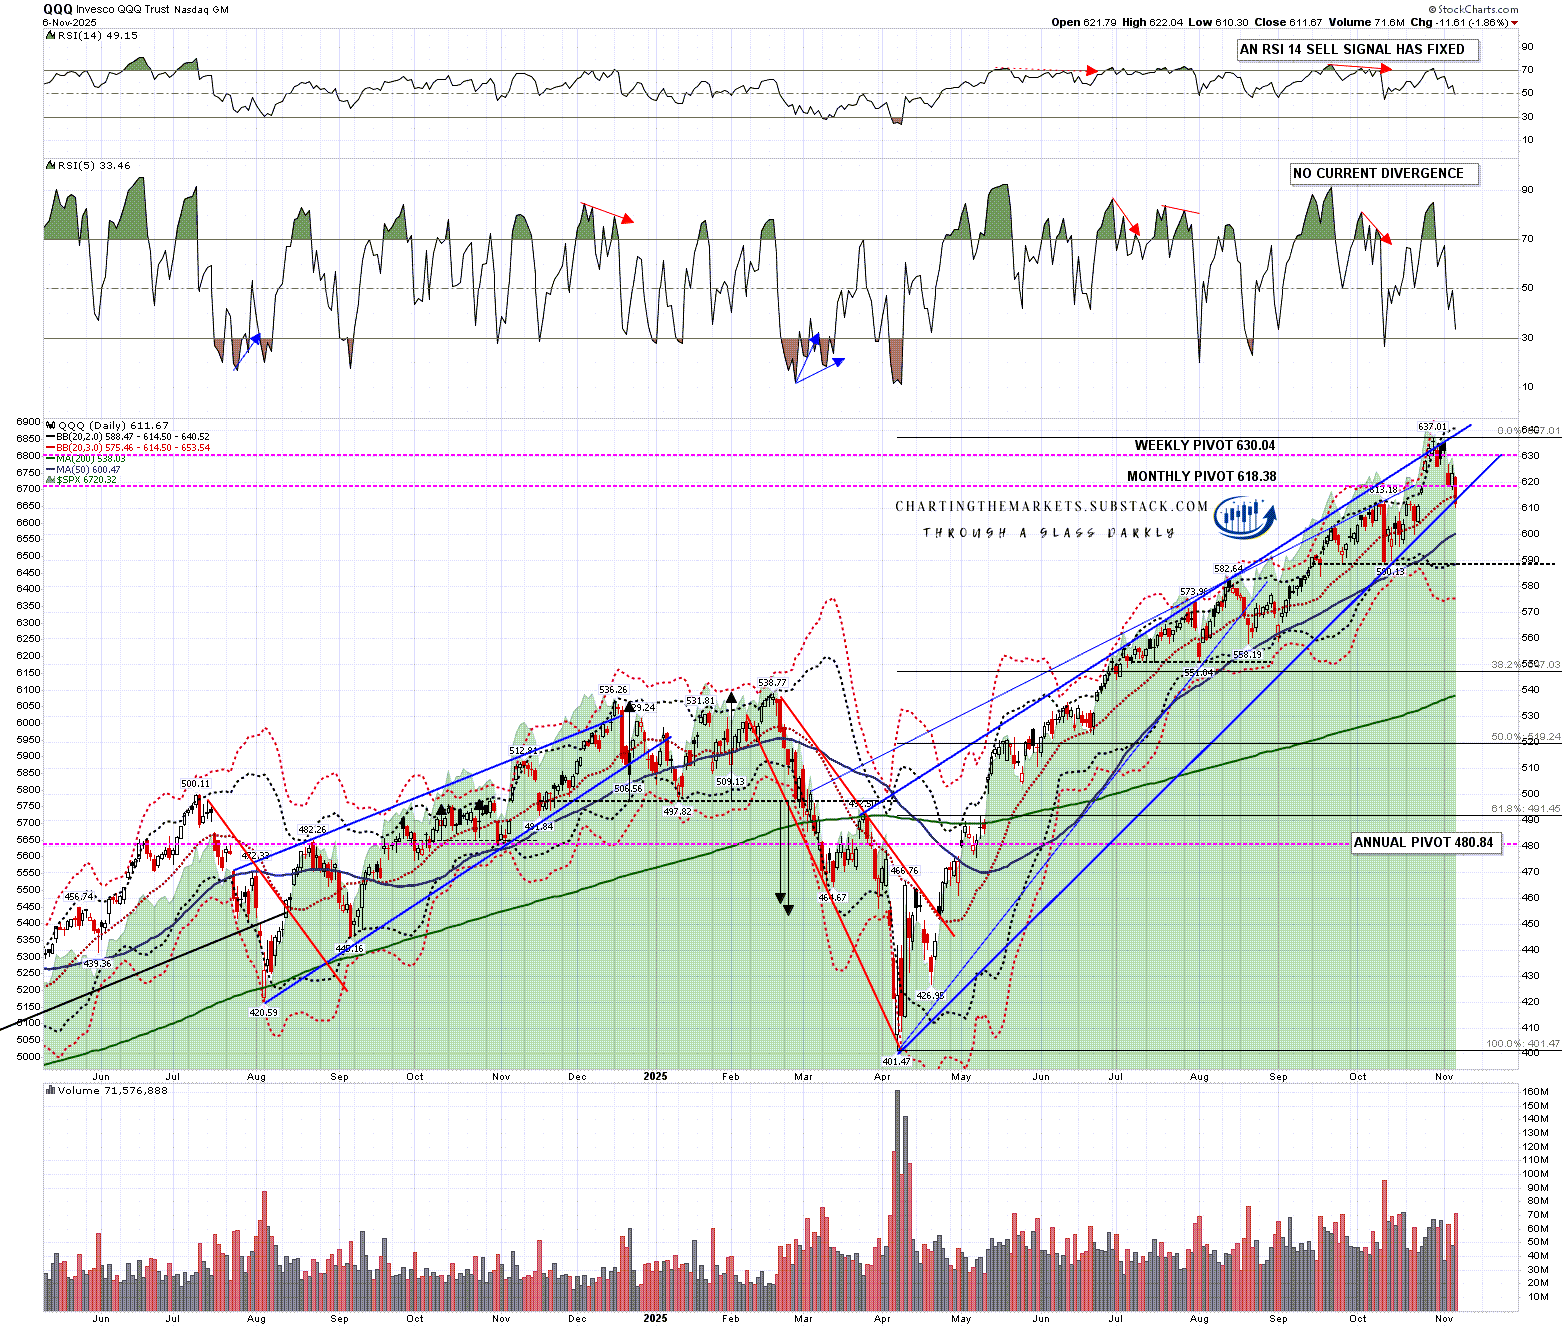
Looking at QQQ there was a clear break yesterday below the daily middle band, which closed yesterday at 614.50. If we see a close back above that today then that may be the start of a rejection back to the highs. If not then that would invite more downside. There was also a clear break below rising wedge support.
The obvious downside target would be a retest of the October low and possible H&S neckline at 589.05.
QQQ daily chart:
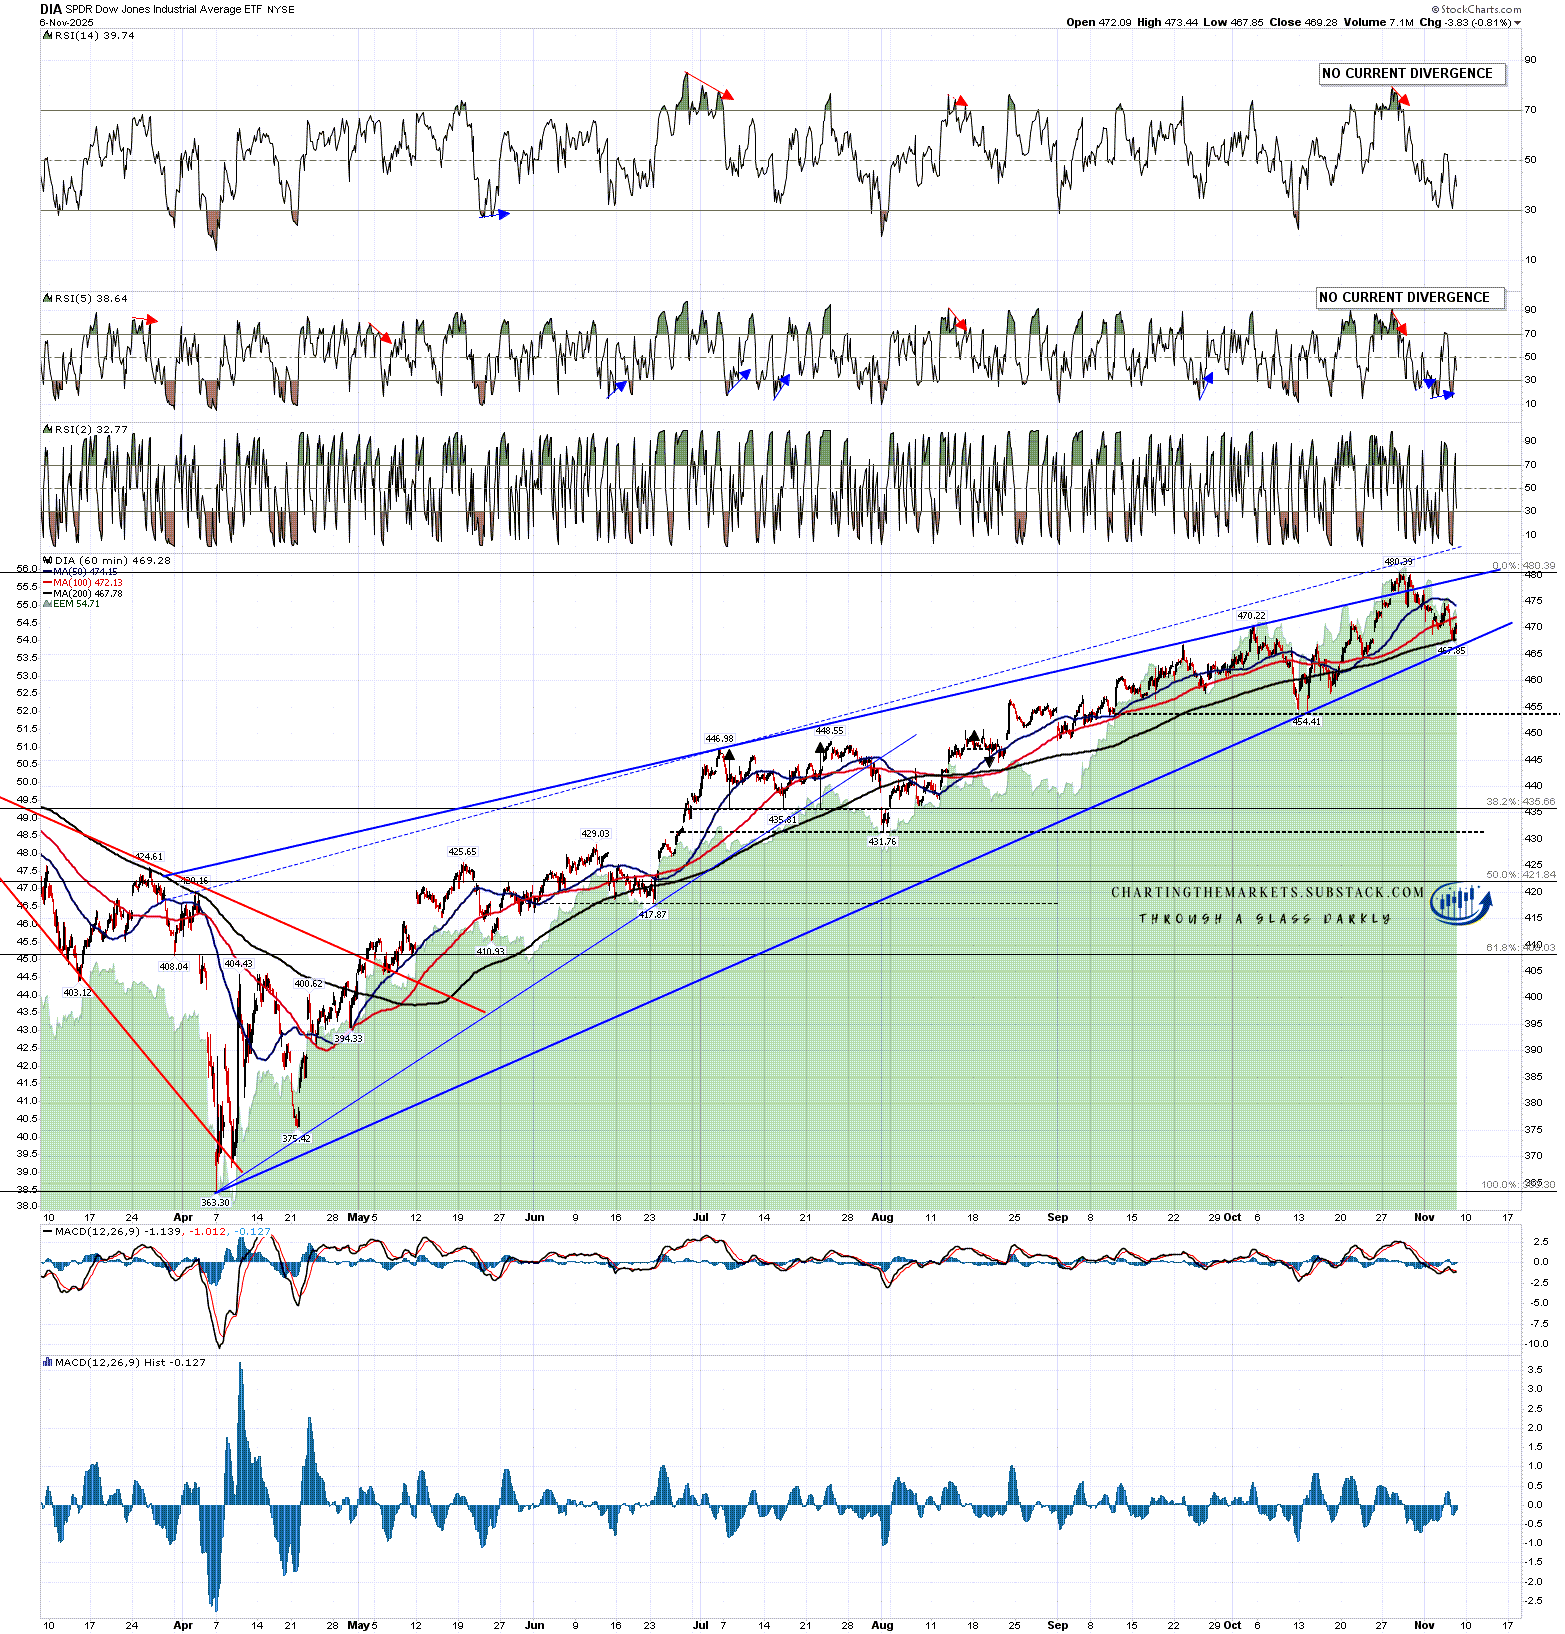
DIA tested the daily middle band, currently at 468.47 at the low yesterday, and that has held so far and may hold today. Rising wedge support has not been tested so far, but is not far below in the 465 area.
If both of those break then the obvious downside target would be a retest of the October low and possible H&S neckline at 454.41.
DIA 60min chart:
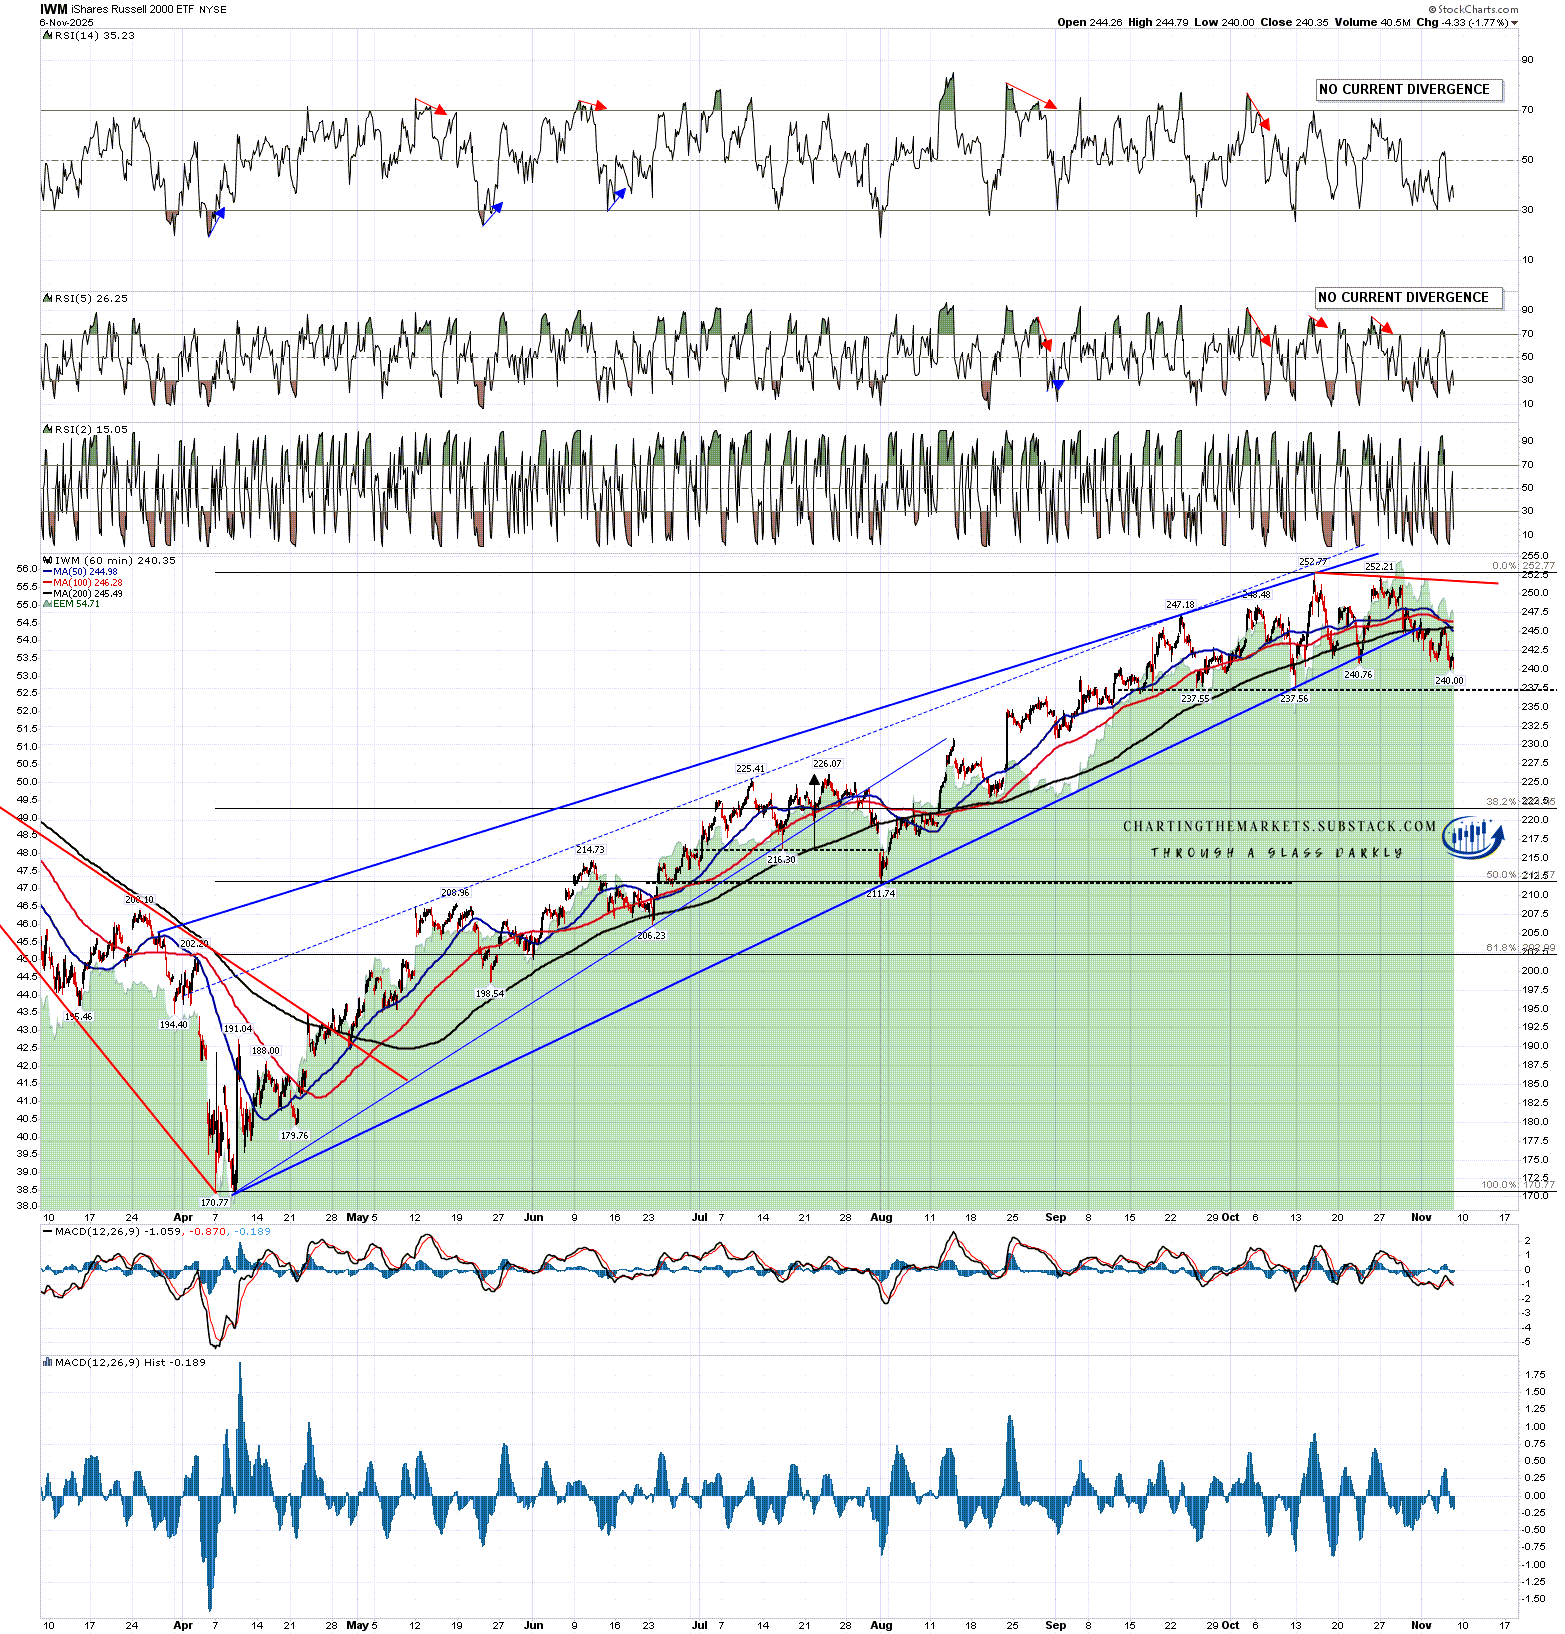
IWM has been the weakest of these four indices lately and broke below the daily middle band last week, almost reaching the daily lower band yesterday.
The obvious downside target there is also the retest of the October low and possible H&S neckline in the 237.55 area, though that target is much closer on IWM than on the others.
IWM 60min chart:
I’ve been publishing a chart of the day every day on my twitter for a while now as I see a lot of interesting charts in my reading and draw some more of those myself.
I have mentioned regularly the common misconception that the Fed sets interest rates, when in truth borrowing rates are based on the thirty and ten year treasuries, so Fed cuts don’t necessarily have any real world impact on borrowing rates.
I wrote a post mentioning this on 10th November last year and said:
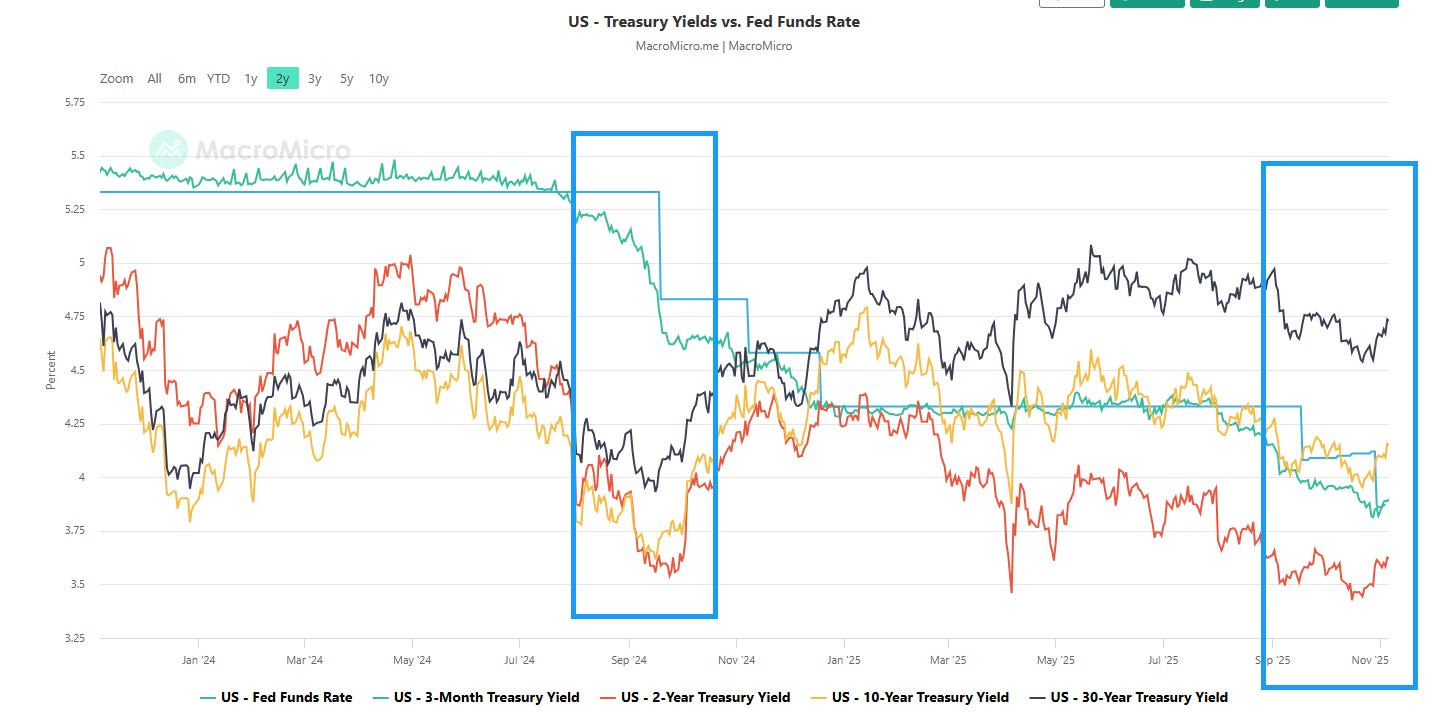
Could the Fed solve this problem by keeping interest rates low? No, real long term interest rates are set by the government bond markets, and those long term treasury yields, ten year yields on TNX and thirty year yields on TYX, are determined by supply and demand on those bond markets. That’s the reason that while the Fed has reduced their benchmark rate by 0.75% over the last two months, government bond markets raised the yield on US 10 year treasuries by 0.88% over the same period. The Fed doesn’t control bond markets, any more than sailors control the sea.
The chart below illustrates that truth with the black and yellow trendlines being the thirty and ten year treasury yields respectively. I have added two boxes to highlight the Fed cuts in the last four months of 2024 and the cutting cycle starting now. The Fed has now cut 1.5% over this period and from when that cutting process started thirty year yields are currently up 0.75% and ten year yields are currently up 0.6%.
Borrowing costs have therefore risen significantly during this cutting cycle. They have also risen so far since the last rate cut in late October:
This retracement could be bottoming out here and the hourly buy signals brewing on multiple index futures charts could deliver that. Overall though I’m still leaning lower after a possible rally here and the obvious next big downside targets and support levels are the ones I’ve given above.
The bullish historical stats for this week were a bust. Next week leans neutral every day except Tuesday, which leans strongly bearish.
In the next few days I’ll be looking at the pattern setup for a possible bigger picture high forming here in another post.
If you like my analysis and would like to see more, please take a free subscription at my chartingthemarkets substack, where I publish these posts first. I also do a premarket video every day on equity indices, bonds, currencies, energies, precious commodities and other commodities at 8.45am EST, but only for paying subscribers. Other places to find me are my twitter, and my Youtube channel.
No comments:
Post a Comment