
In my premarket video for subscribers on Friday morning on 21st November I was calling a likely rally and looking at weak hourly buy signals fixed or brewing across the board on ES, NQ, RTY and YM.
In my last post on Tuesday 25th November, after that rally had started strongly, I was looking at the resistance levels for the Thanksgiving week rally and looking at the levels at which the strong bearish setup at the start of that week would fail, triggering likely all time high retests across the board on SPX, QQQ, DIA and IWM.
Those levels were all hit and exceeded by the close on Friday 28th November, all the H&S patterns that broke down at the end of the previous week had failed, and all of SPX, QQQ, DIA and IWM had broken back over their daily middle bands and confirmed that break with a second daily close above them.
That was the start of this Santa rally, we have since seen new all time highs on DIA and IWM, and I’m expecting to see new all time highs on SPX and QQQ as well in December. Today I want to look at where this move likely goes from here.
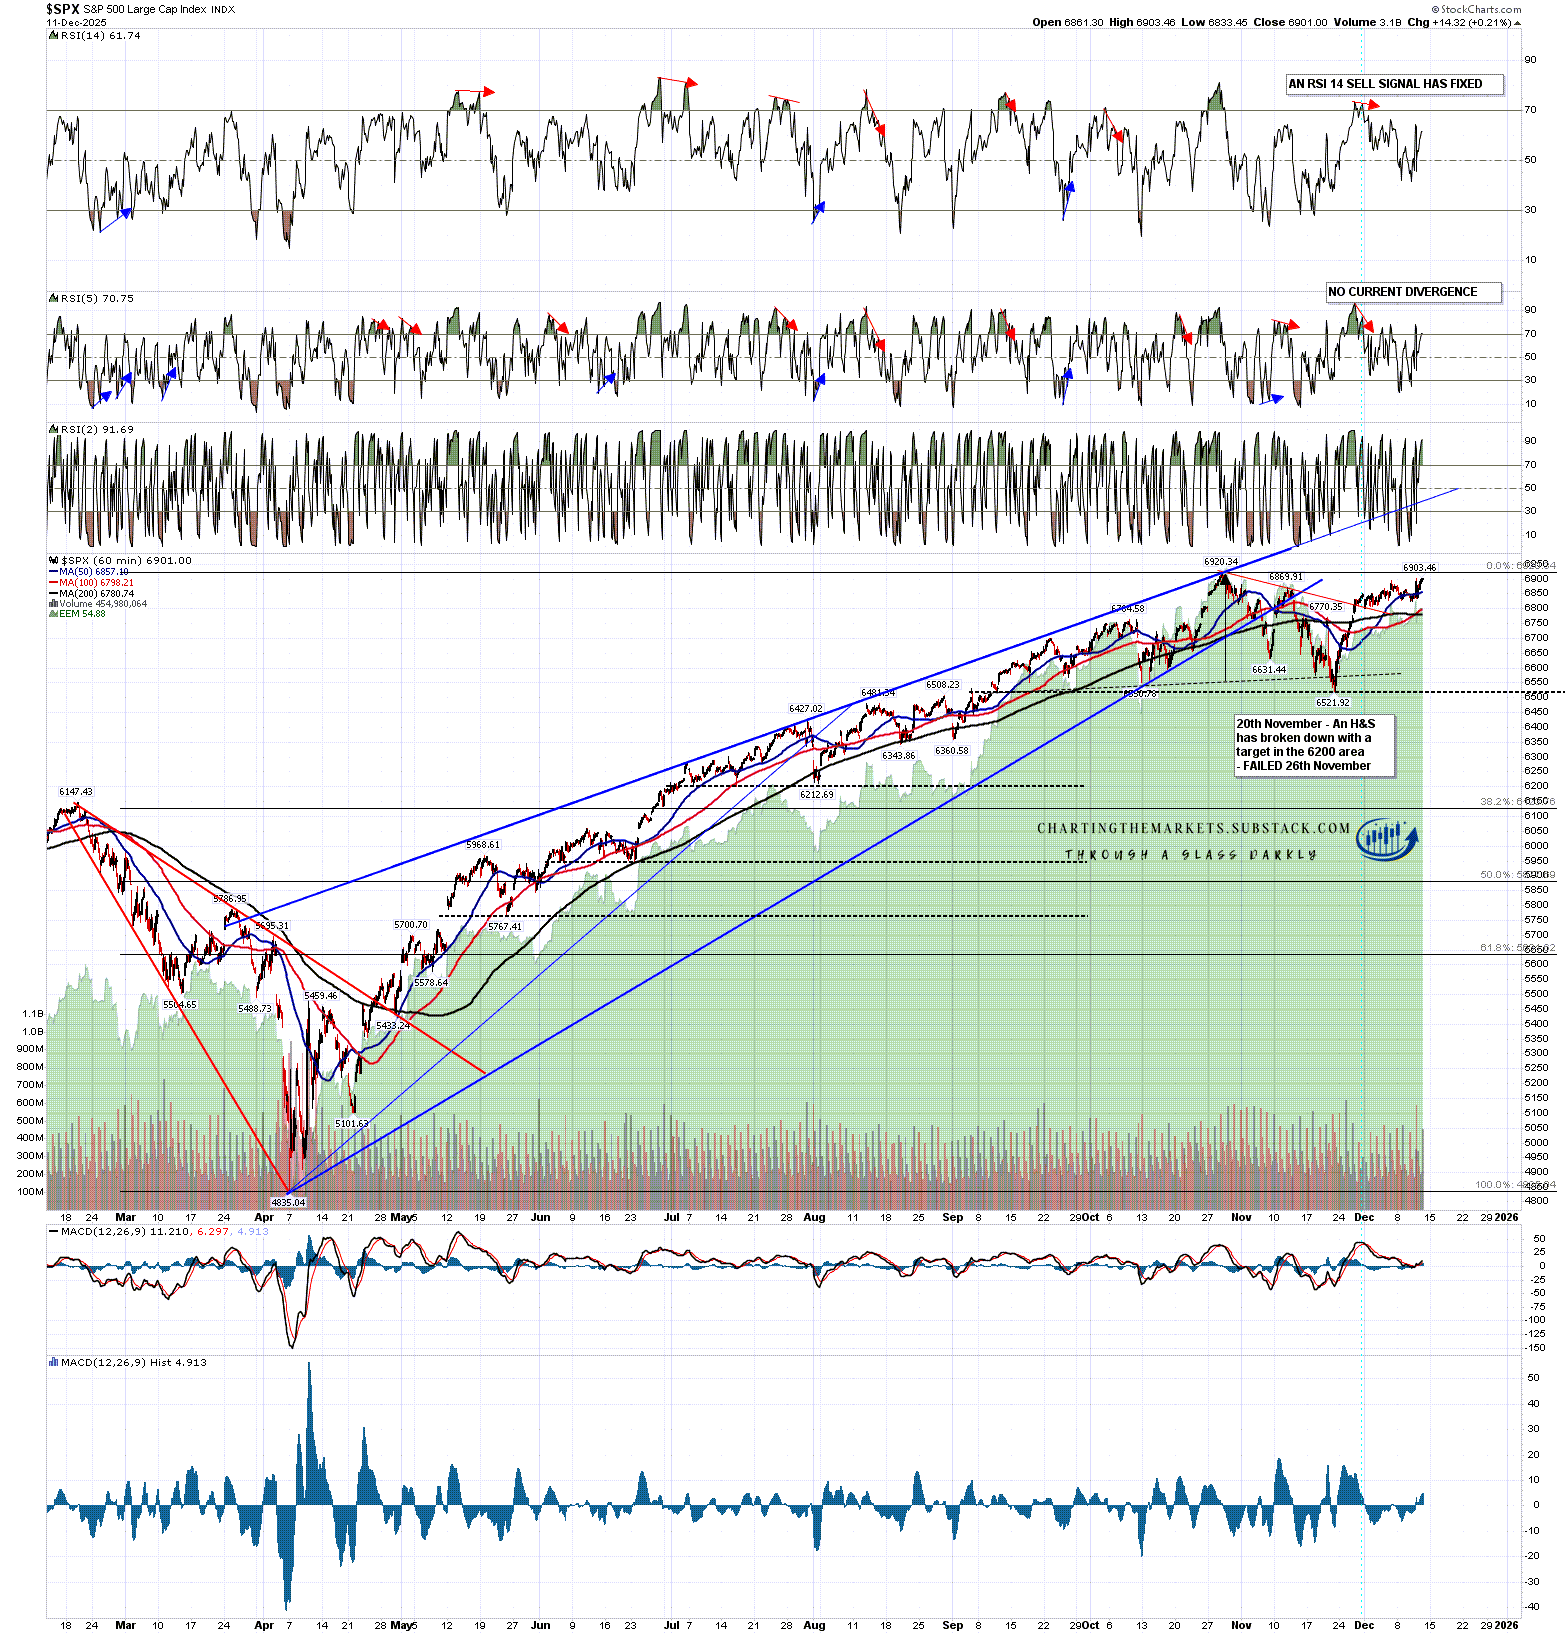
SPX is close to a retest of the all time high, and that will likely be retested very soon. I’m expecting this rising wedge from the April low to hold into a much larger top coming in the next couple of months, but it is still possible that SPX might reach wedge resistance once more before that larger top and, if so, that wedge resistance is currently in the 7150 area.
There is an hourly RSI 14 sell signal fixed though that could fail as equities trickle higher towards Xmas. The equivalent sell signal on DIA failed yesterday.
SPX 60min chart:
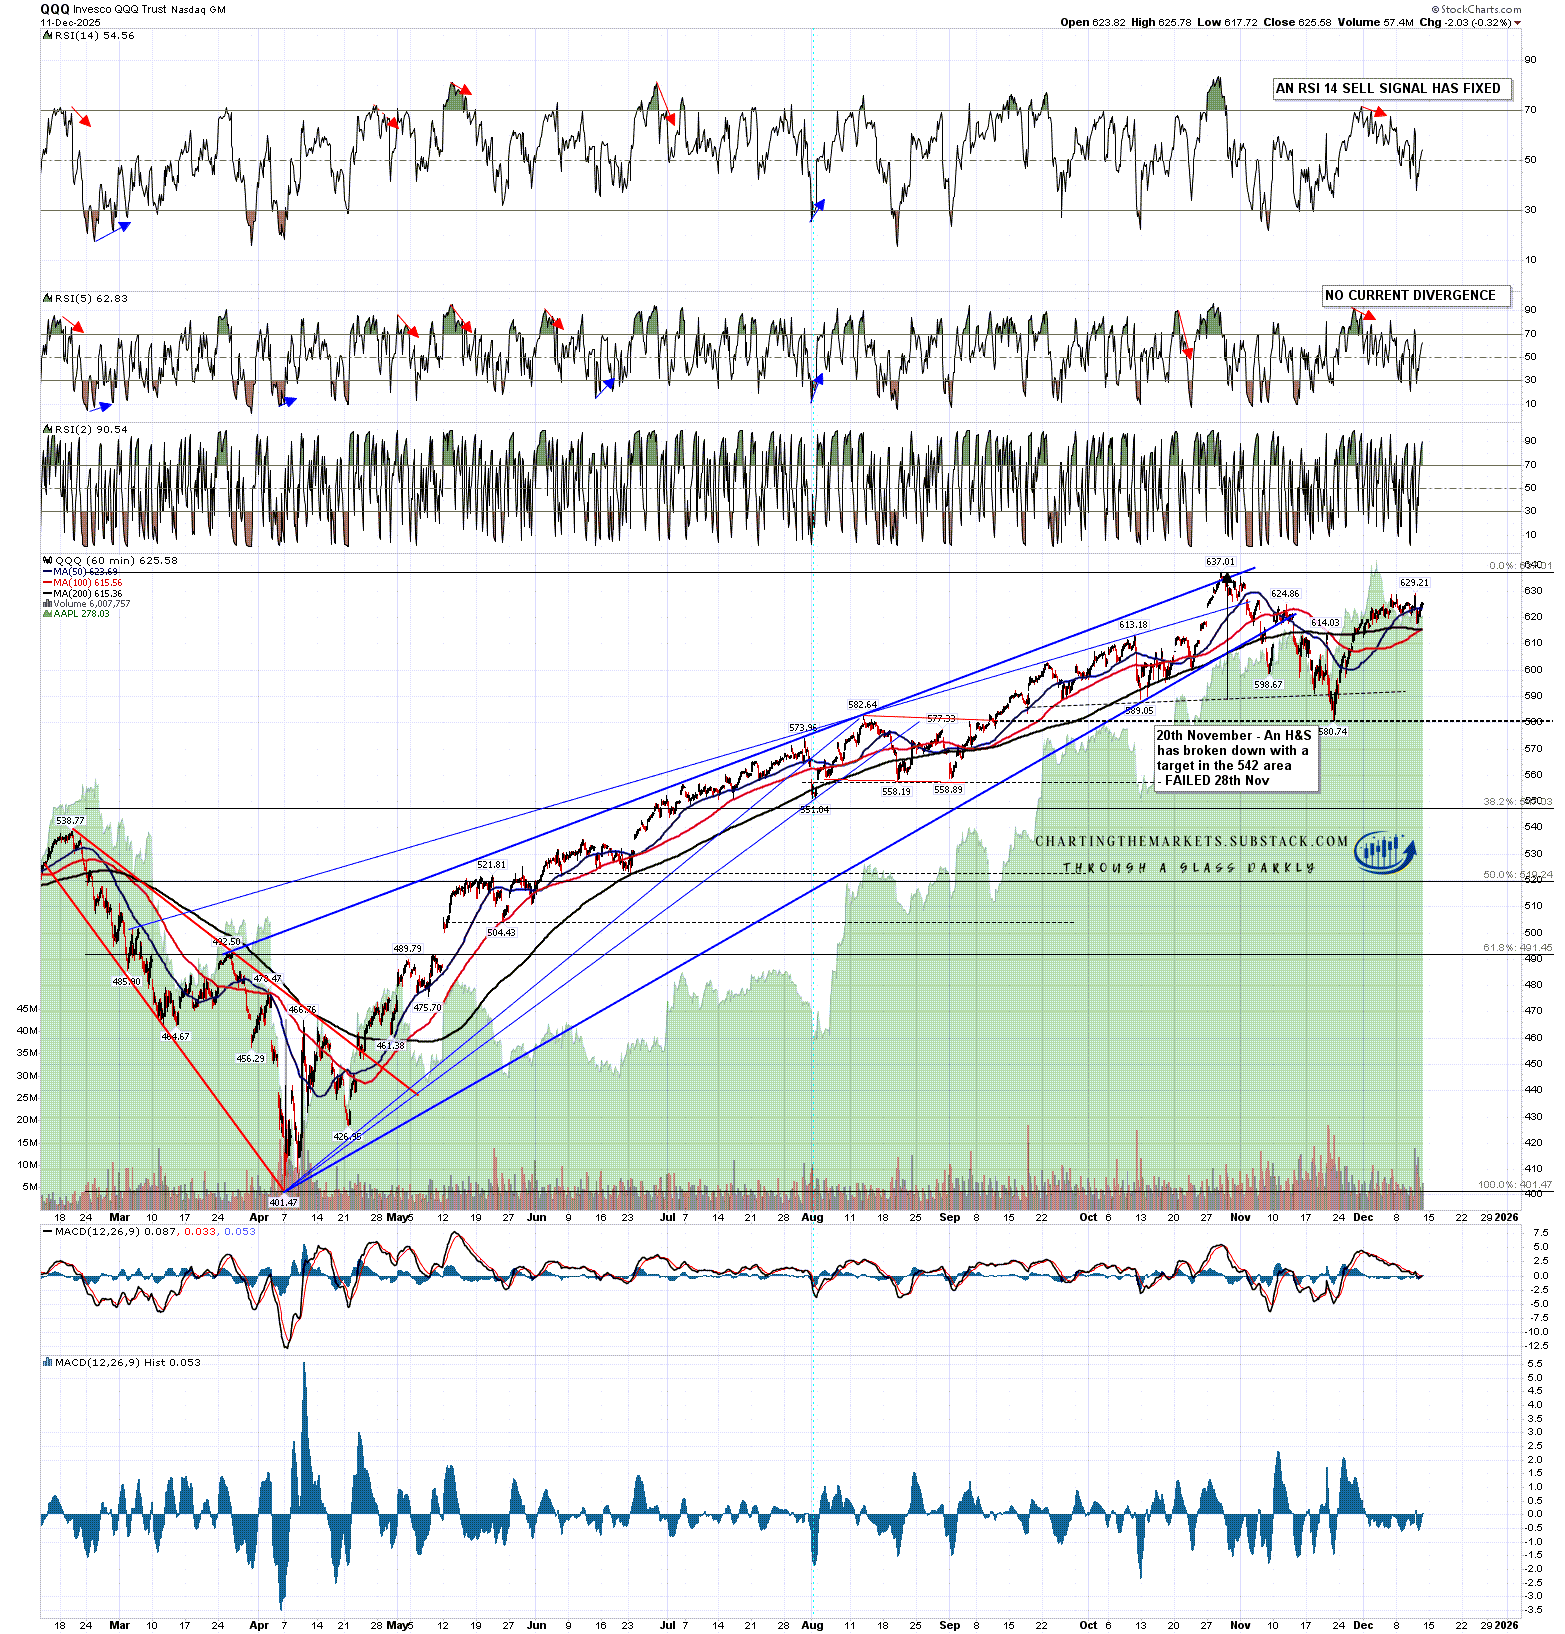
QQQ is also close to a retest of the all time high and I’m expecting to see that retested before Xmas. I’m expecting this rising wedge from the April low to hold into a much larger top coming in the next couple of months, and the wedge has already overthrown so I’m not expecting that to be reached again for that reason and also because the current move up has been slowest on QQQ.
Tech has been the strongest performer by far this year but has been the weakest performer since the last low and I am thinking that relative underperformance may extend through next year.
There is an hourly RSI 14 sell signal fixed though that could also fail as equities trickle higher towards Xmas.
QQQ 60min chart:
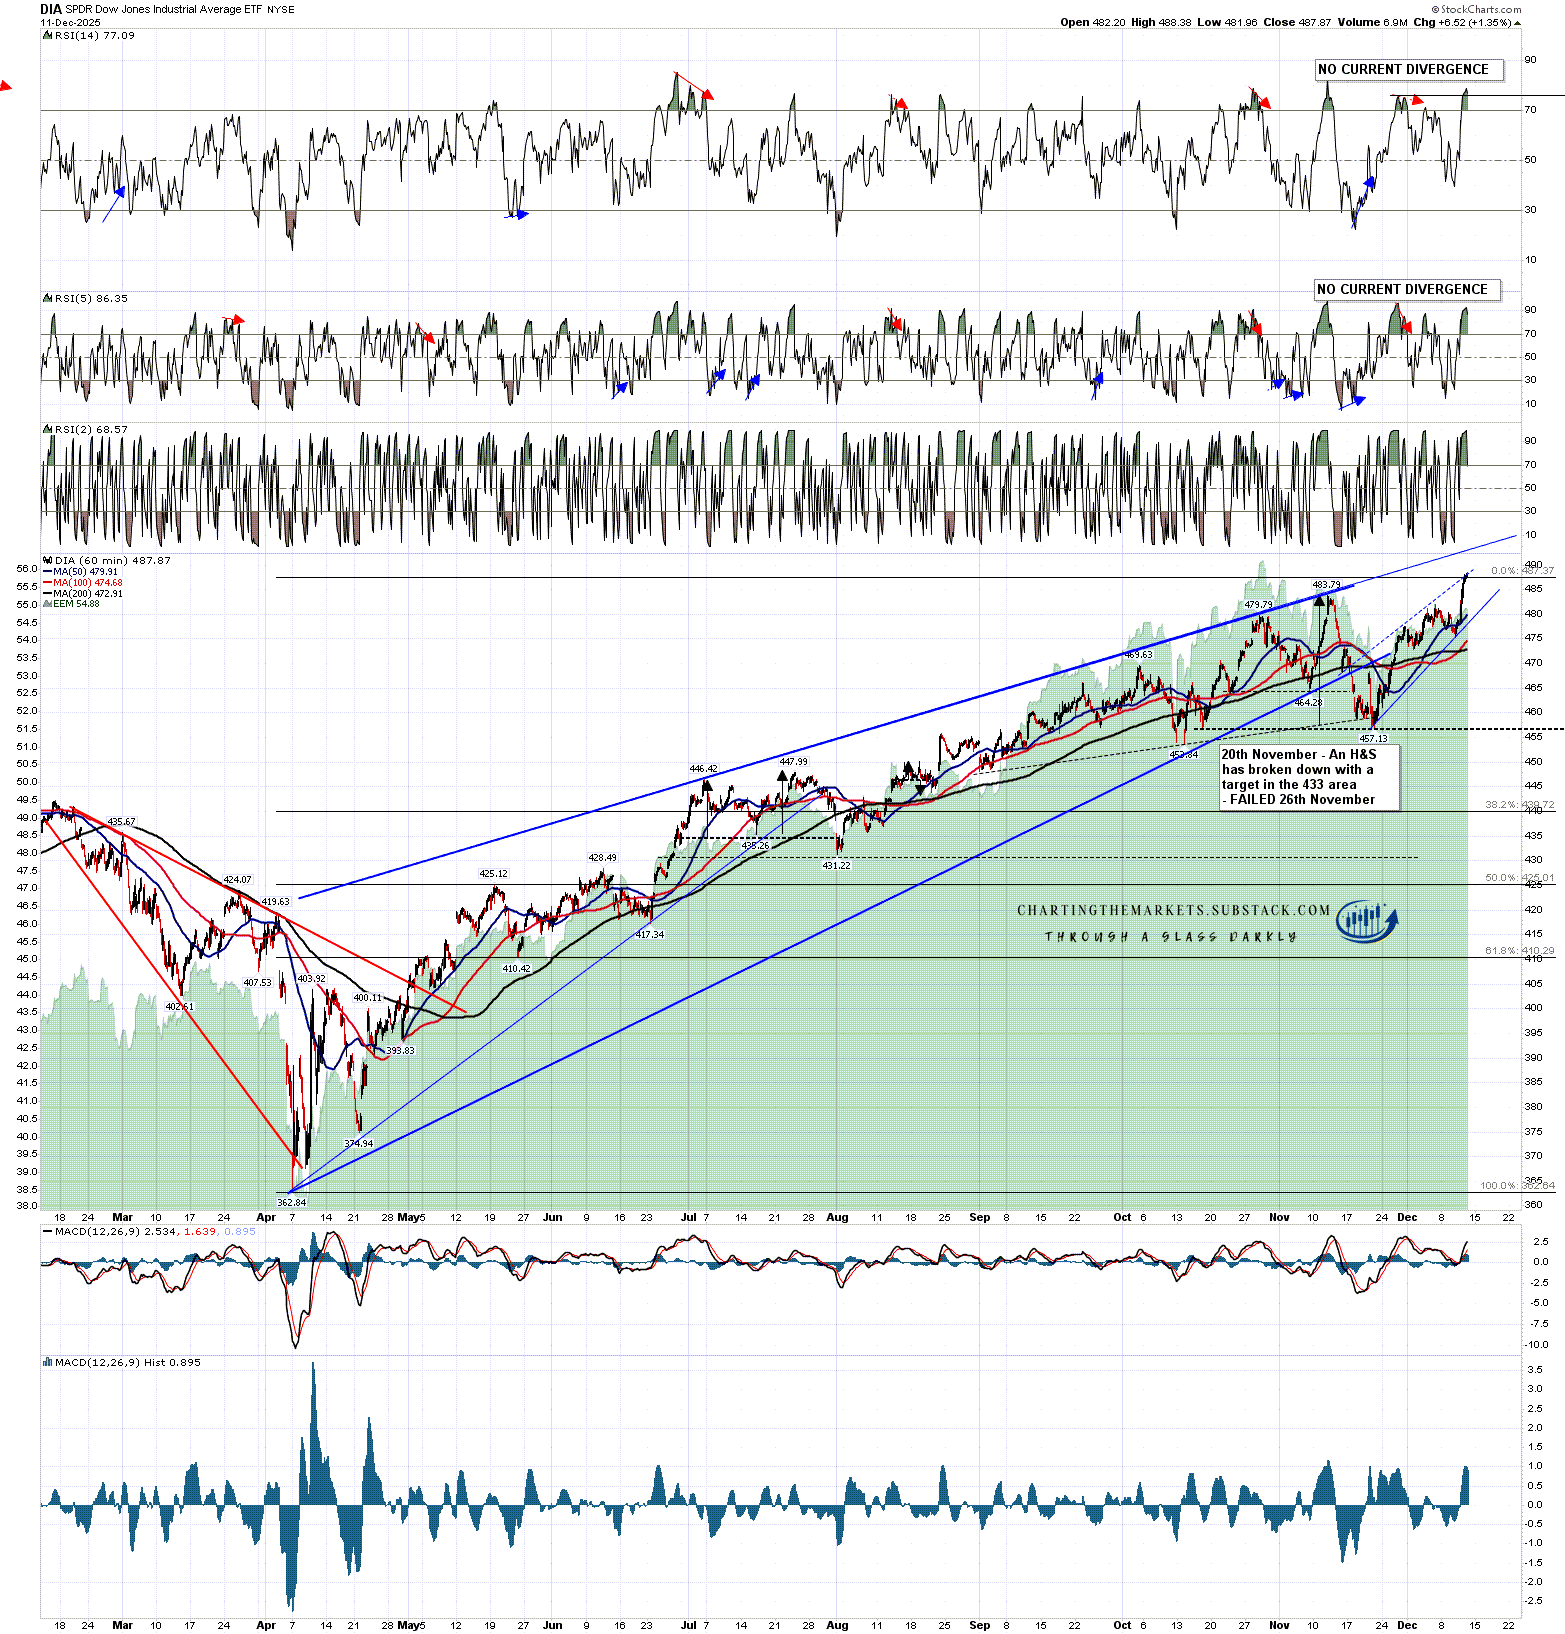
DIA made a new all time high yesterday. I’m expecting this rising wedge from the April low to hold into a much larger top coming in the next couple of months, but it is very possible that DIA might reach and perhaps overthrow that wedge resistance once more before that larger top and, if so, that wedge resistance is currently in the 495 area.
The hourly RSI 14 and daily RSI 5 sell signals on DIA both failed yesterday.
DIA 60min chart:
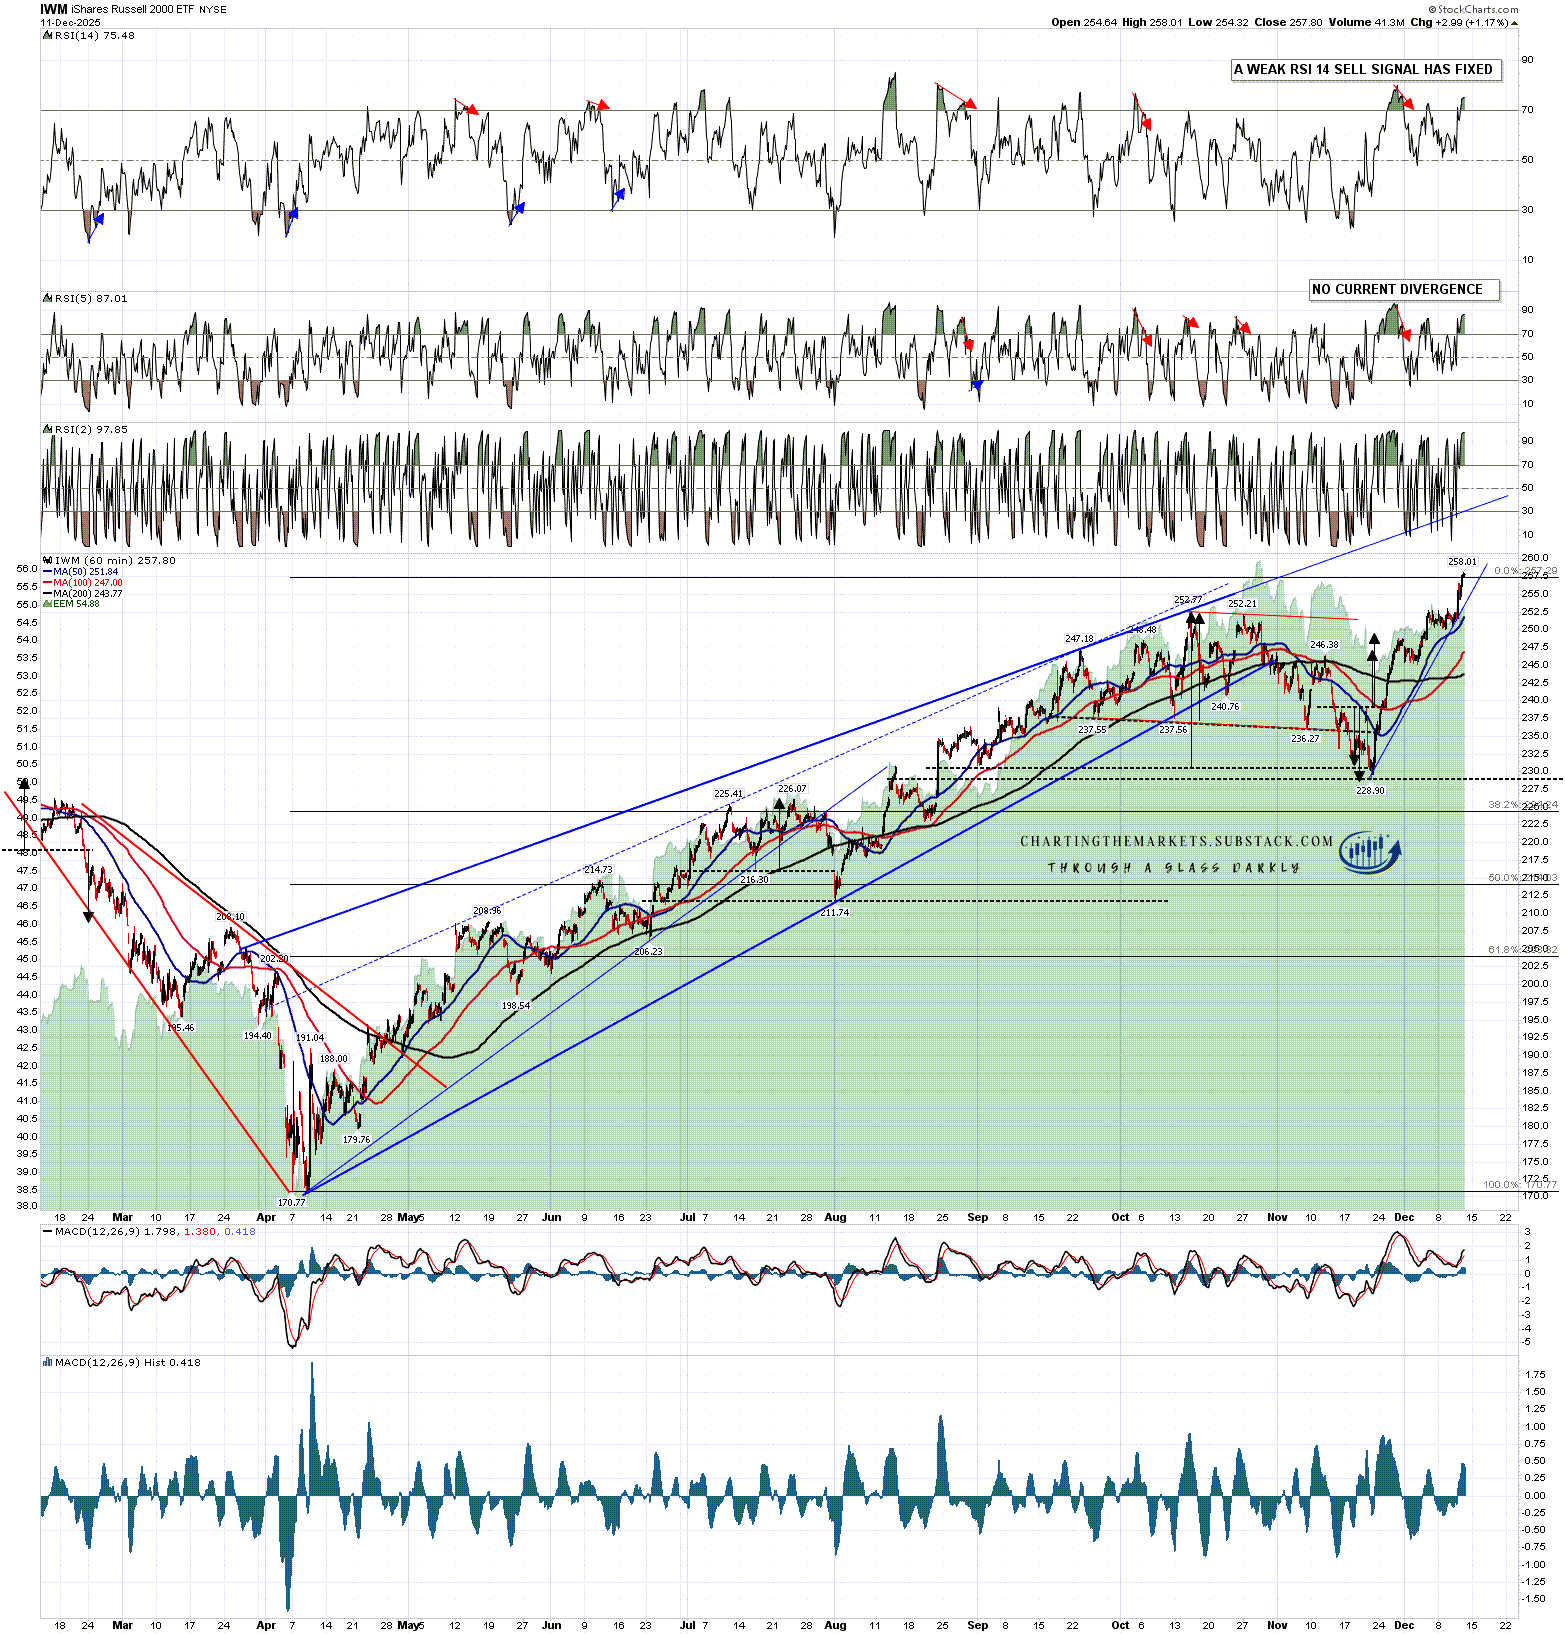
IWM made a new all time high earlier this week, and has been the strongest on this move up from the last low, partly because IWM is seen as the most sensitive to interest rates. I’m expecting this rising wedge from the April low to hold into a much larger top coming in the next couple of months, but it is very possible that IWM might reach that wedge resistance once more before that larger top and, if so, that wedge resistance is currently in the 267 area.
IWM 60min chart:
After the next highs are made I’m leaning towards seeing at least a 5% to 10% correction on these equity indices in the first half of next year.
If you like my analysis and would like to see more, please take a free subscription at my chartingthemarkets substack, where I publish these posts first. I also do a premarket video every day on equity indices, bonds, currencies, energies, precious commodities and other commodities at 8.45am EST, but only for paying subscribers. Other places to find me are my page on the platform previously known as twitter, and my YouTube channel.
No comments:
Post a Comment