
…. half a dozen of the other.
In my last post on Friday 12 December, I was looking at the rally since the late November lows, noting the new all time highs on DIA and IWM, and saying that I was still expecting to see all time high retests on SPX and QQQ in December.
I also noted that QQQ has been the slowest index in the rally so far, and that has made the rally after the initial move up spiky and uncertain. There is a setup here today that could go either way and I wanted to have a quick look at that as it is an interesting one.
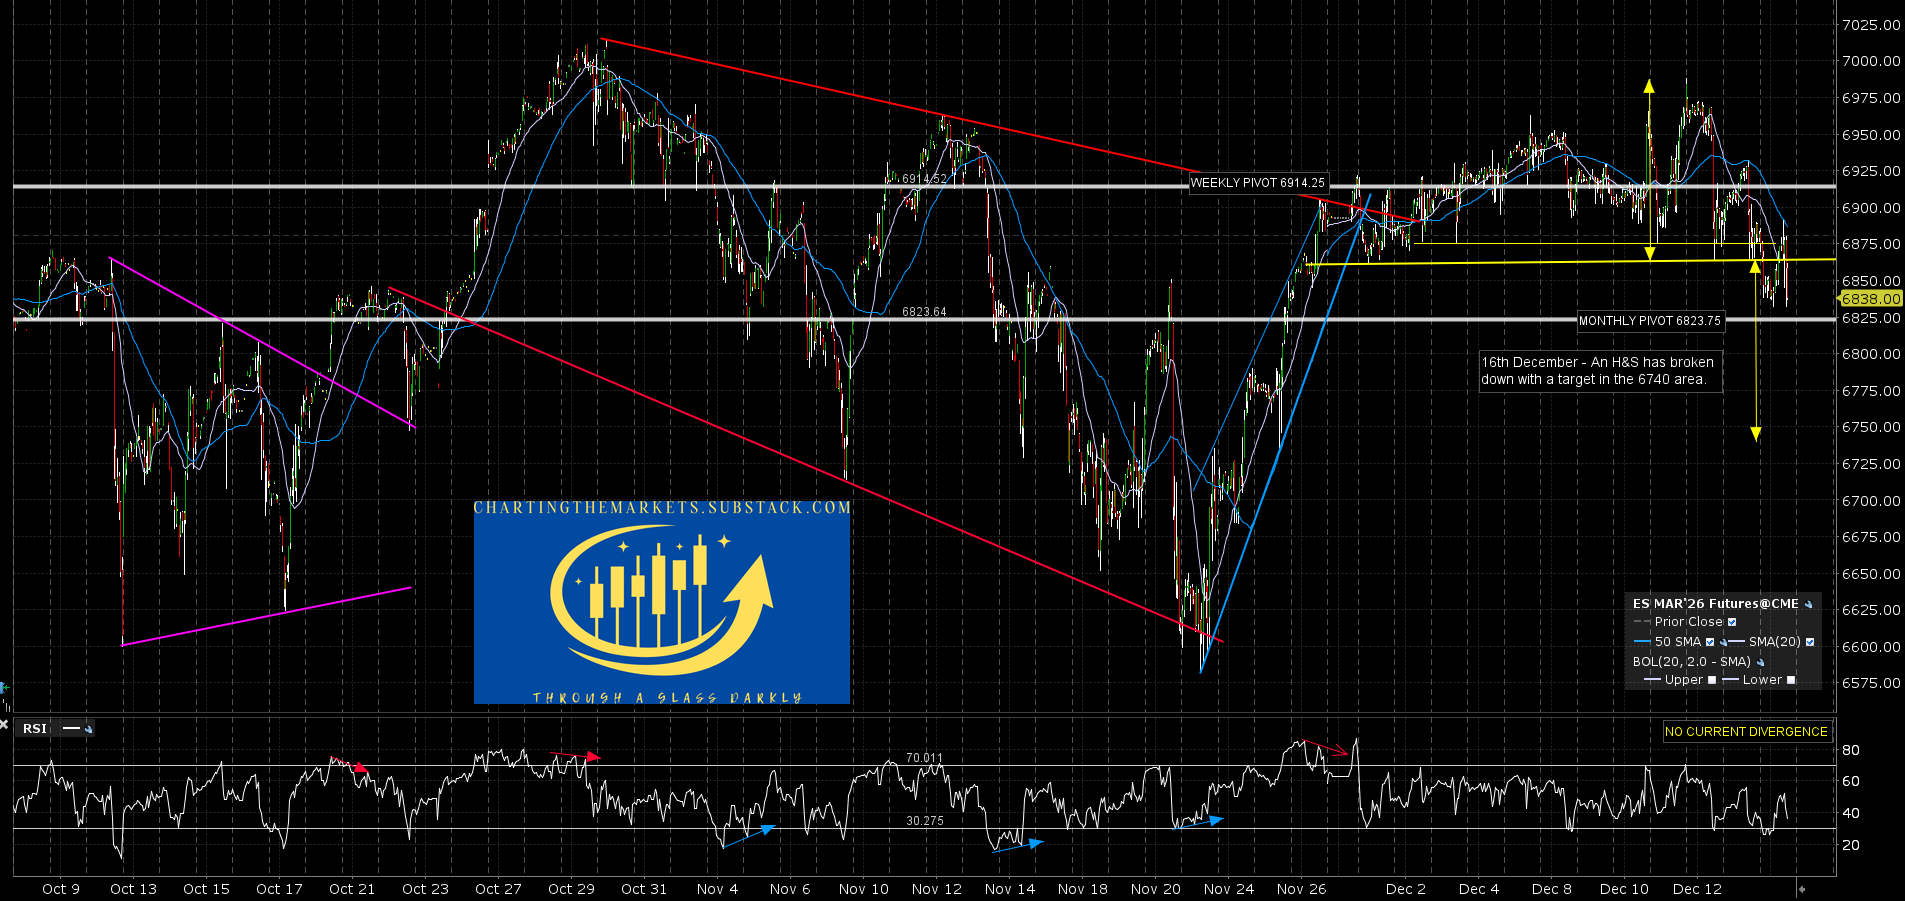
On the bear side there are three H&S patterns that have broken down here. The first is on ES where an H&S has broken down with a target in the 6740 area.
ES Mar daily chart:
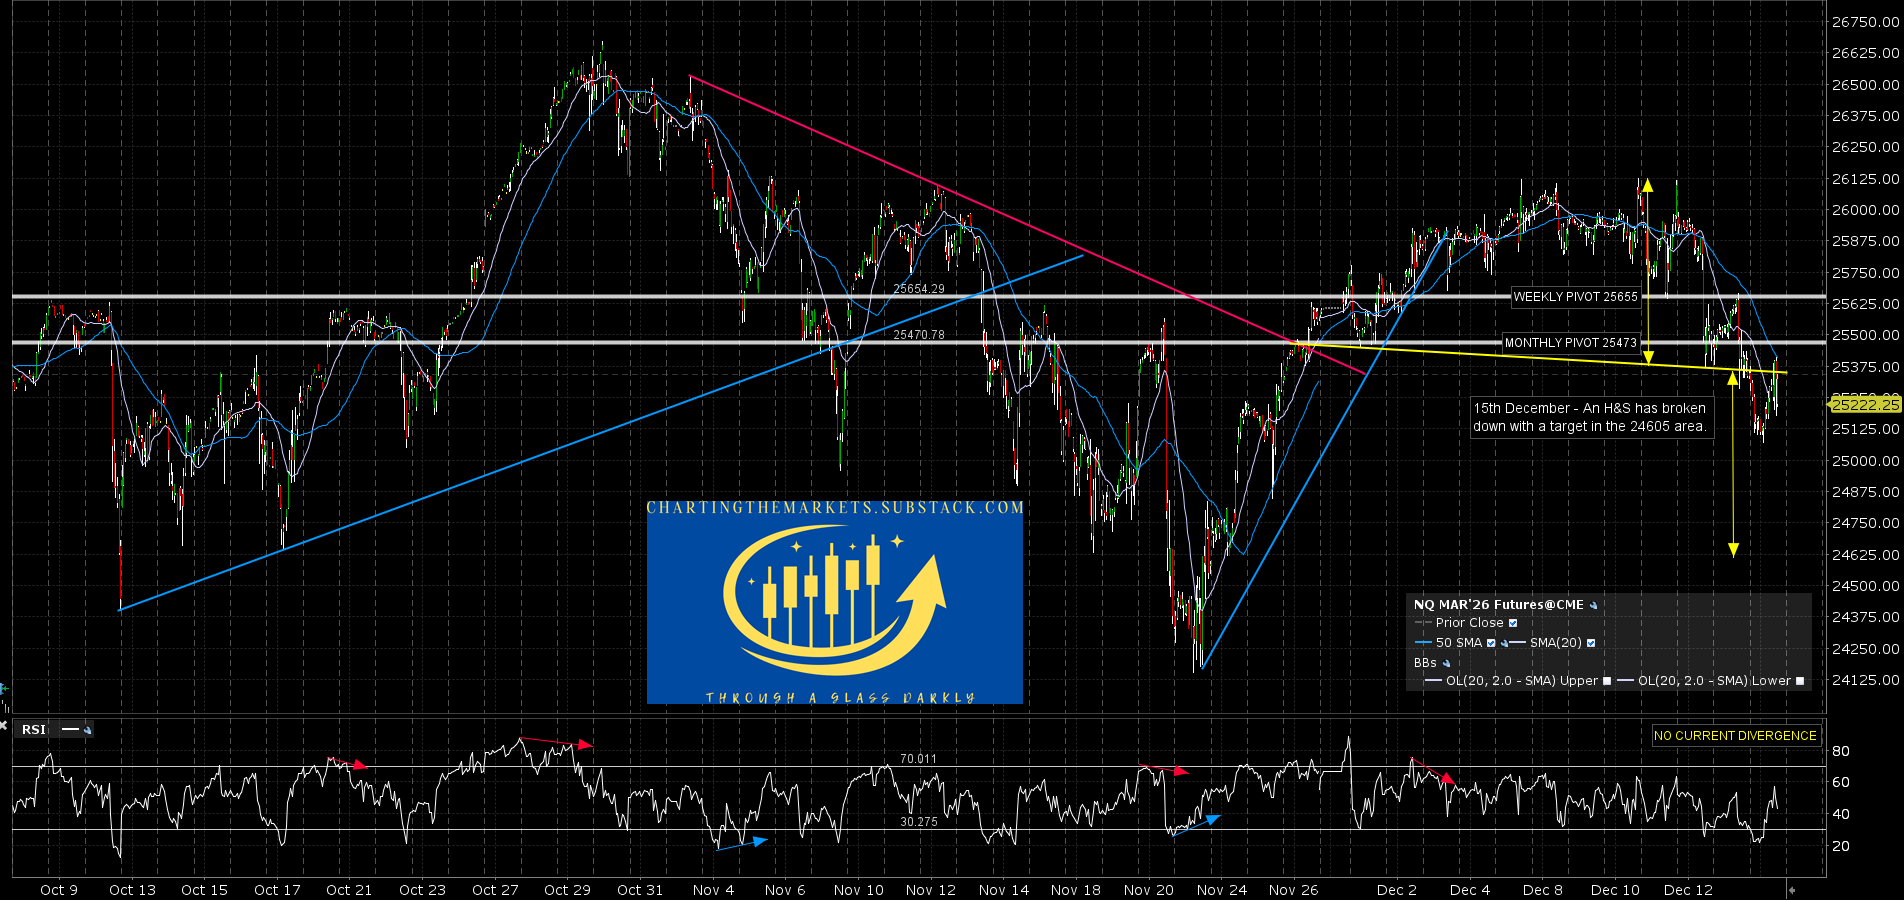
The second is on NQ where an H&S has broken down with a target in the 24605 area.
NQ Mar daily chart:
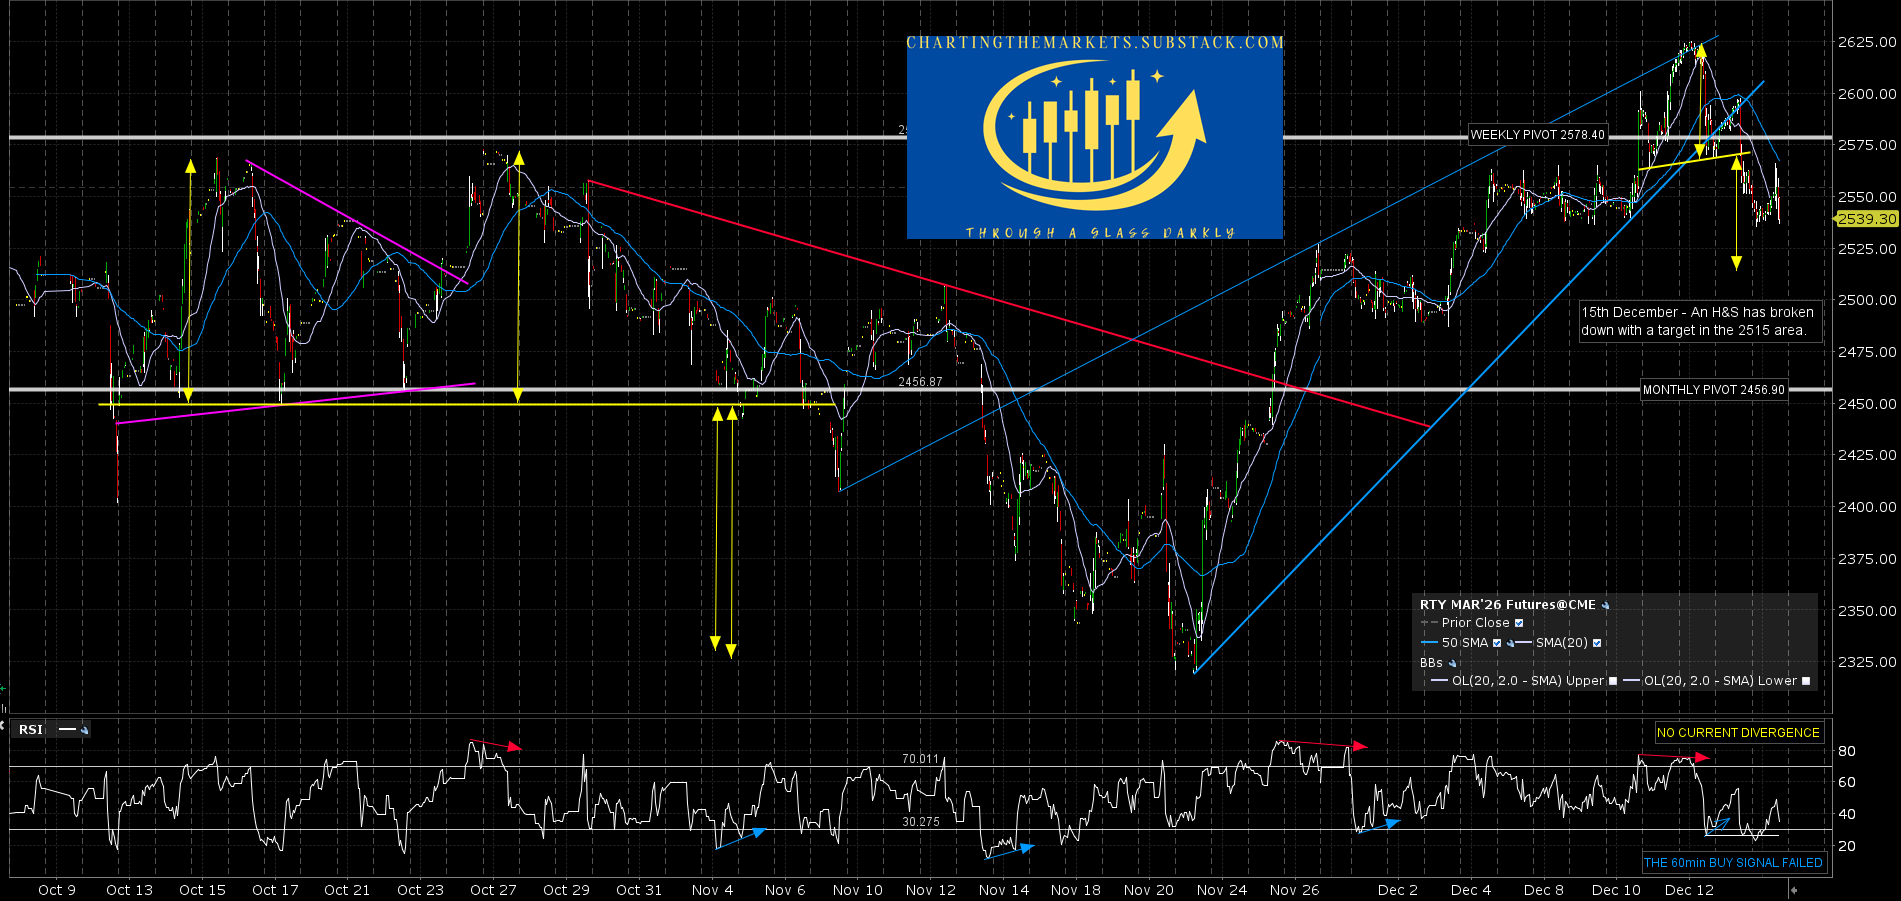
The third is on RTY where an H&S has broken down with a target in the 2515 area.
RTY Mar daily chart:
All the H&S patterns are high quality and there’s something else. I’ve been watching bear flags form on Bitcoin, Ethereum and Solana since late November and I wrote a post about that this morning after the bear flags on Bitcoin and Solana broke down yesterday. A further break down would fit with those flags making their targets at the retests of the late November lows.
The historical stats are also supportive with tomorrow as the only remaining significantly bearish leaning day on equities until new Year’s Eve, so the timing would be decent, and at the open this morning there were also still fixed hourly sell signals on all of SPX, QQQ and IWM, suggesting that we would see some decent, though limited, downside on all of those soon.
On the bull side there was an hourly RSI 14 buy signal fixed on SPX this morning, and another possible hourly RSI 14 buy signal brewing on IWM. Since then though that buy signal has failed and the positive divergence on IWM has been lost.
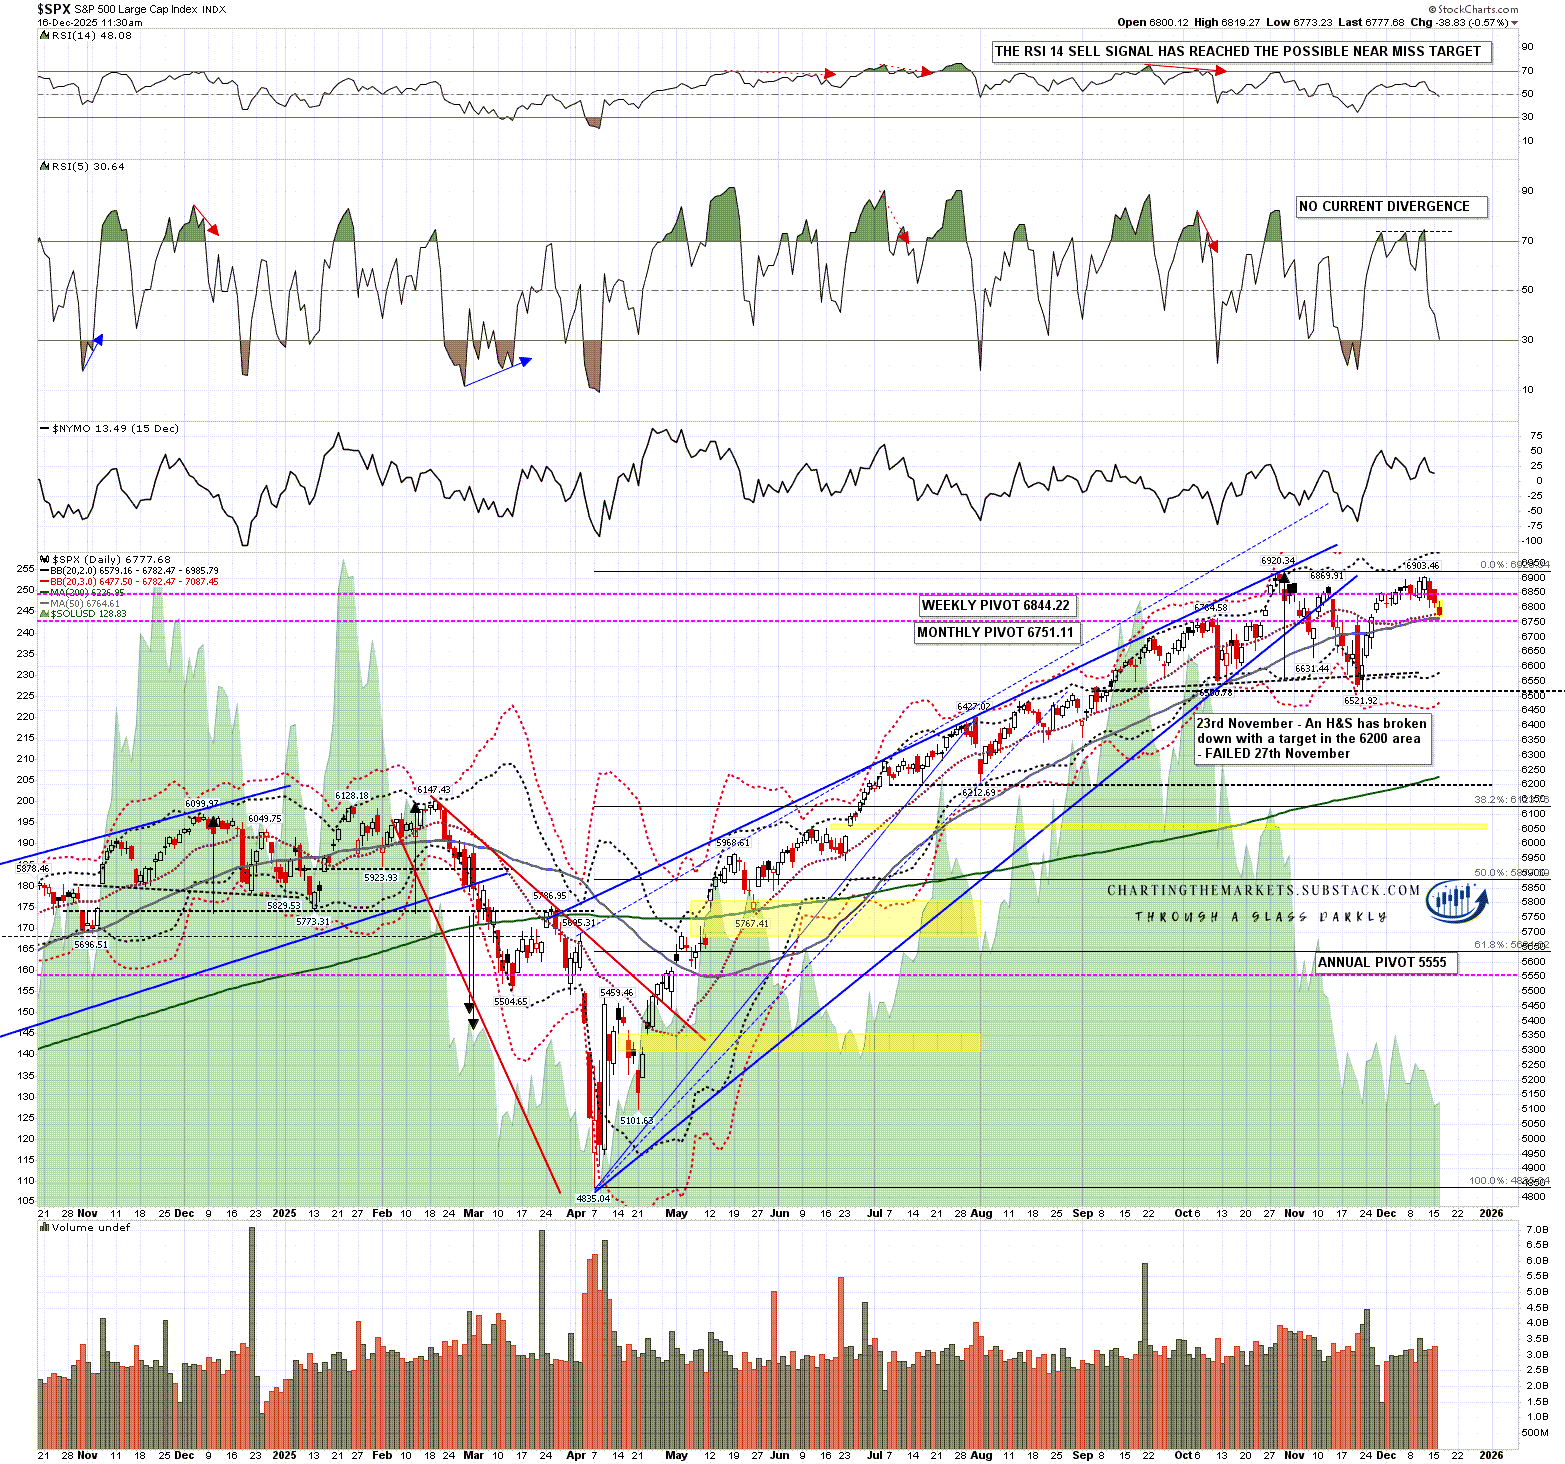
There is also the support at the daily middle bands that both SPX and QQQ were testing at the close yesterday.
On SPX the daily middle band is currently at 6783 and is still being tested. This is a strong support level that has held about 50% of time on a daily close basis when tested since the April low.
SPX daily chart:
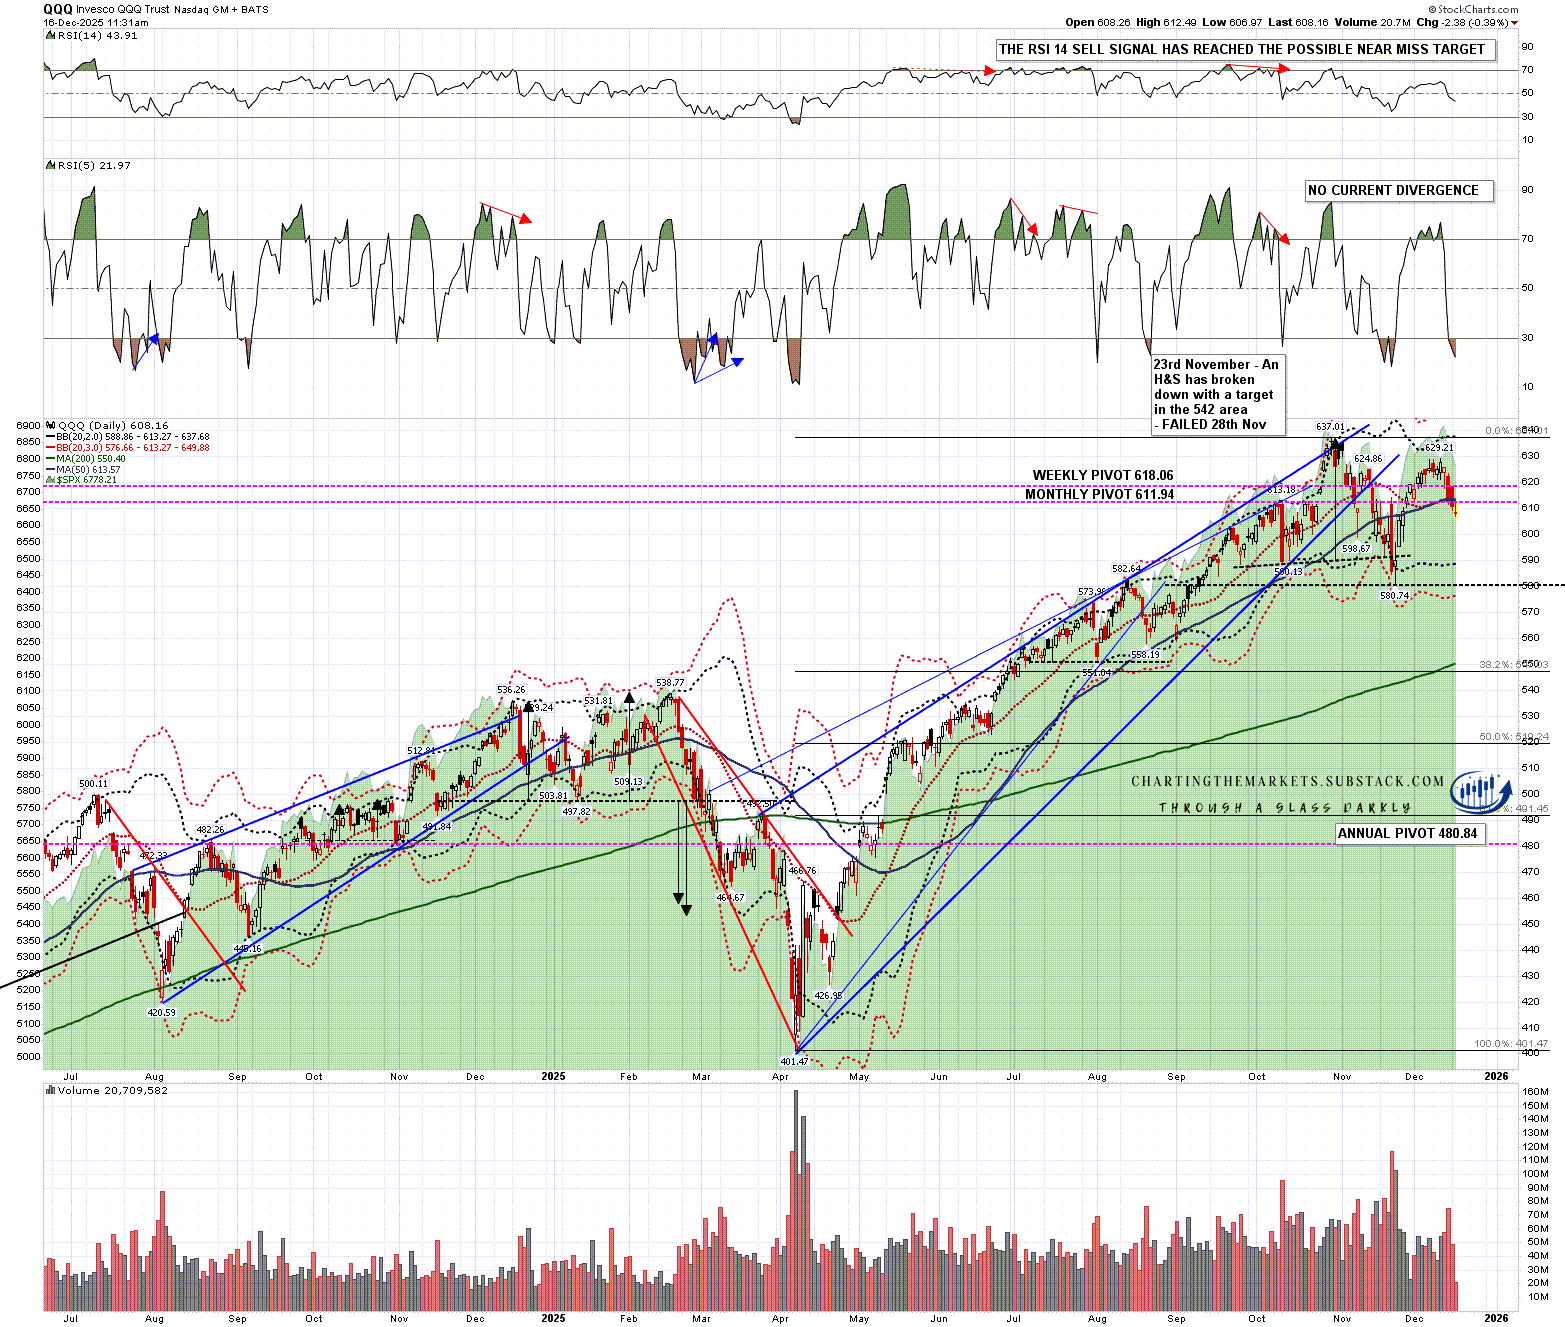
On QQQ the daily middle band is currently at 613 and broke slightly at the close yesterday with the close at 610. There have been eight previous daily breaks below the daily middle band since the April low, and four of those closed back above the daily middle band next next day, rising to seven closing back above the daily middle band by the close on the second day after the break. That gives high odds that we see a close back above by tomorrow’s close, but that does leave room for some more downside in the meantime.
QQQ daily chart:
My preferred scenario in my Crypto post this morning was that both Crypto and equities see some more short term downside over the next day or two, and from there start another leg of the rally that would take us through Xmas and perhaps into the start of January. If we are to see that, then those H&S patterns may all reach target and then set up a buy opportunity into Xmas.
If you like my analysis and would like to see more, please take a free subscription at my chartingthemarkets substack, where I publish these posts first. I also do a premarket video every day on equity indices, bonds, currencies, energies, precious commodities and other commodities at 8.45am EST, but only for paying subscribers. Other places to find me are my page on the platform previously known as twitter, and my YouTube channel.
No comments:
Post a Comment