
There are plenty of risks in the equity and bond markets this year, and the Greenland drama over the last week has been a good illustration of that. There was a lot of political drama last year and so far this year it seems that might even accelerate.
Next year Donald Trump will probably be a lame duck President without control of the House (very likely) and possibly also the Senate (theoretically possible but unlikely), and that may slow the chaos down, though he will still likely have a lot more power than lame duck Presidents have traditionally wielded.
In my post on Monday 19th December I was looking at a setup for possible new all time highs on SPX, QQQ, DIA and IWM in the Santa rally, and some of that played out over the remainder of December.
In my last post on Friday 2nd January I was looking at the strong setup for the remainder of that setup playing out in the first half of January, and that delivered new highs on DIA and IWM but not so far on QQQ which is still lagging the other markets. Given the degree to which QQQ delivered much of the market gains on US markets last year that is a concern.
Let’s review how all of these indices are now looking in this strong move up from the lows last April.
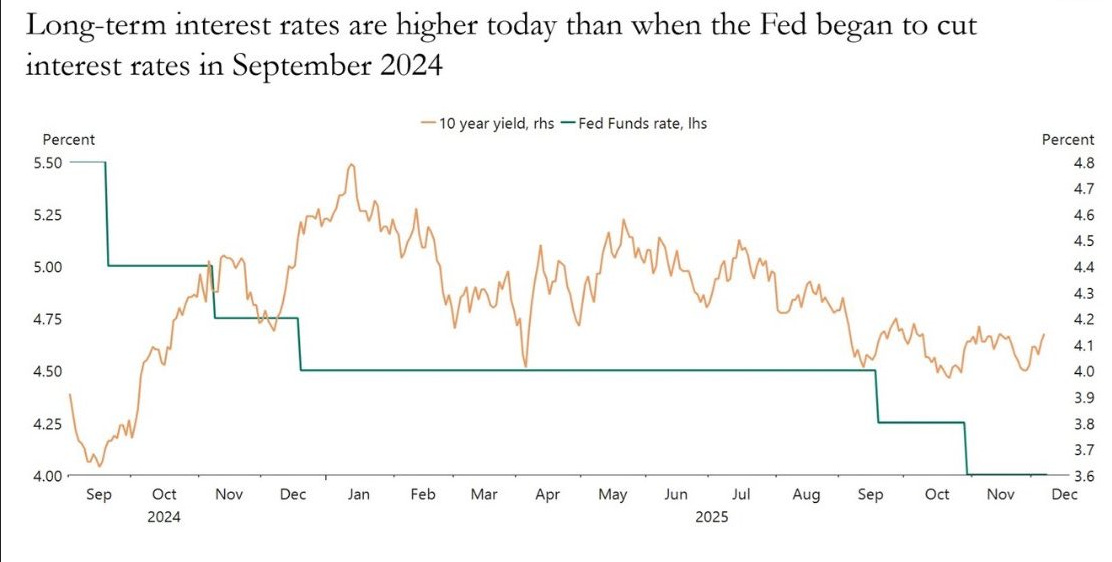
The leader is clearly IWM and one explanation that I have seen for this is that smaller companies are more sensitive to interest rates. I’m skeptical about that as while the Fed has cut the Fed Funds rate by 1.5% since September 2024, US Treasury yields, which are the basis for all borrowing in the US, have nonetheless risen over that period. I’m posting the chart below as my Chart of the Day today and it makes that very clear.
That’s not surprising, to the extent that I wrote a post saying that was likely to be the case just before the cut in November 2024, and as an aside I’d further note that in the event that Trump did manage to take over the Fed and cut the Fed Funds Rate to 1%, I suspect that treasury yields would rise further from current levels. The Fed does not control interest rates, bond markets control interest rates.
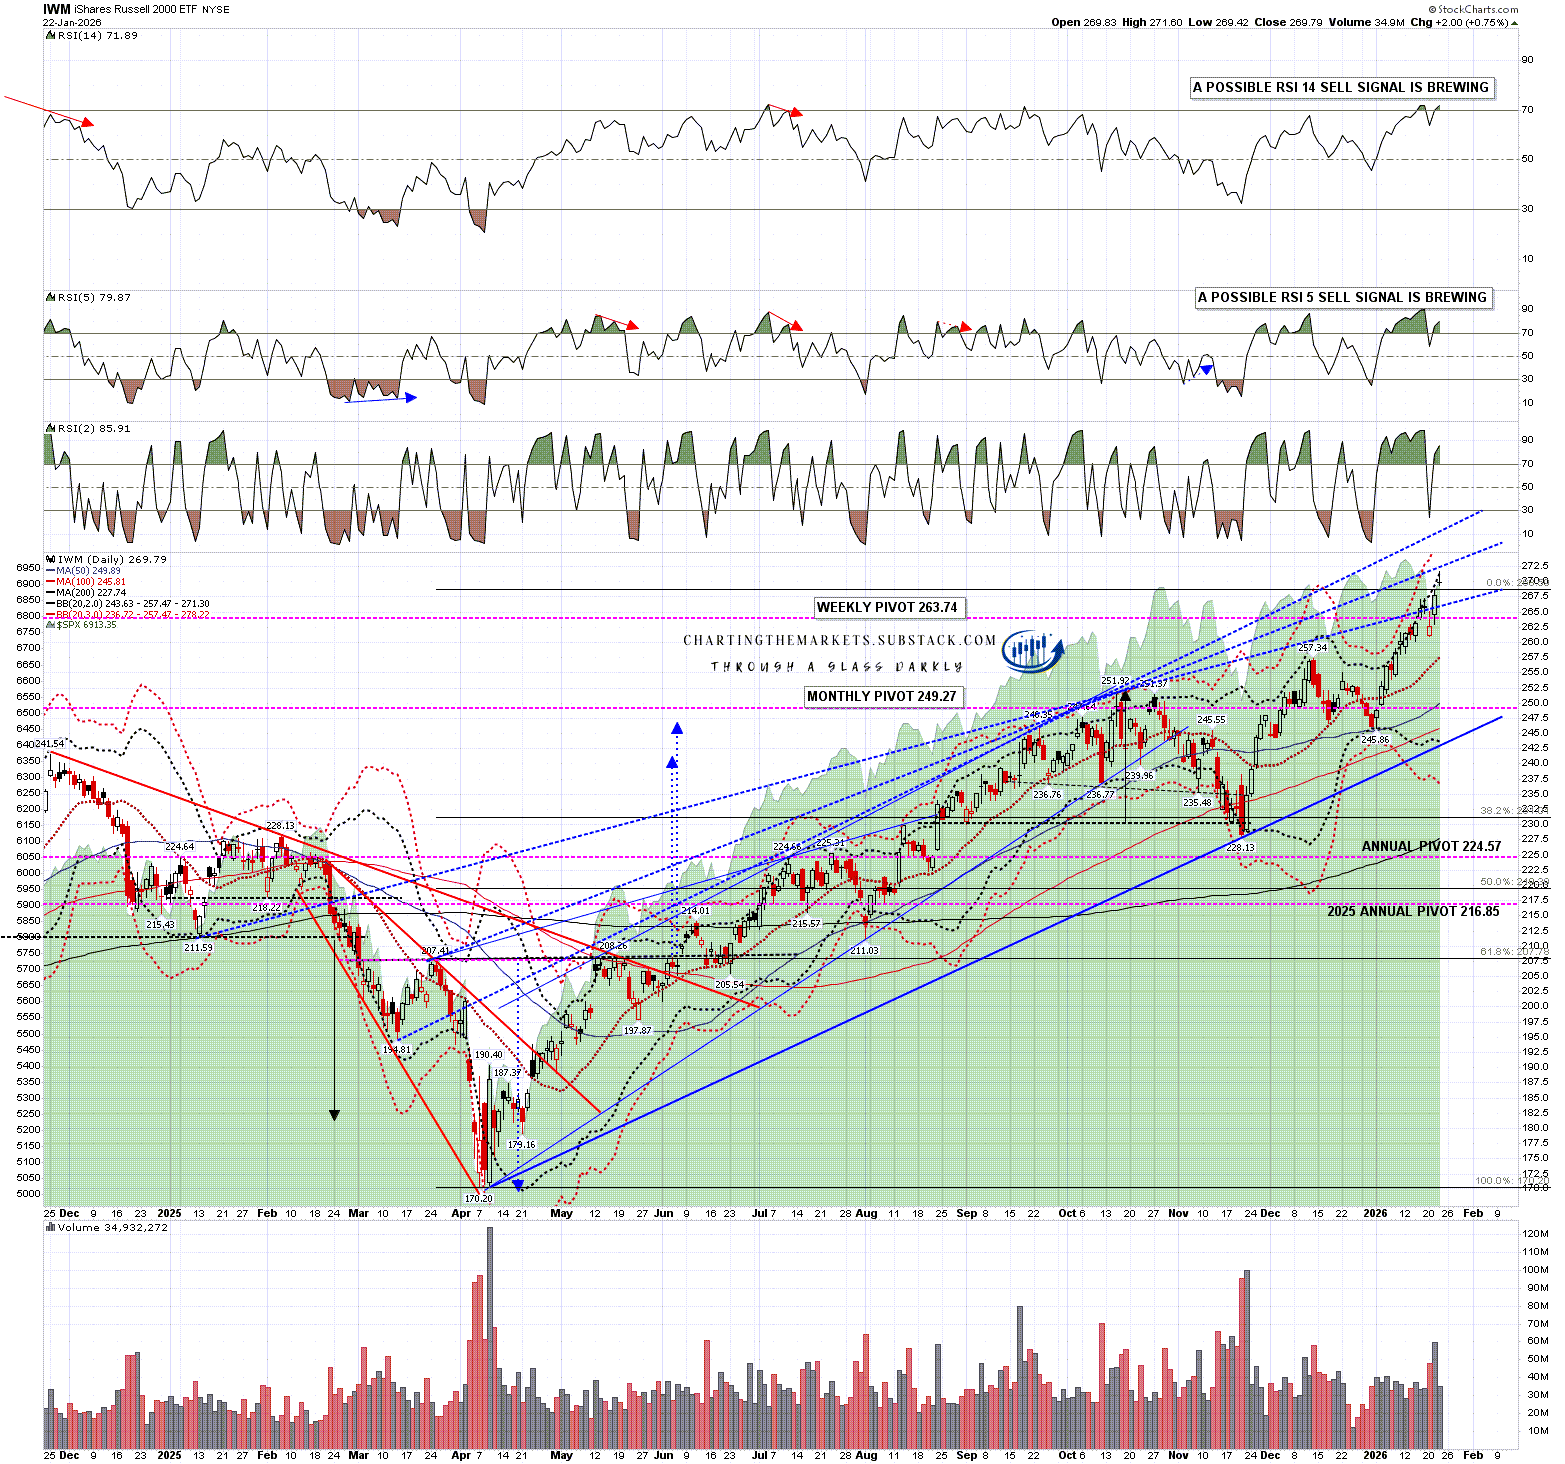
Rising wedges formed over all of IWM, DIA, SPX & QQQ from April to October last year, and broke down from late October into early November. Since then IWM and DIA have once again reached the wedge resistance trendline to enlarge the original rising wedge and IWM has broken up and gone higher.
In theory this could be a bearish overthrow but I have drawn in two possible alternate resistance trendlines and am expecting IWM to hit and reverse near one or the other.
In the decline over the last week IWM fell the least and was the only one of the four not to test the daily middle band. There is no obvious topping pattern fixed or forming on it.
IWM daily chart:
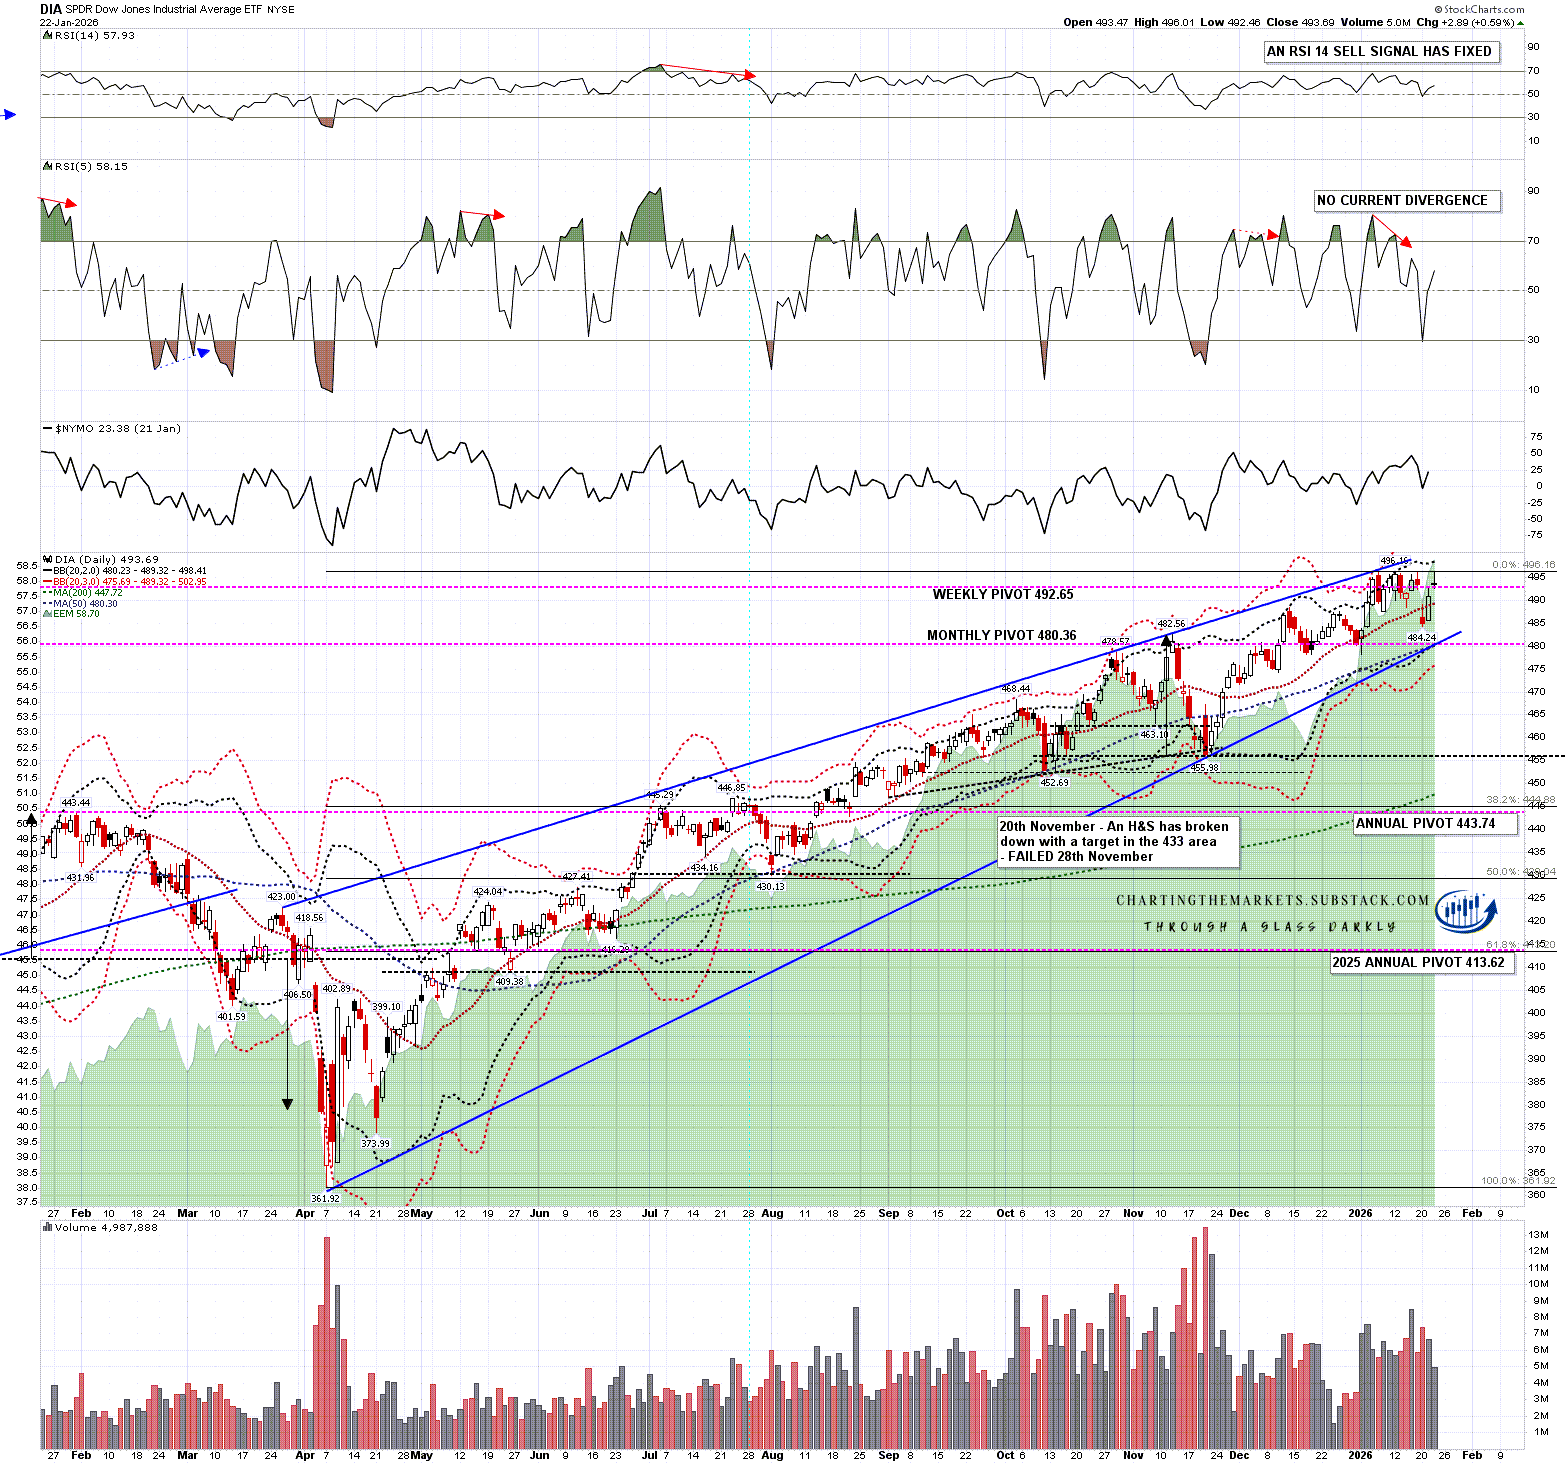
DIA has been the second strongest index since October and also reached wedge resistance. There is currently a very high quality larger rising wedge from the April low and no obvious topping pattern forming.
DIA broke below the daily middle band for a day on Tuesday, broke back above on Wednesday, and confirmed that break above yesterday with another close above it.
DIA daily chart:
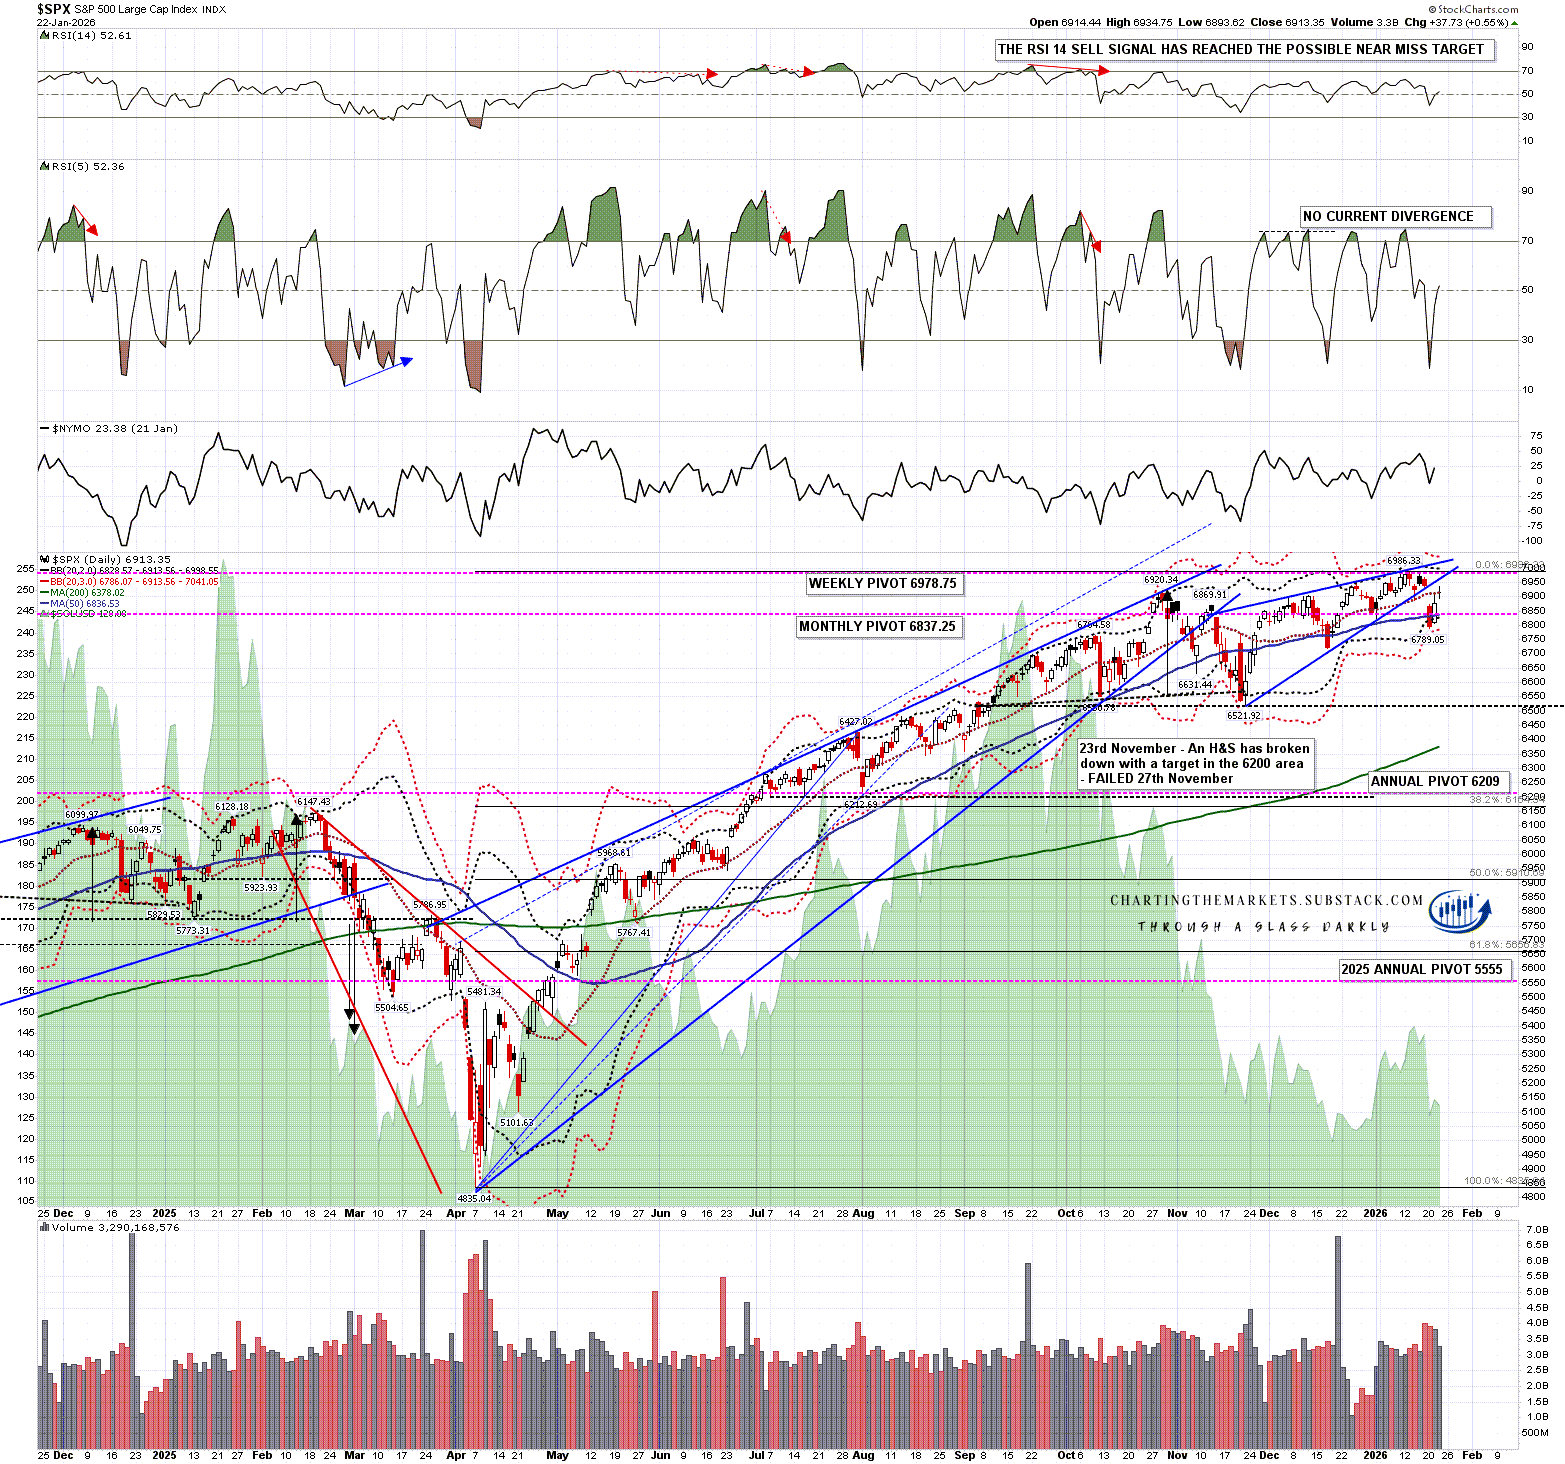
SPX retested the October high but hasn’t progressed much further. There is a possible middling quality double top setup or possible part formed H&S with support at the November low at 6521.92.
SPX broke below the daily middle band on Tuesday, rallied back to test it from below on Wednesday and closed almost exactly on it yesterday. The daily middle band remains resistance and this is a warning that we may see more weakness short term.
SPX daily chart:
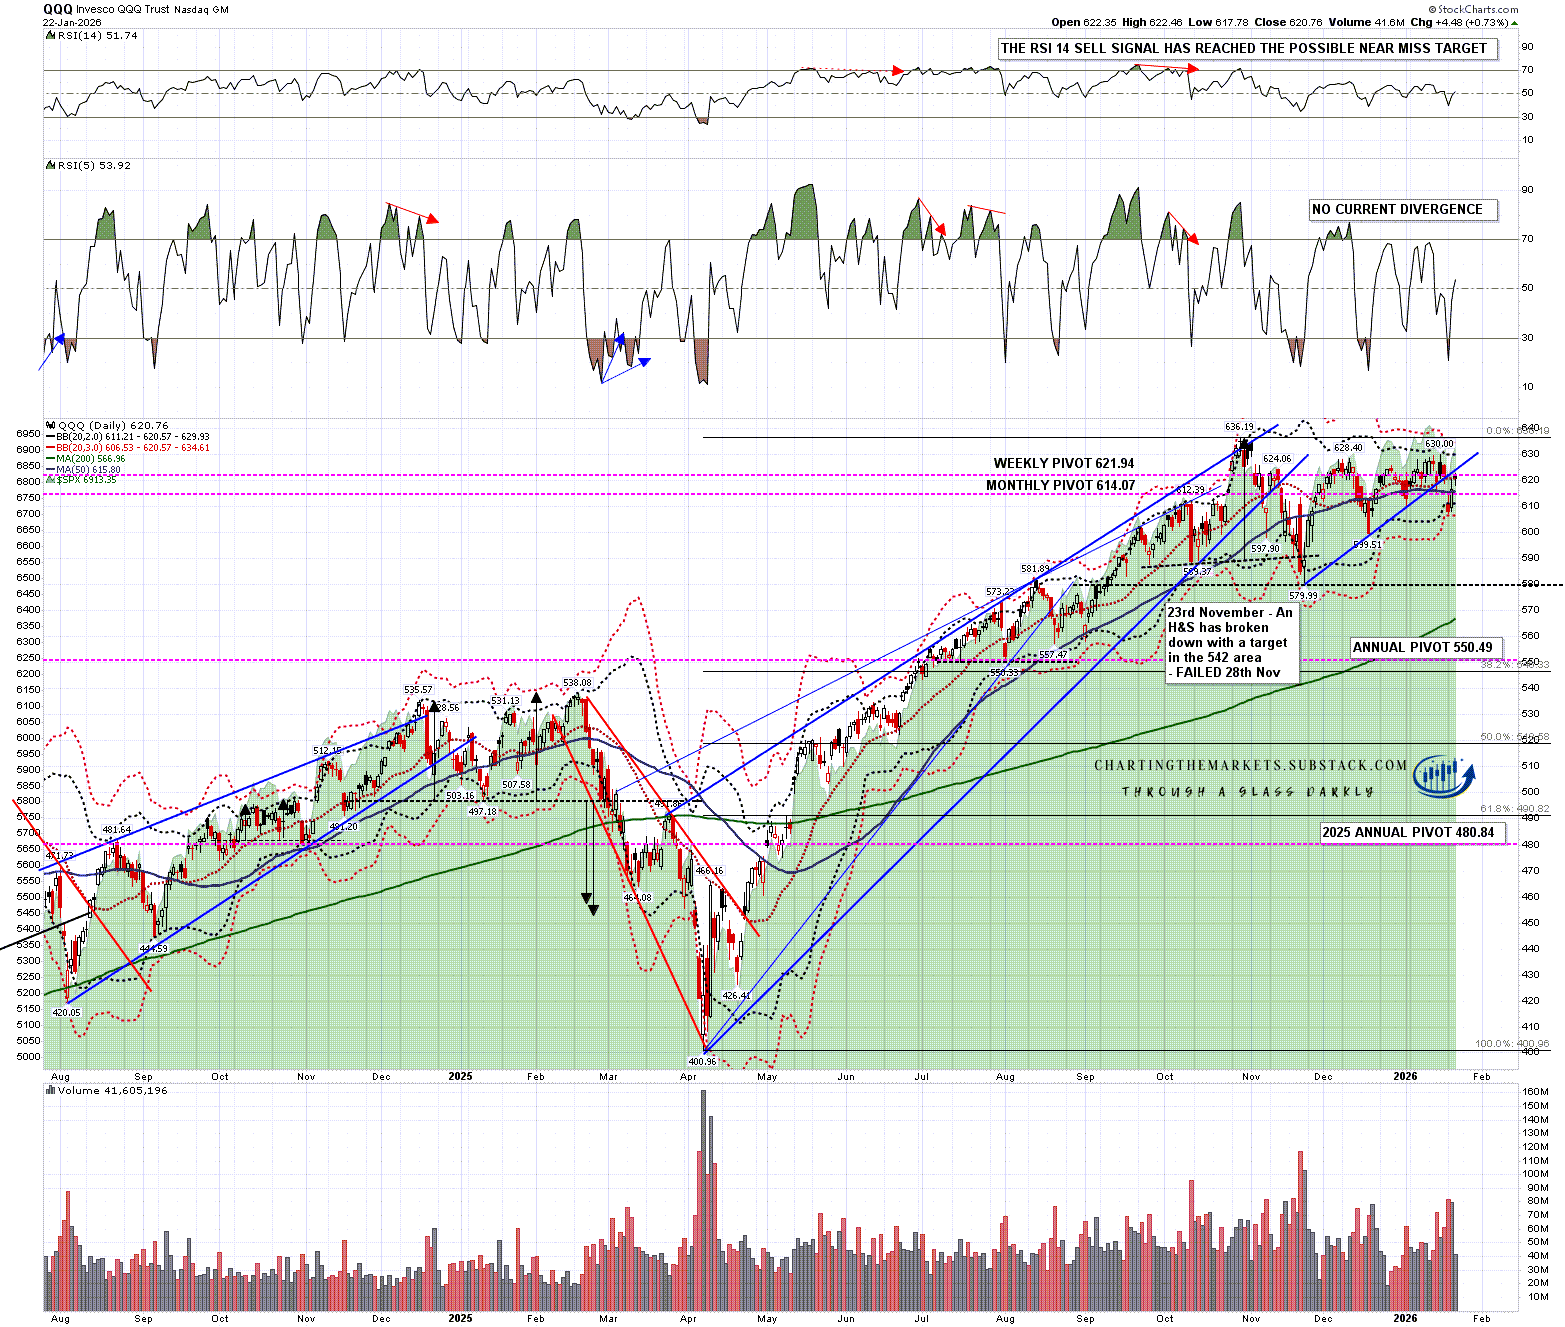
QQQ is the only one of these indices that has not yet retested the October high. There is no obvious topping pattern forming and if I was to suggest a pattern forming on it from the October high I would be looking for either a possible bull flag or triangle.
That raises the possibility that QQQ may need more downside before any all time high retest and as the daily middle band action on QQQ is virtually identical to that seen on SPX this week, that downside could be starting here:
QQQ daily chart:
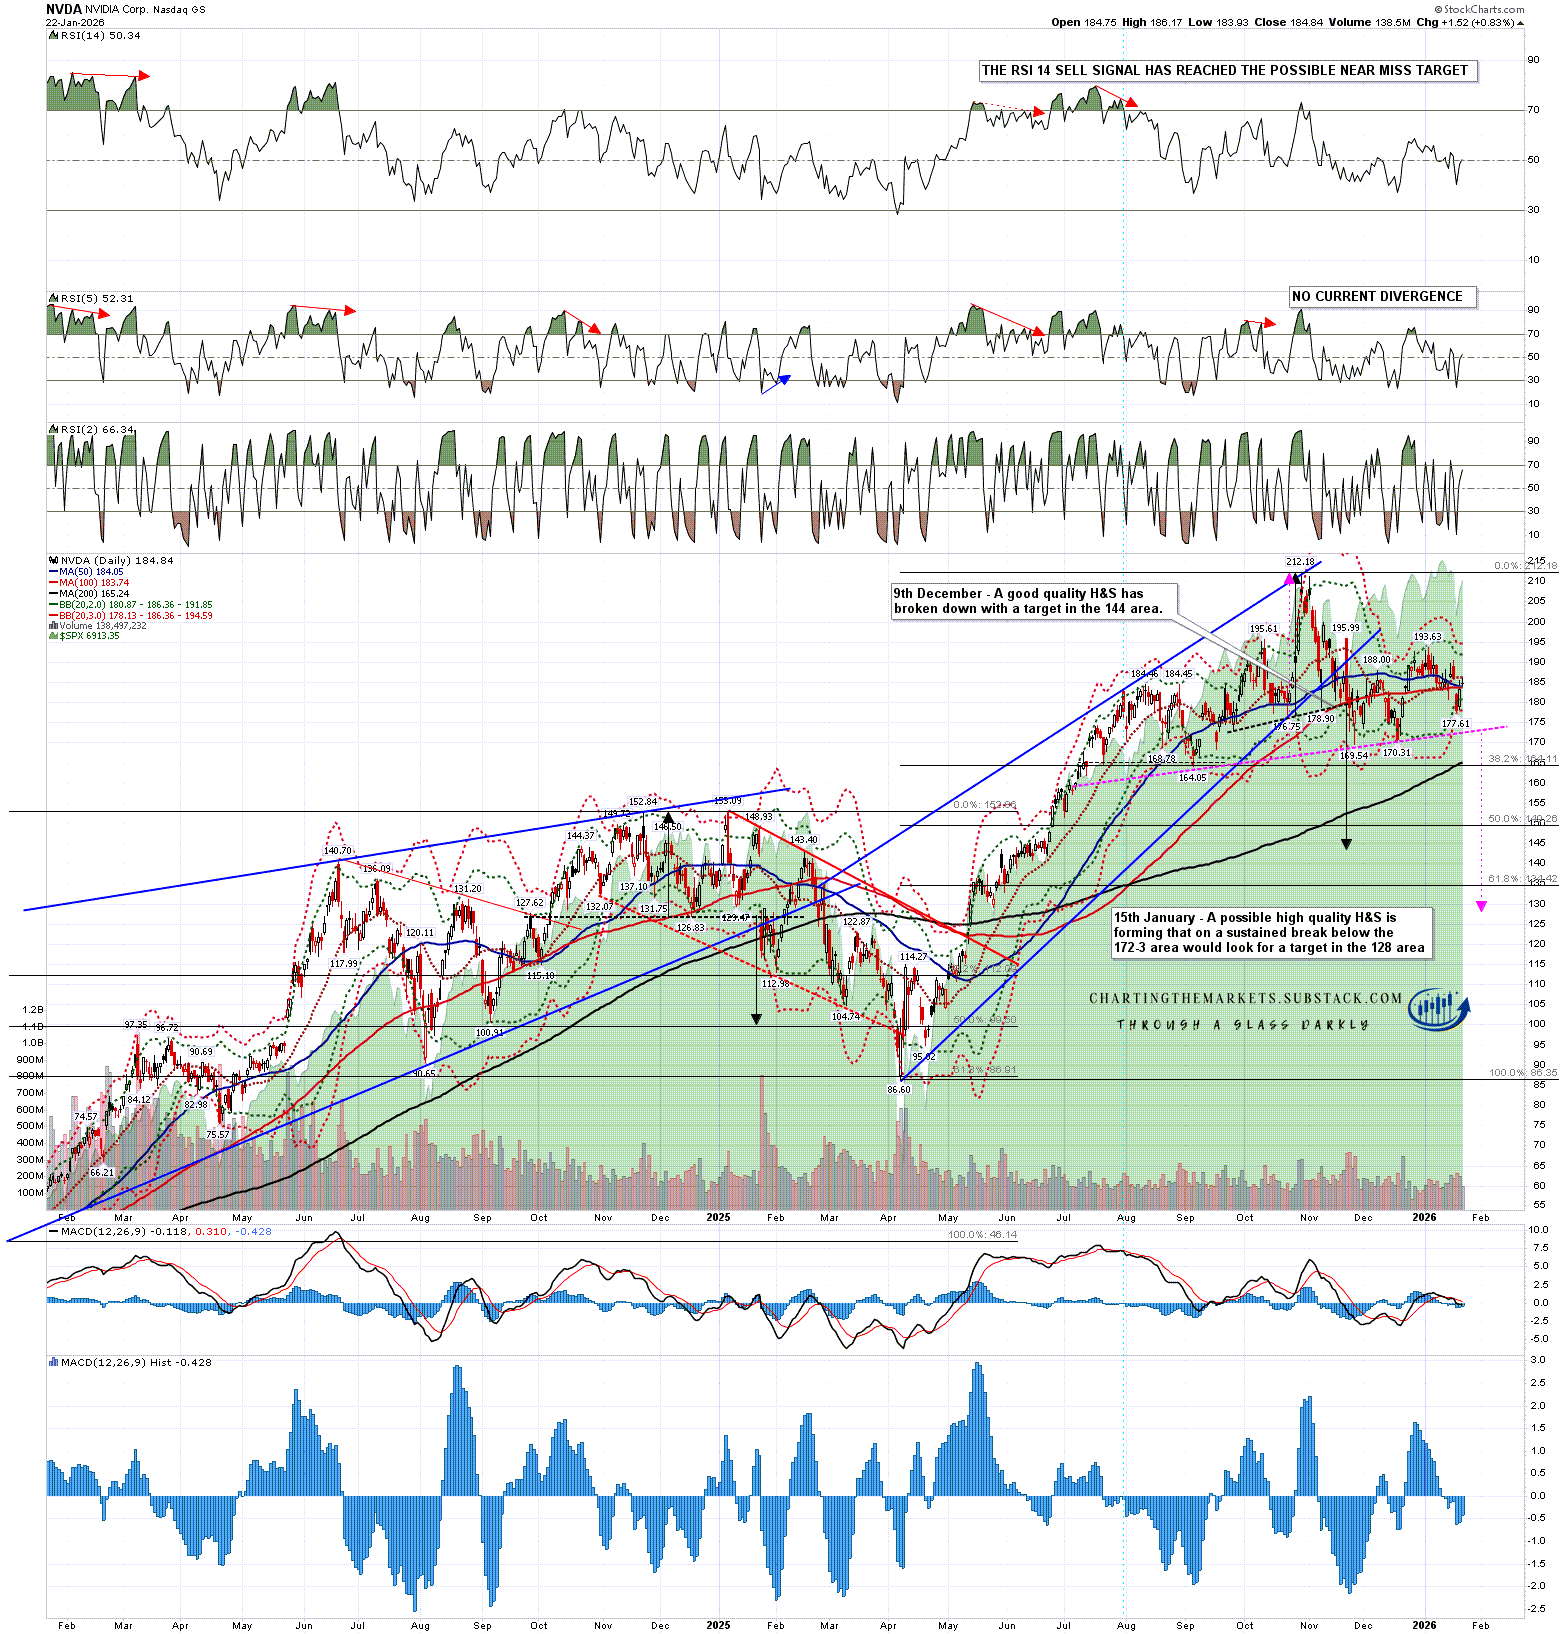
Tech was leading the move up from April into the October high but has been trailing since. On the Nvidia daily chart you can see that a good quality H&S broke down in early December with a target in the 144 area. That may be evolving into an even higher quality H&S that might break down with a target in the 128 area.
There is real cause for concern here that there may be more downside coming soon on Tech, and I’d add that I also have decent quality possible large topping setups forming here on GOOG, META & TSLA. There was one on AAPL as well, but that H&S broke down at the start of January and just reached the target at 243 on Tuesday.
NVDA daily chart:
Does it look as though a major high is forming here? Possibly but, if so, it doesn’t look complete. In the short term bulls need SPX and QQQ to break over their daily middle bands to go much higher. If that doesn’t happen then I’d note that the last week of January historically leans mildly bearish, and the first week of February leans significantly bullish.
If you like my analysis and would like to see more, please take a free subscription at my chartingthemarkets substack, where I publish these posts first. I also do a premarket video every day on equity indices, bonds, currencies, energies, precious commodities and other commodities at 8.45am EST, but only for paying subscribers. Other places to find me are my page on the platform previously known as twitter, and my YouTube channel.
No comments:
Post a Comment