
There were four big setups, each covering multiple tickers, that I was looking in my bi-weekly The Bigger Picture webinars last year and at the start of this year that looked very strong, but I was struggling to come up with any decent fundamental reasons why they might play out.
That changed when the US attacked Iran on 28th February, and I have since written two posts on the (very bullish) setups on the oil charts first on 3rd March, and after the first phase of those bottoming setups had all made target, with a follow up on 13th March. As these patterns were all at the bottom of decent quality bull flags from the 2022 highs, I am still expecting to see full retests of the 2022 highs on all of $WTIC (Light Crude Oil), $BRENT (Brent Crude Oil) and $GASO (Gasoline), with $HOIL (Heating Oil) having already reached that target.
I’m going to assign this bullish oil setup as War, as those are the first of these four horsemen, as I’m thinking that all four of these big setups may make their targets over coming weeks and months. They may not of course if the war is successfully ended soon for whatever reason, but at the moment that seems doubtful, and there seems a very strong possibility that this conflict may persist and widen over the next few months, with an oil shock that may be larger than the big oil crisis in the 1970s.
I’m going to do posts on each of these remaining three big setups over the next few days and they will be as follows:
Pestilence - The US Dollar
Famine - Wheat, Corn and Cotton
Death - Bonds
The horseman assignments are a bit whimsical, but the first in the sequence is obviously War, and oil was the first setup to move seriously. Wheat & Corn are obviously Famine. The Bonds setup is so alarming I have assigned that as Death, so the US Dollar gets Pestilence as the one remaining.
Today I will be looking at the very bullish setup on the US Dollar (USD) into a retest of the 2022 high at 114.78.
To a large extent this looks similar to the bullish setup on the oils when I wrote that first post on 3rd March, as we see the same bull flag from the 2022 high, and reversal patterns from the lows over the last few months that have not yet delivered.
I wrote a post looking at this setup last year on 26th June, and in more detail than I’ll be showing today, so if you want to see the full setup including the strong supporting patterns on EURUSD and GBPUSD that is worth a read. I was saying then that US government policies were not looking particularly USD friendly, and we might instead see the setup break down, and the double bottom that I was looking at on the USD daily chart then subsequently broke up and failed back into the lows in January, which had me wondering about a possible break lower again. From the January low there was a modest rally into the end of February.
What was very interesting though was what happened at the start of the Iran War. Stock markets fell after the war started, which is normal, but what we would usually have also seen is bonds and golds going up in a flight to safety trade. That didn’t happen, with both of those falling, but what did go up in response was USD, which rose (low to high) about 2.5% in what appeared to be a flight to safety trade.
Now that is very interesting, as we have seen something like this happen before, back in 2022 in the months after Russia invaded Ukraine.
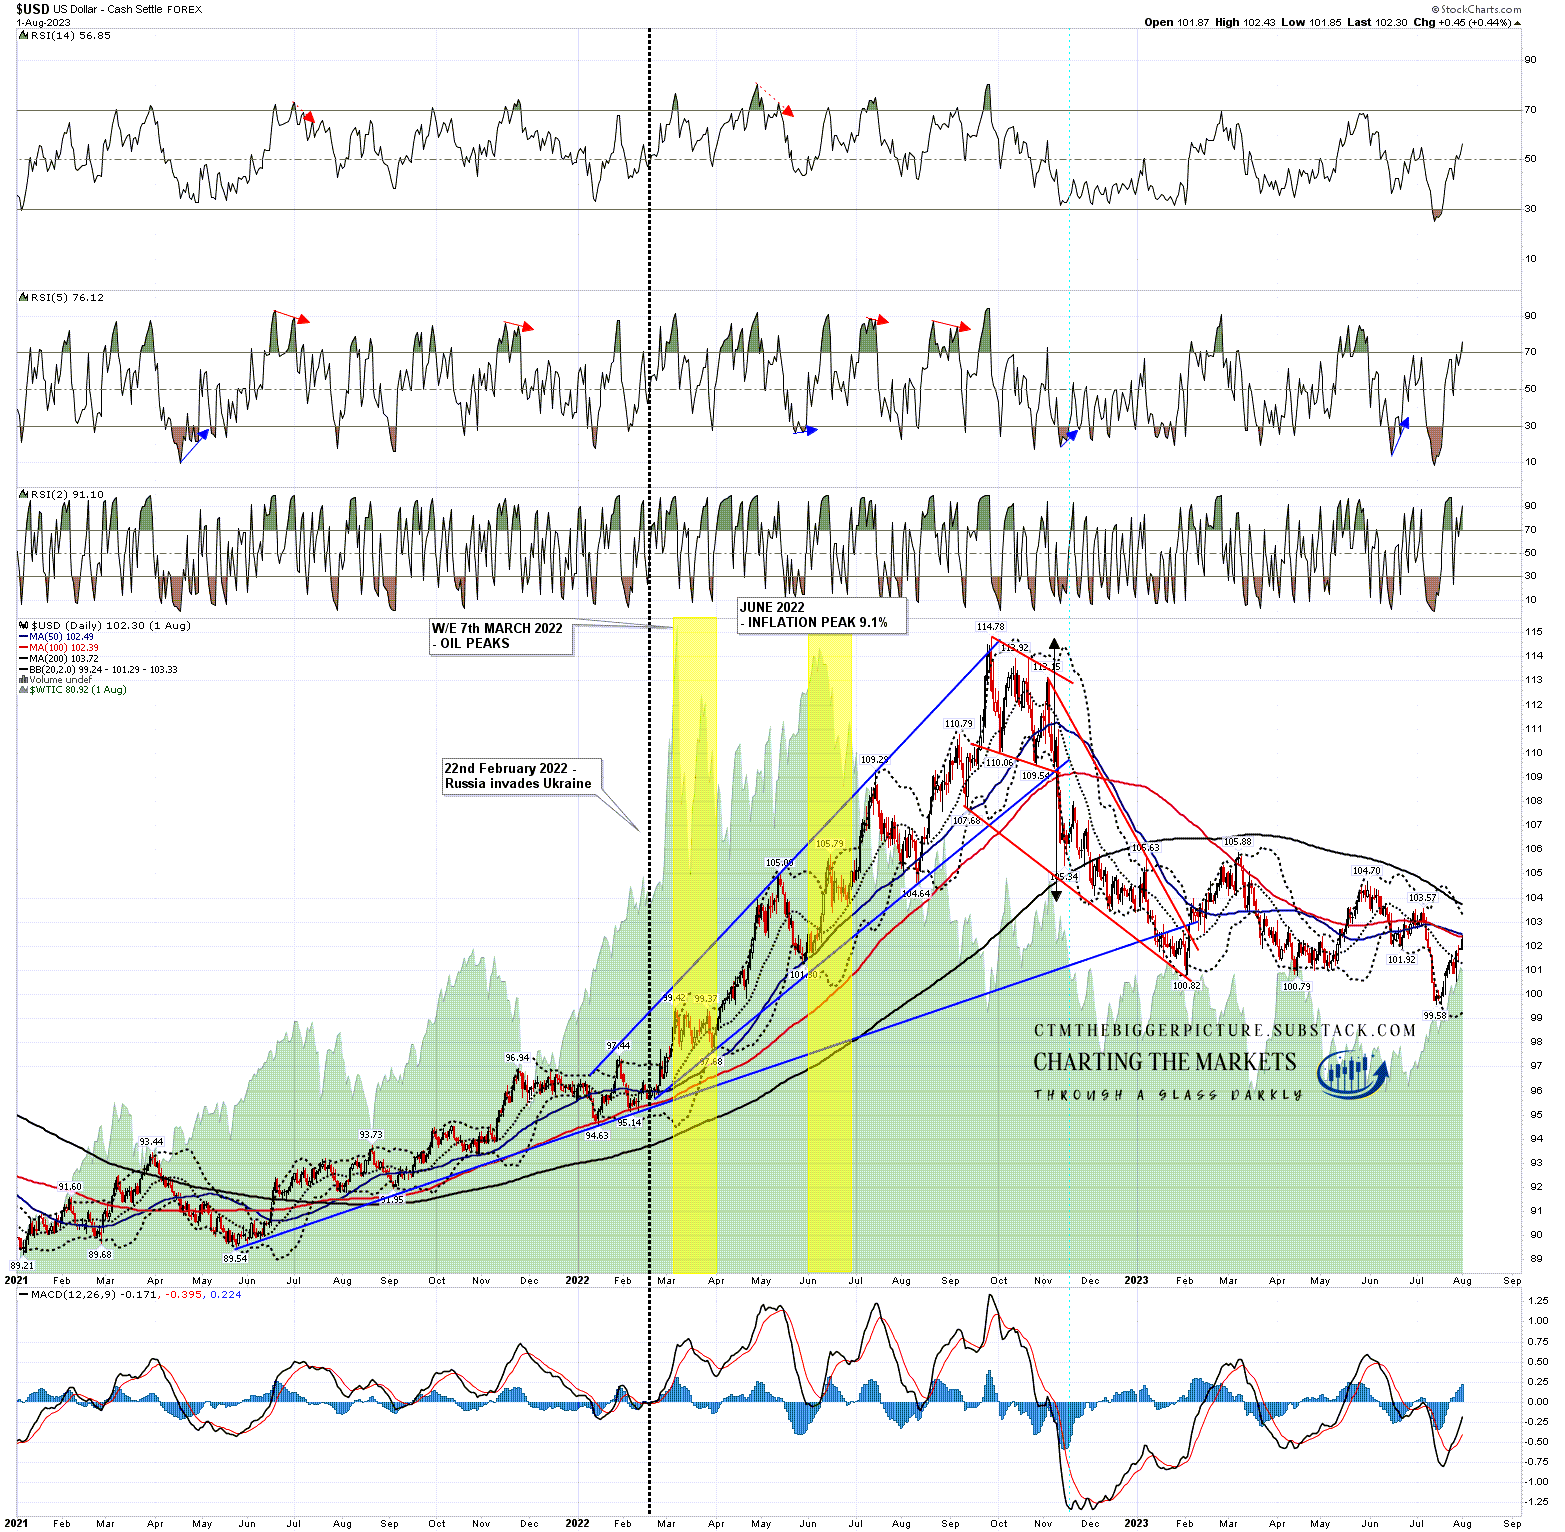
I’m thinking the whole bullish setup may play out over the next few months into a retest of that 2022 high at 114.78, and to show you why, I’m going to start with a close look at USD in 2022 after Russia invaded Ukraine on 22nd February.
If you look at the chart below you can see that there was a very strong reaction on oil prices after Russia invades (green background on the chart) which was at about $90 on $WTIC before the invasion and peaked at $126.42 on 7th March. This was a very modest oil supply shock however compared to the current one.
Given that oil was already at $90 before the invasion the impact on inflation was modest and prices had returned to the $90 area by July. Post-COVID inflation was already hitting 7.9% in February 2022 and peaked at 9.1% in June.
What was interesting though was what happened on USD, which was at about 95.5 at the time of the 2022 invasion, and then started a very strong move up into the 114.78 high in September. Given that USD was at 97.25 at the start of the Iran War, it would take a smaller move on USD now to retest that high.
USD daily chart (2021 through Jul 2023):
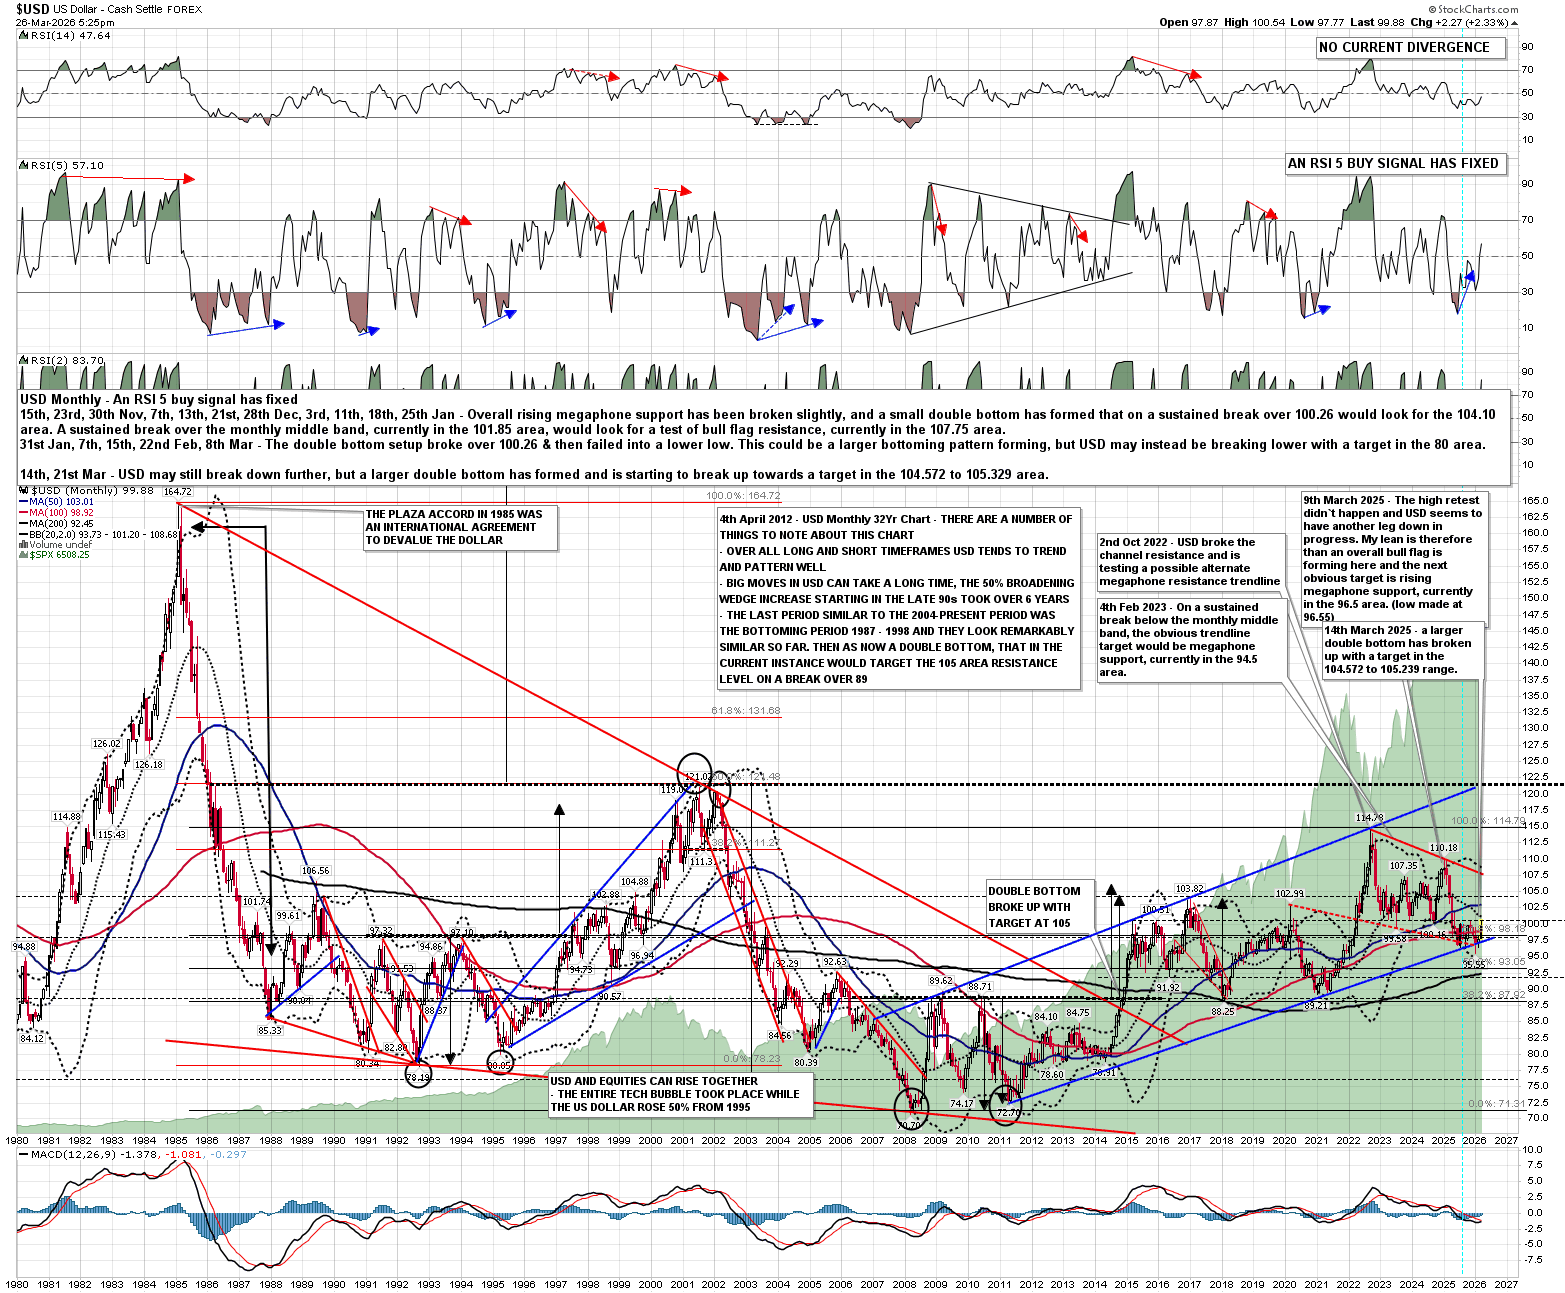
So let’s have a close look at this very bullish setup on USD now. Looking at my main USD monthly chart going back to 1980 you can see that the bear market from the 1984 high at 164.72 fell in a falling wedge into the 2008 low at 70.70. From there there has been a rally forming a high quality rising megaphone into the 2022 high at 114.78, slightly under the 50% retracement of that bear market which would have been at 117.71. This looks like a large bear flag setting up a retest of the low, over the next decade or two, in the 70.70 area.
I’ll look at the setup in more detail on the weekly chart but from the 2022 high a clear bull flag falling wedge has formed with the obvious next target in this sequence at a retest of the 2022 high, probably to make the second high of a double top.
This was the setup I was looking at last year and it is a strong setup, supported by matching bear flags on EURUSD and GBPUSD and a monthly RSI 5 buy signal on the USD chart. There have been twelve of these monthly buy and sell signals on the chart below since 1980, eleven made at least the minimum target at the 70 or 30 level respectively on the RSI 5, and the other made the possible near miss target in the 35 area. This really is a very strong setup on a very technical chart.
USD monthly chart:
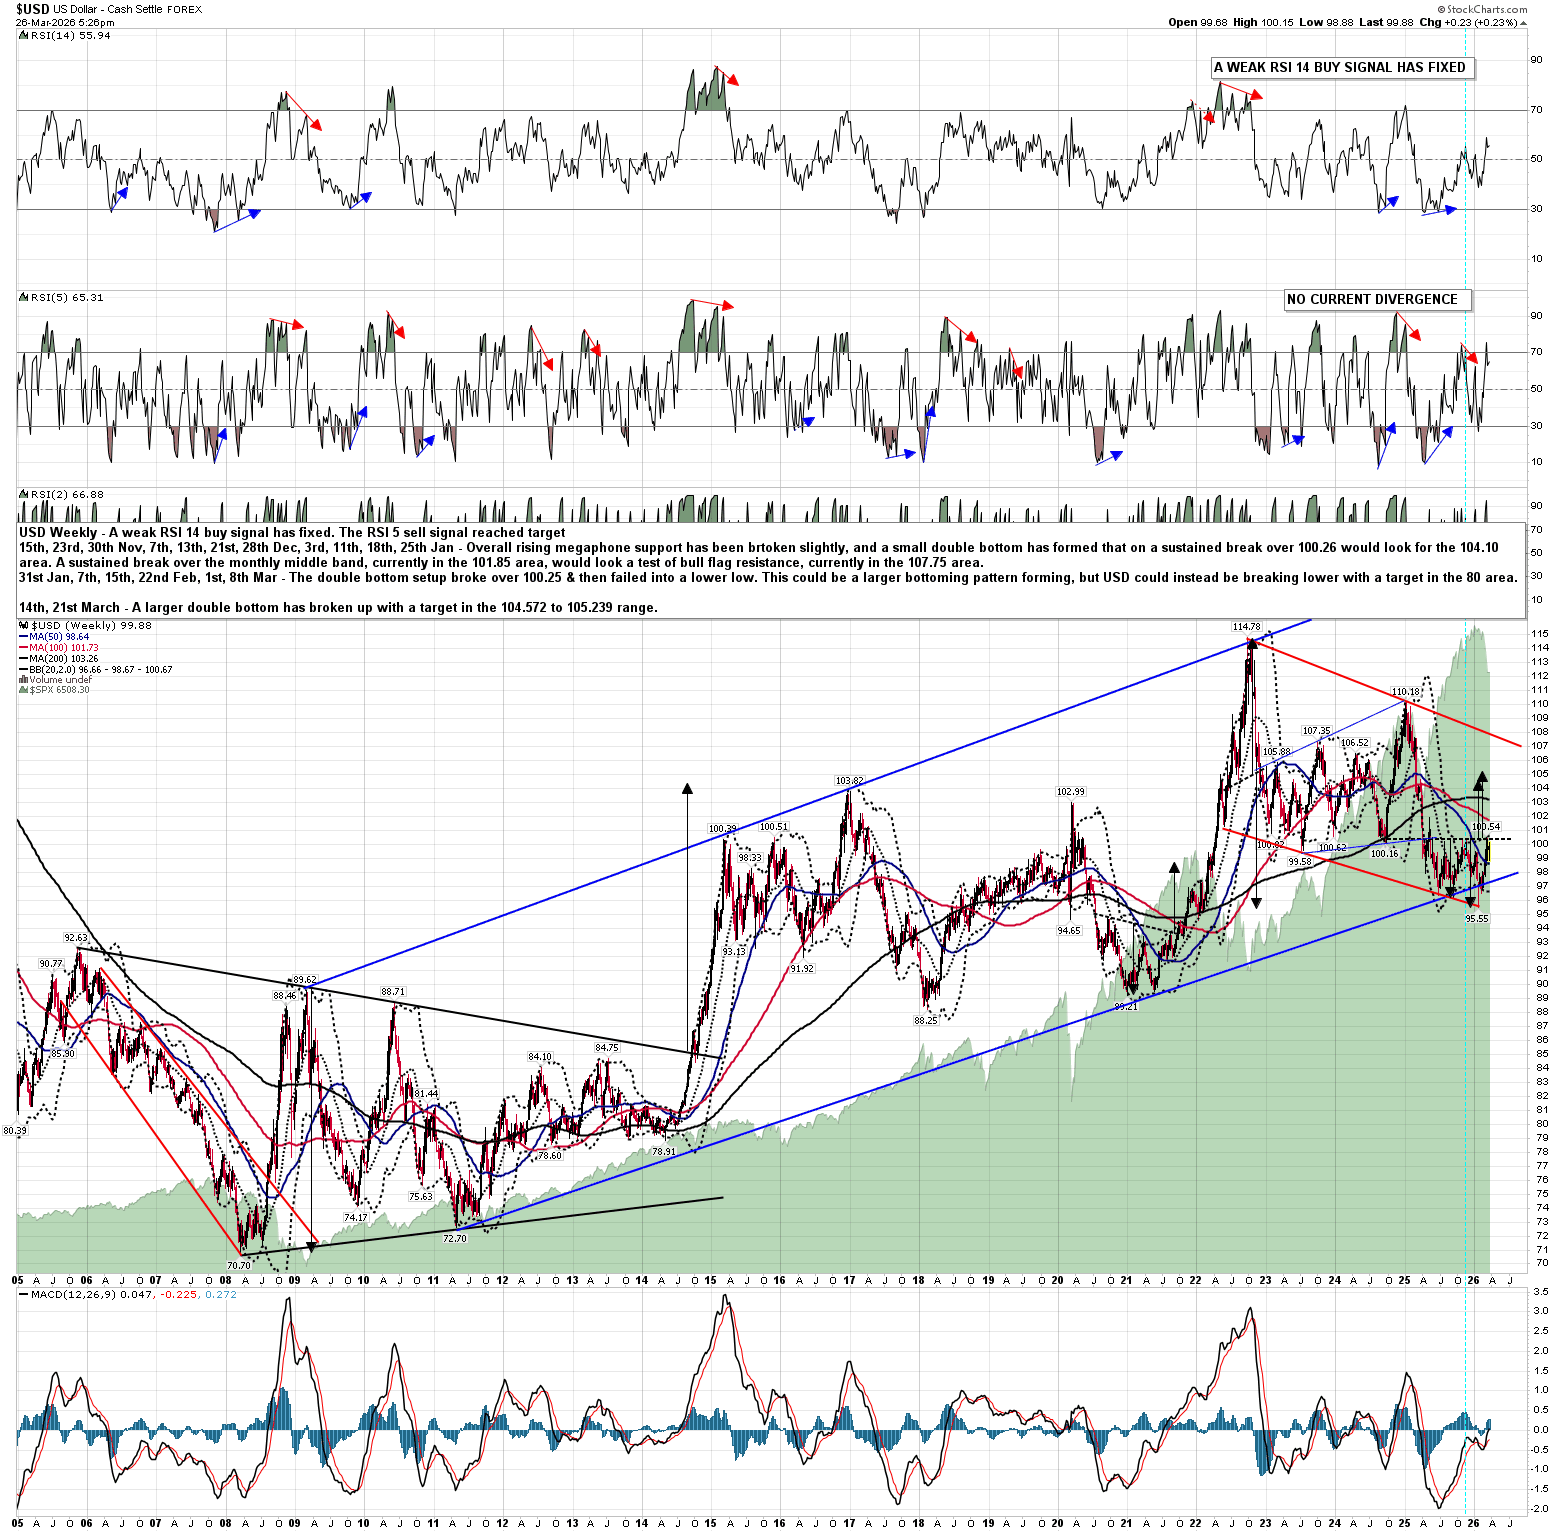
On the weekly chart you can see the high quality rising megaphone from the 2008 low, which broke down slightly last year and a bit more this year, so as ever when this happens I’m looking for a topping setup to form. There is no obvious H&S neckline apart from on at 88.25, which is really too low to form a decent pattern, so the obvious pattern to form here would be a double top.
From the 2022 high a high quality bull flag setup has formed and with the small double bottom that has formed with the lows in the last few months the obvious next move is to break up towards the retest of the 2022 high.
USD weekly chart:
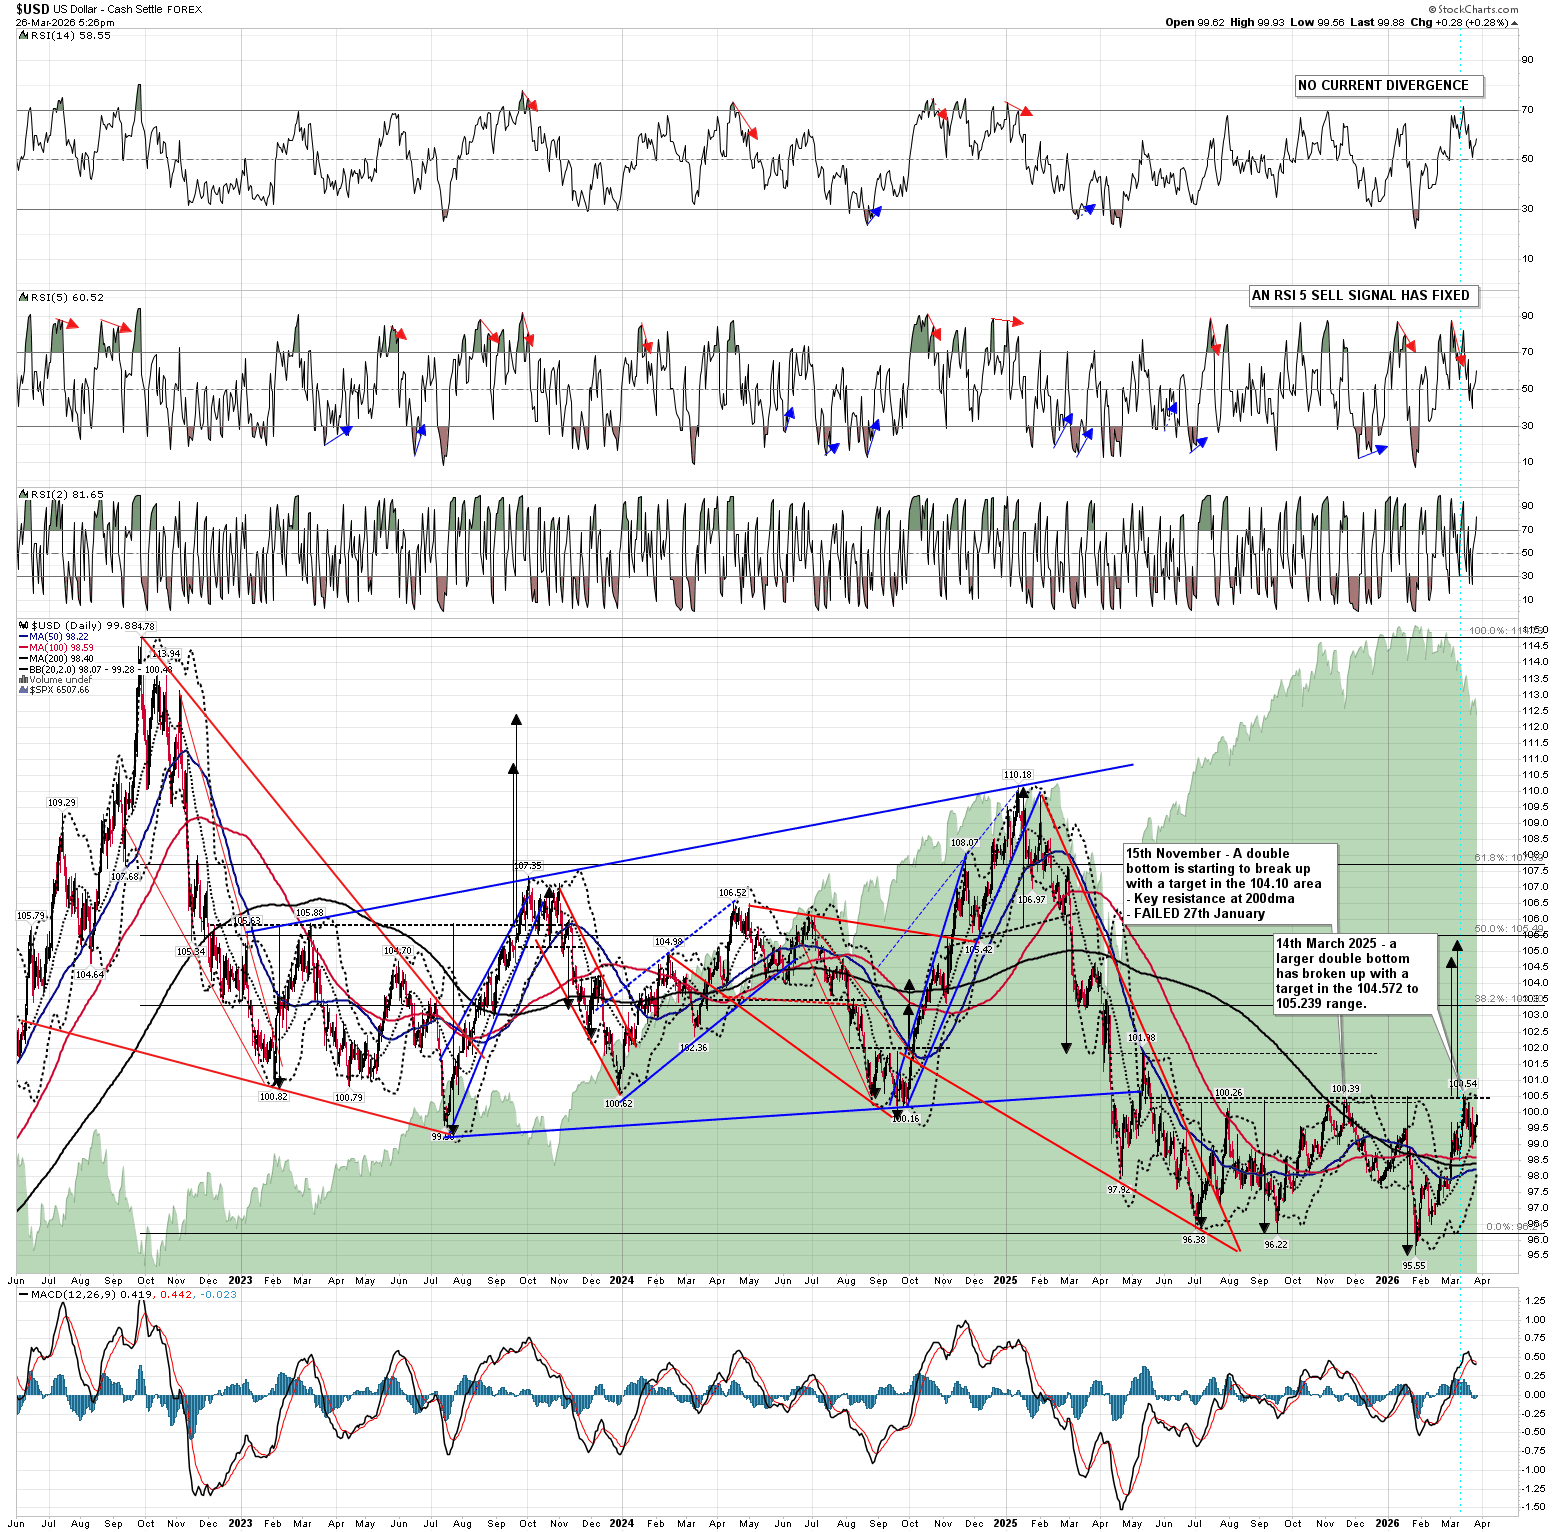
On the daily chart you can see the double bottom that broke up last year and failed back into a retest of the low in January, and the larger double bottom formed by that failure and low retest has now broken up with a target in the 104.572 to 105.239 range. Given the overall setup and the 2022 analog I am thinking this double bottom will likely reach target in coming weeks and should then continue into the obvious larger target at 114.78.
Since the last short term high at 100.54 USD has backtested the daily middle band and may be ready to go higher directly, but there is a short term fly in the ointment, with a daily RSI 5 sell signal that fixed at the recent highs. There have been ten of these sell signals since June 2022 with seven of those reaching the full target at 30 on the RSI 5 and the other three reaching the possible near miss target in the 35 area. This retracement has only reached the 40 level, so I am wondering if another modest leg down on USD may be needed for this to reach the possible near miss target, though some sideways churn could manage that instead.
USD daily chart:
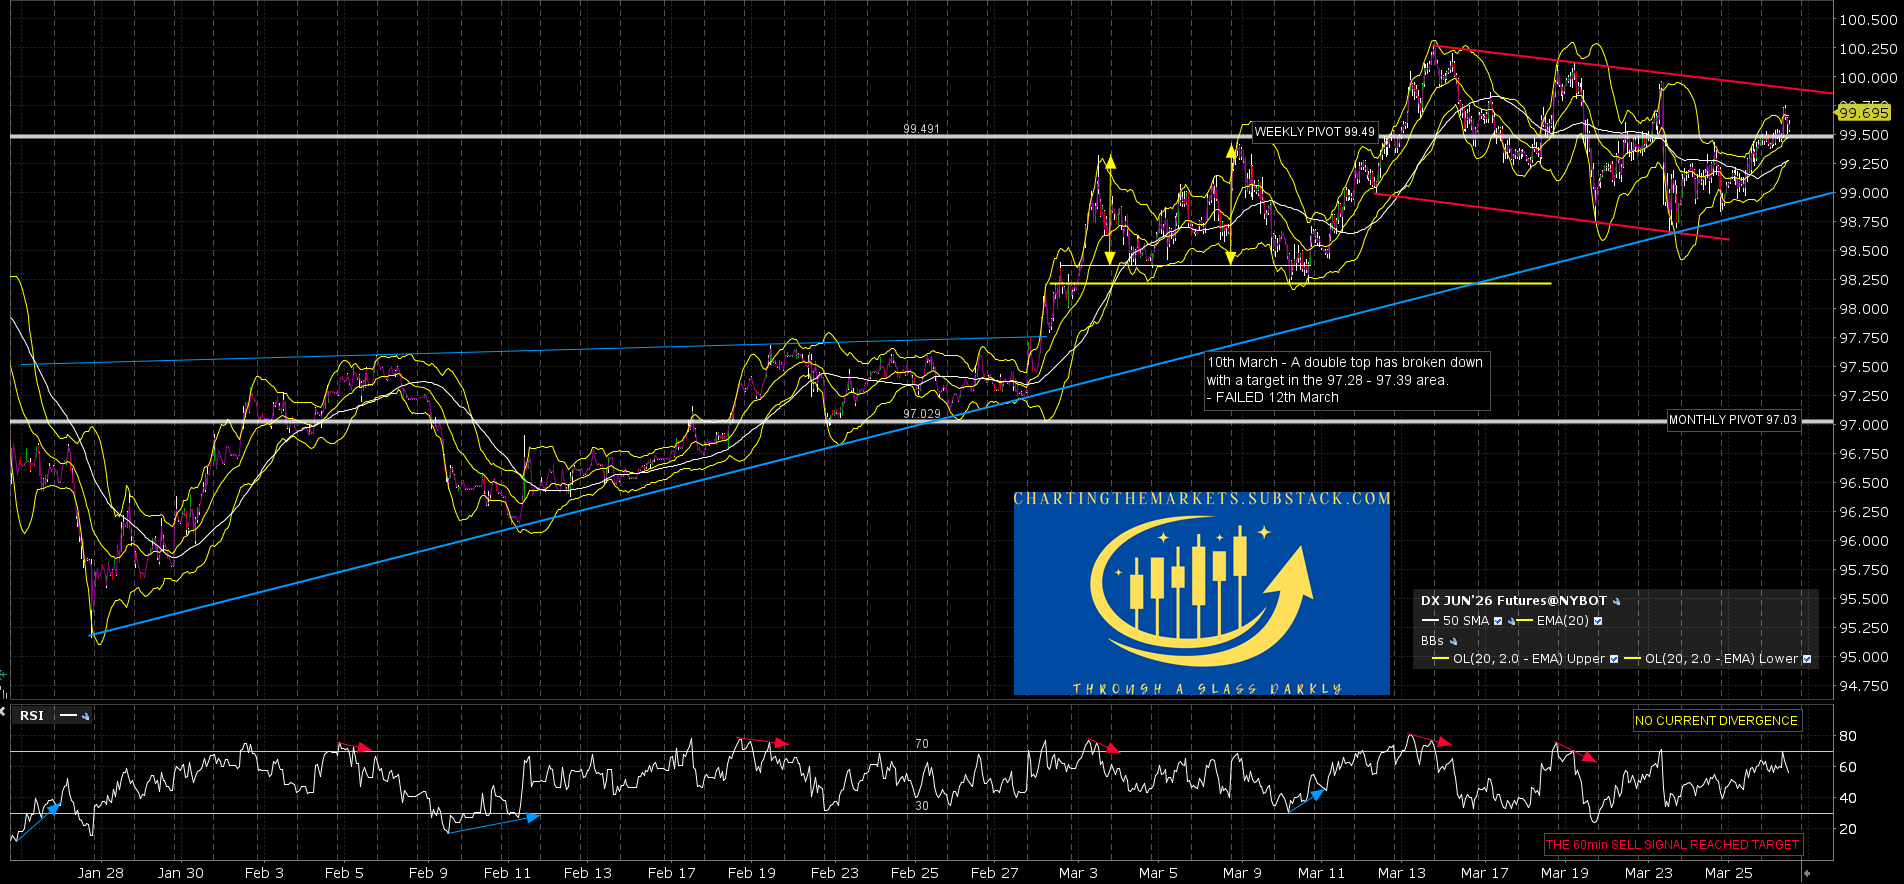
On the DX hourly chart there is a decent quality bull flag formed from the March high that could be ready to break up, but the fixed daily RSI 5 sell signal has me wondering whether this needs another leg down first.
DX Jun daily chart:
Overall this is a very strong setup and, unless peace unexpectedly breaks out in the next few days, likely has a good chance of playing out over the next few weeks.
I would note that if USD does make target it does not necessarily need to form the second high of a double top there, though I think that is likely. If it overshoots a bit then I’d be watching the 50% retracement level at 117.71 for resistance.
The next post in this series will be looking at the bullish setups on Corn, Wheat and Cotton. Everyone have a great weekend. :-)
If you like my analysis and would like to see more, please take a free subscription at my thebiggerpicture substack, where I publish these posts first and for members (from next week) also bi-weekly videos looking at equity indices, bonds, currencies and commodities. Those videos are posted on my Youtube channel after a seven day delay. Links to all my posts from my charting substacks are also always posted on my twitter.
No comments:
Post a Comment