
In my last post on Wednesday last week I was looking at how far the current rally on equities might get, and at the prospects that peace negotiations with Iran might deliver something positive.
I was skeptical about the prospects for a negotiated peace, and the talks in Islamabad on Saturday were abandoned after a day, as there was never really anything to talk about. The ten points that the US had accepted as a basis for negotiation were maximalist demands from Iran that would in effect have been a humiliating surrender by the US, and the alternative proposals from the US team on Saturday were maximalist demands that asked in effect for a humiliating surrender by Iran. The talks never had any realistic chance of success or even progress on this basis.
The key issue for the world economy of course remains the closure of the Strait of Hormuz, and in that respect the situation has now deteriorated. Before the ceasefire only a small number of ships approved by Iran were going through the Strait, and now the US has announced that it will entirely blockade all Iranian ports until Iran allows free passage for all through the Strait of Hormuz. The net effect is that all commercial transit through the Strait of Hormuz has now been stopped by both Iran and the US until further notice.
This raises some questions of course, about whether the US would really attack or confiscate vessels from China, India, Pakistan that were leaving Iranian ports. To do so would of course legally be an act of war against those countries.
In the event that hostilities escalate further then the next obvious move for Iran would be to use their Houthi allies to close the Bab al-Mandab Strait out of the Red Sea:
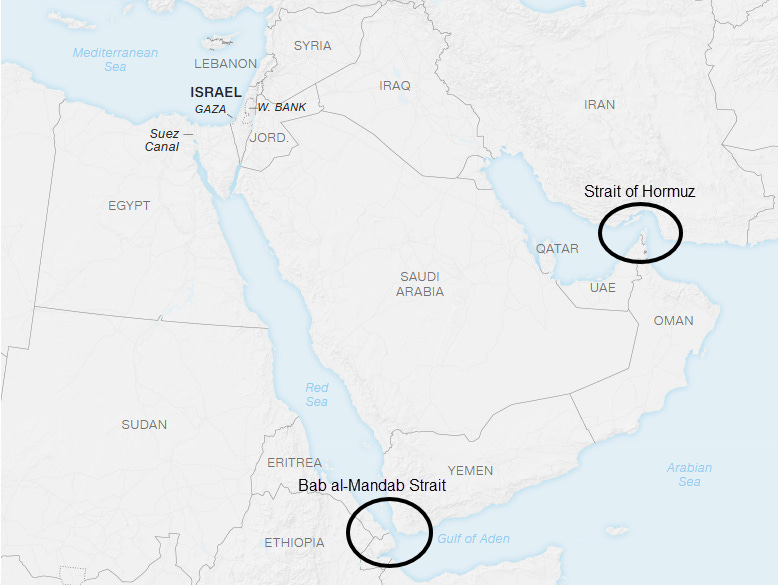
The Bab al-Mandab Strait isn’t as heavily used as the Strait of Hormuz, mainly because the Houthis have been intermittently firing at shipping there for years, but it has been clear so far in this conflict and the Saudis have been using it as a partial replacement for Hormuz since this war started. If this is closed then millions of barrels a day of oil from Saudi that have managed to keep flowing so far during this war will stop flowing.
You may be wondering whether Saudi could instead send their oil through the Suez Canal and smaller tankers could go that way, but the maximum (Suezmax) size of oil tanker that can go through the Strait is between 120,000 and 180,000 deadweight tonnage (DWT). Most crude oil is carried by Very Large Crude Carriers (VLCC) or Ultra Large Crude Carriers (ULCC), which range from 200,000 to 550,000 DWT, and so are too large to use the Suez Canal.
We already have a major supply shock from this war and there’s not much reason at the moment to think that the war isn’t about to escalate seriously and make that supply shock a lot worse. If that happens the outlook for oil and equity prices will be bleak.
On to the markets where I will review the progress of the bottoming patterns that I was looking at last week on the 15min charts, and the negative divergence that was building over the last two days of last week on the hourly charts.
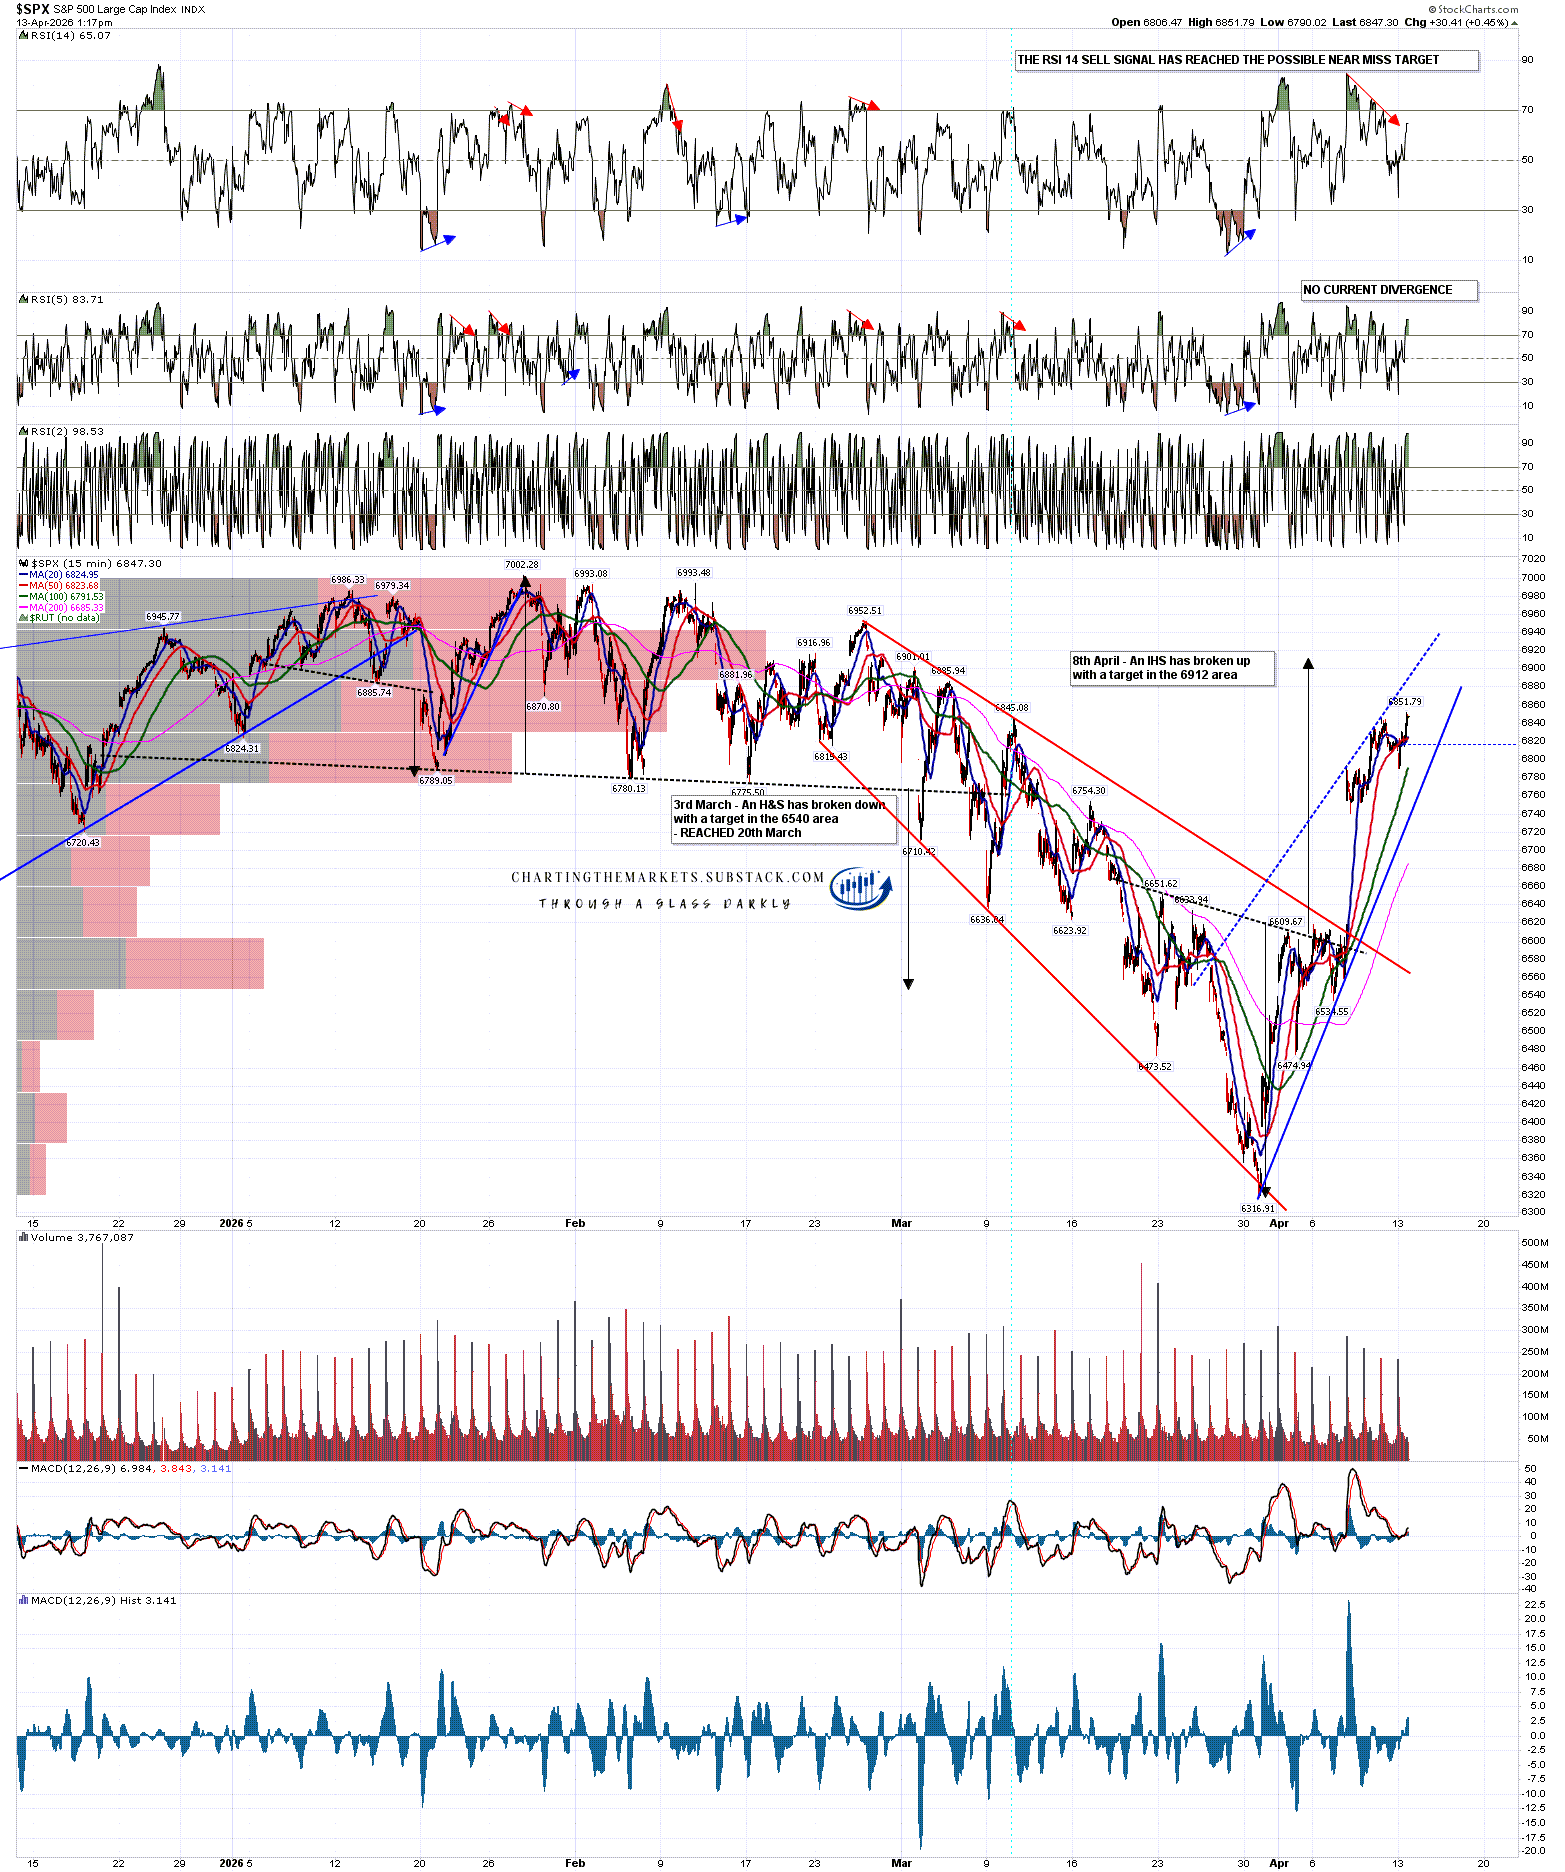
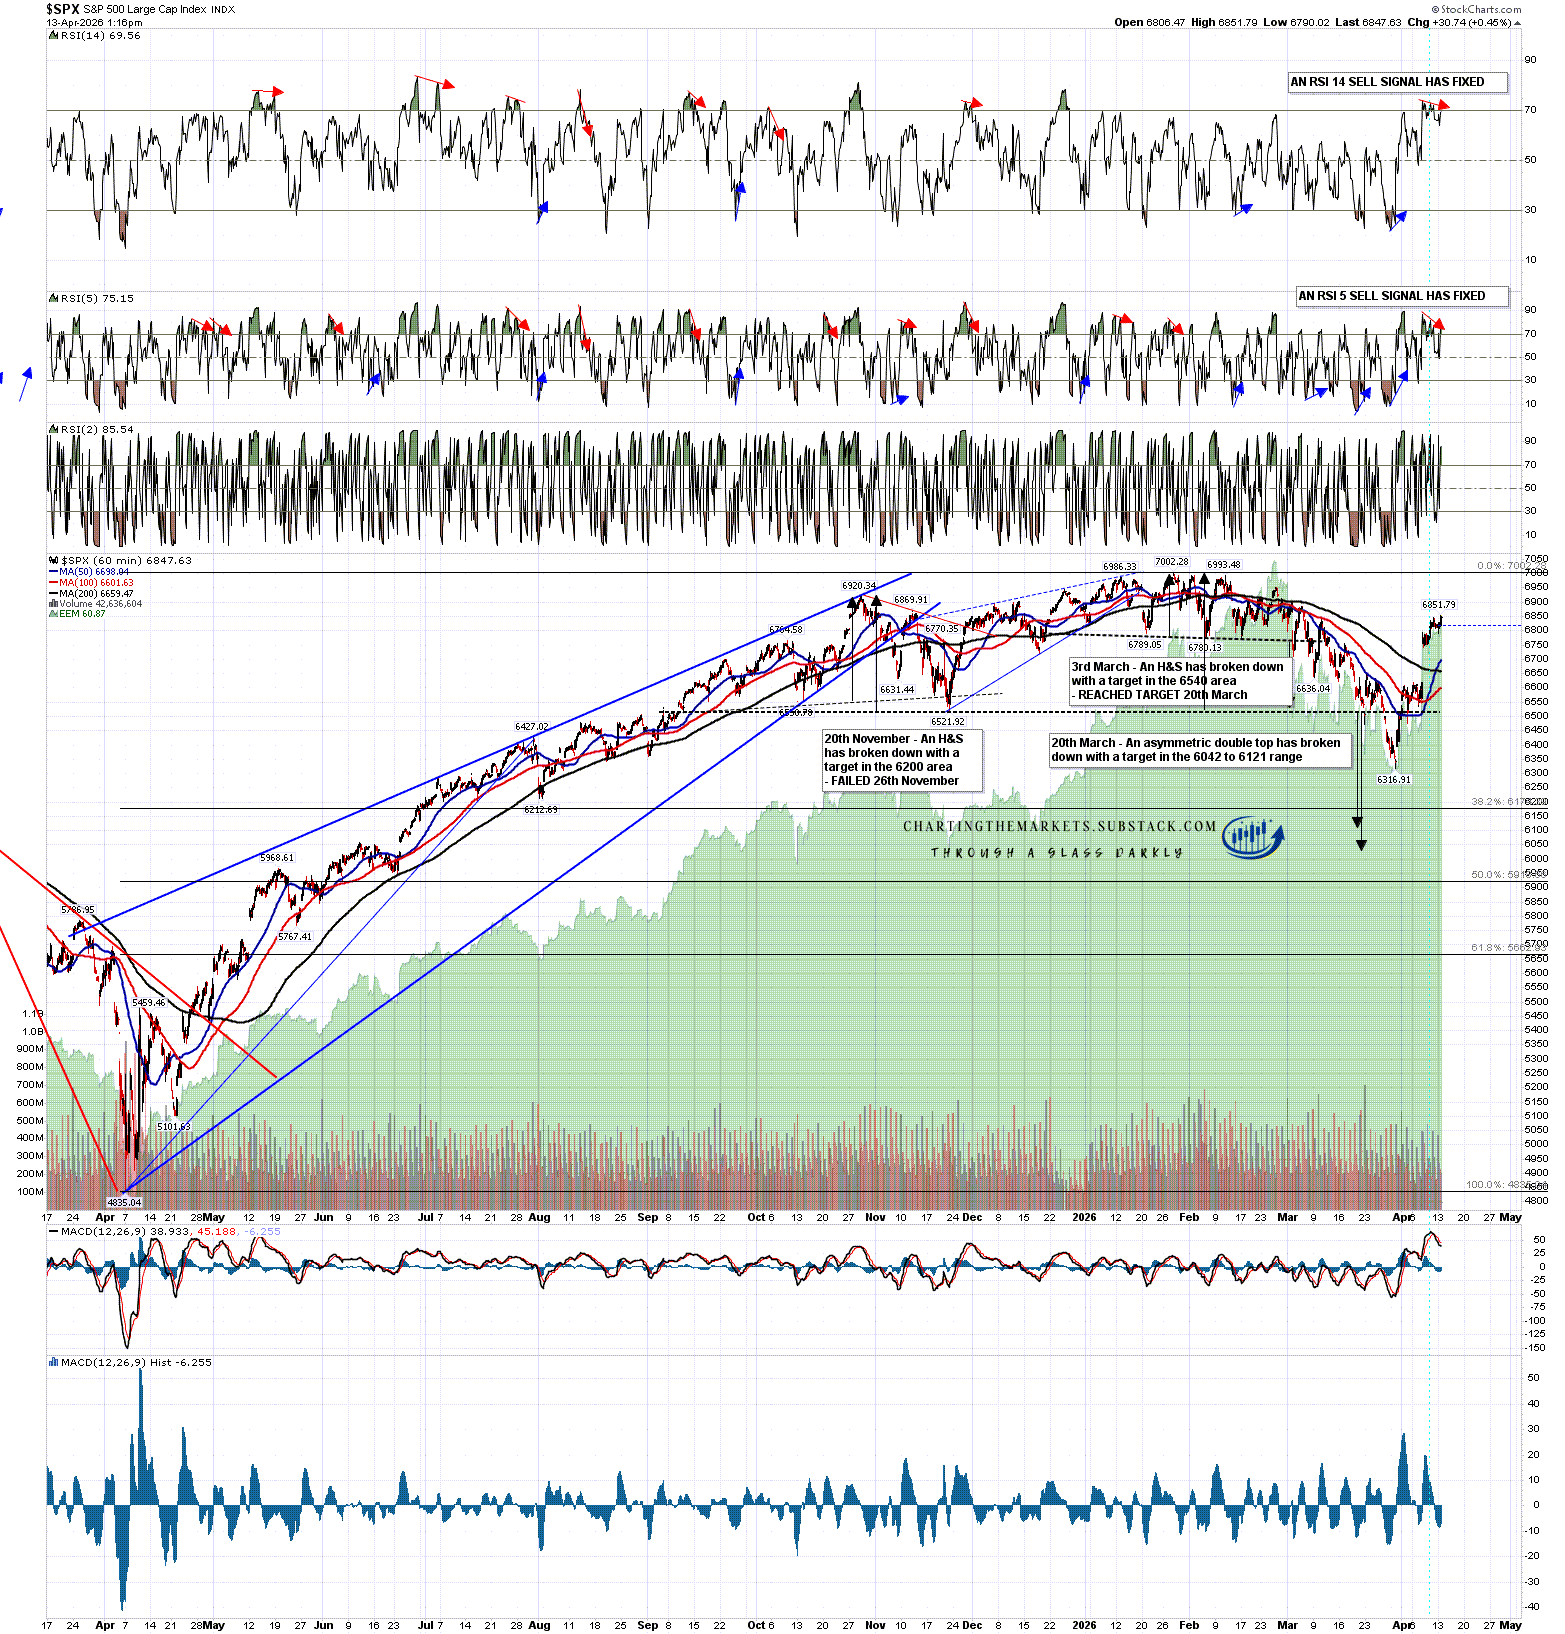
On SPX an IHS had broken up with a target in the 6912 area, and hasn’t progressed much to the upside since I was looking at this on Wednesday. A decent quality rising wedge has formed from the low suggesting a short term high may be close.
SPX 15min chart:
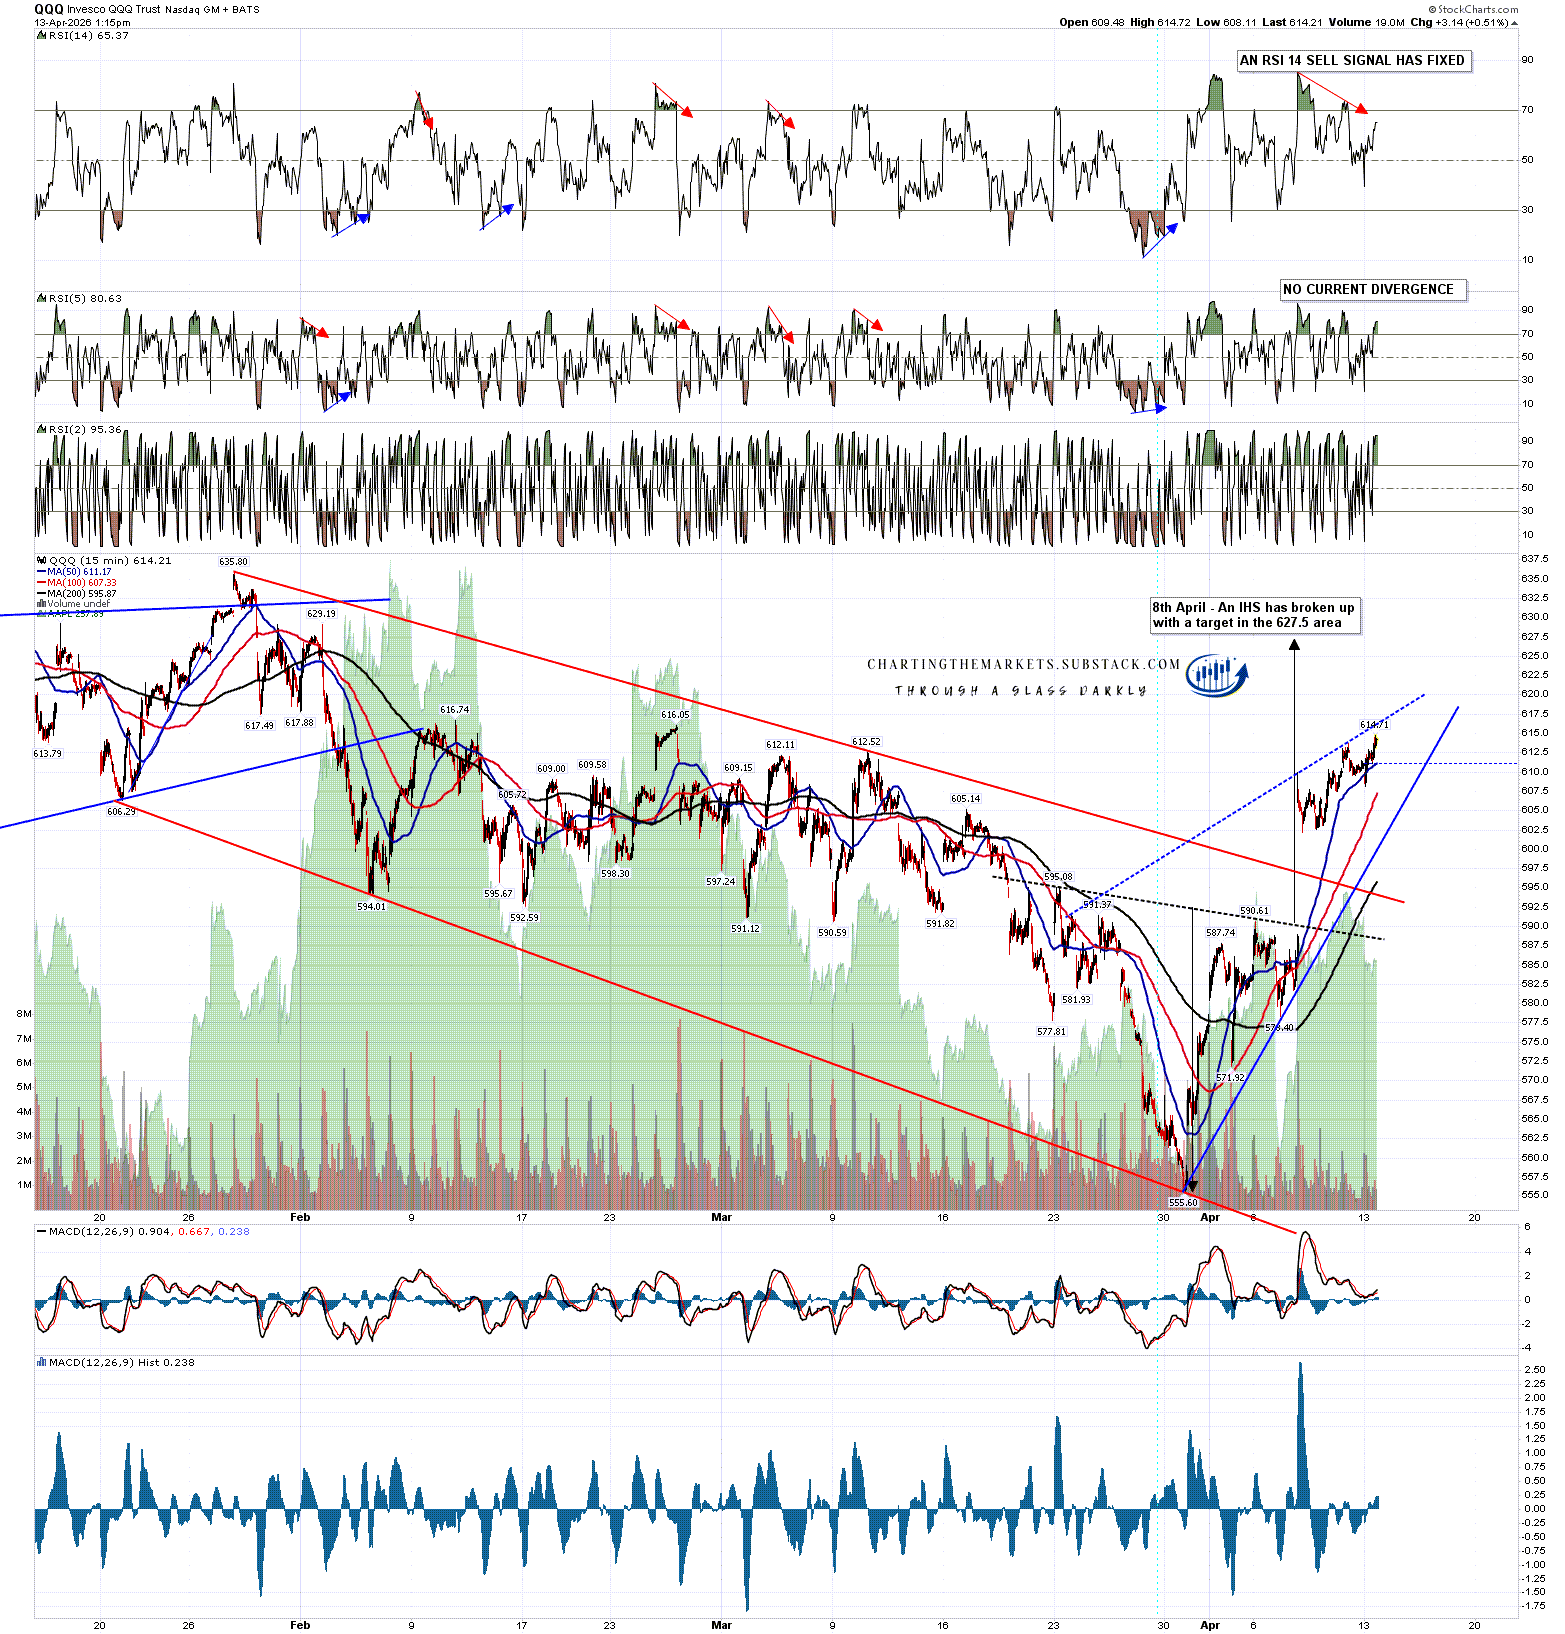
On QQQ an IHS had broken up with a target in the 627.5 area, and hasn’t progressed much to the upside since I was looking at this on Wednesday. A decent quality rising wedge has formed from the low suggesting a short term high may be close.
QQQ 15min chart:
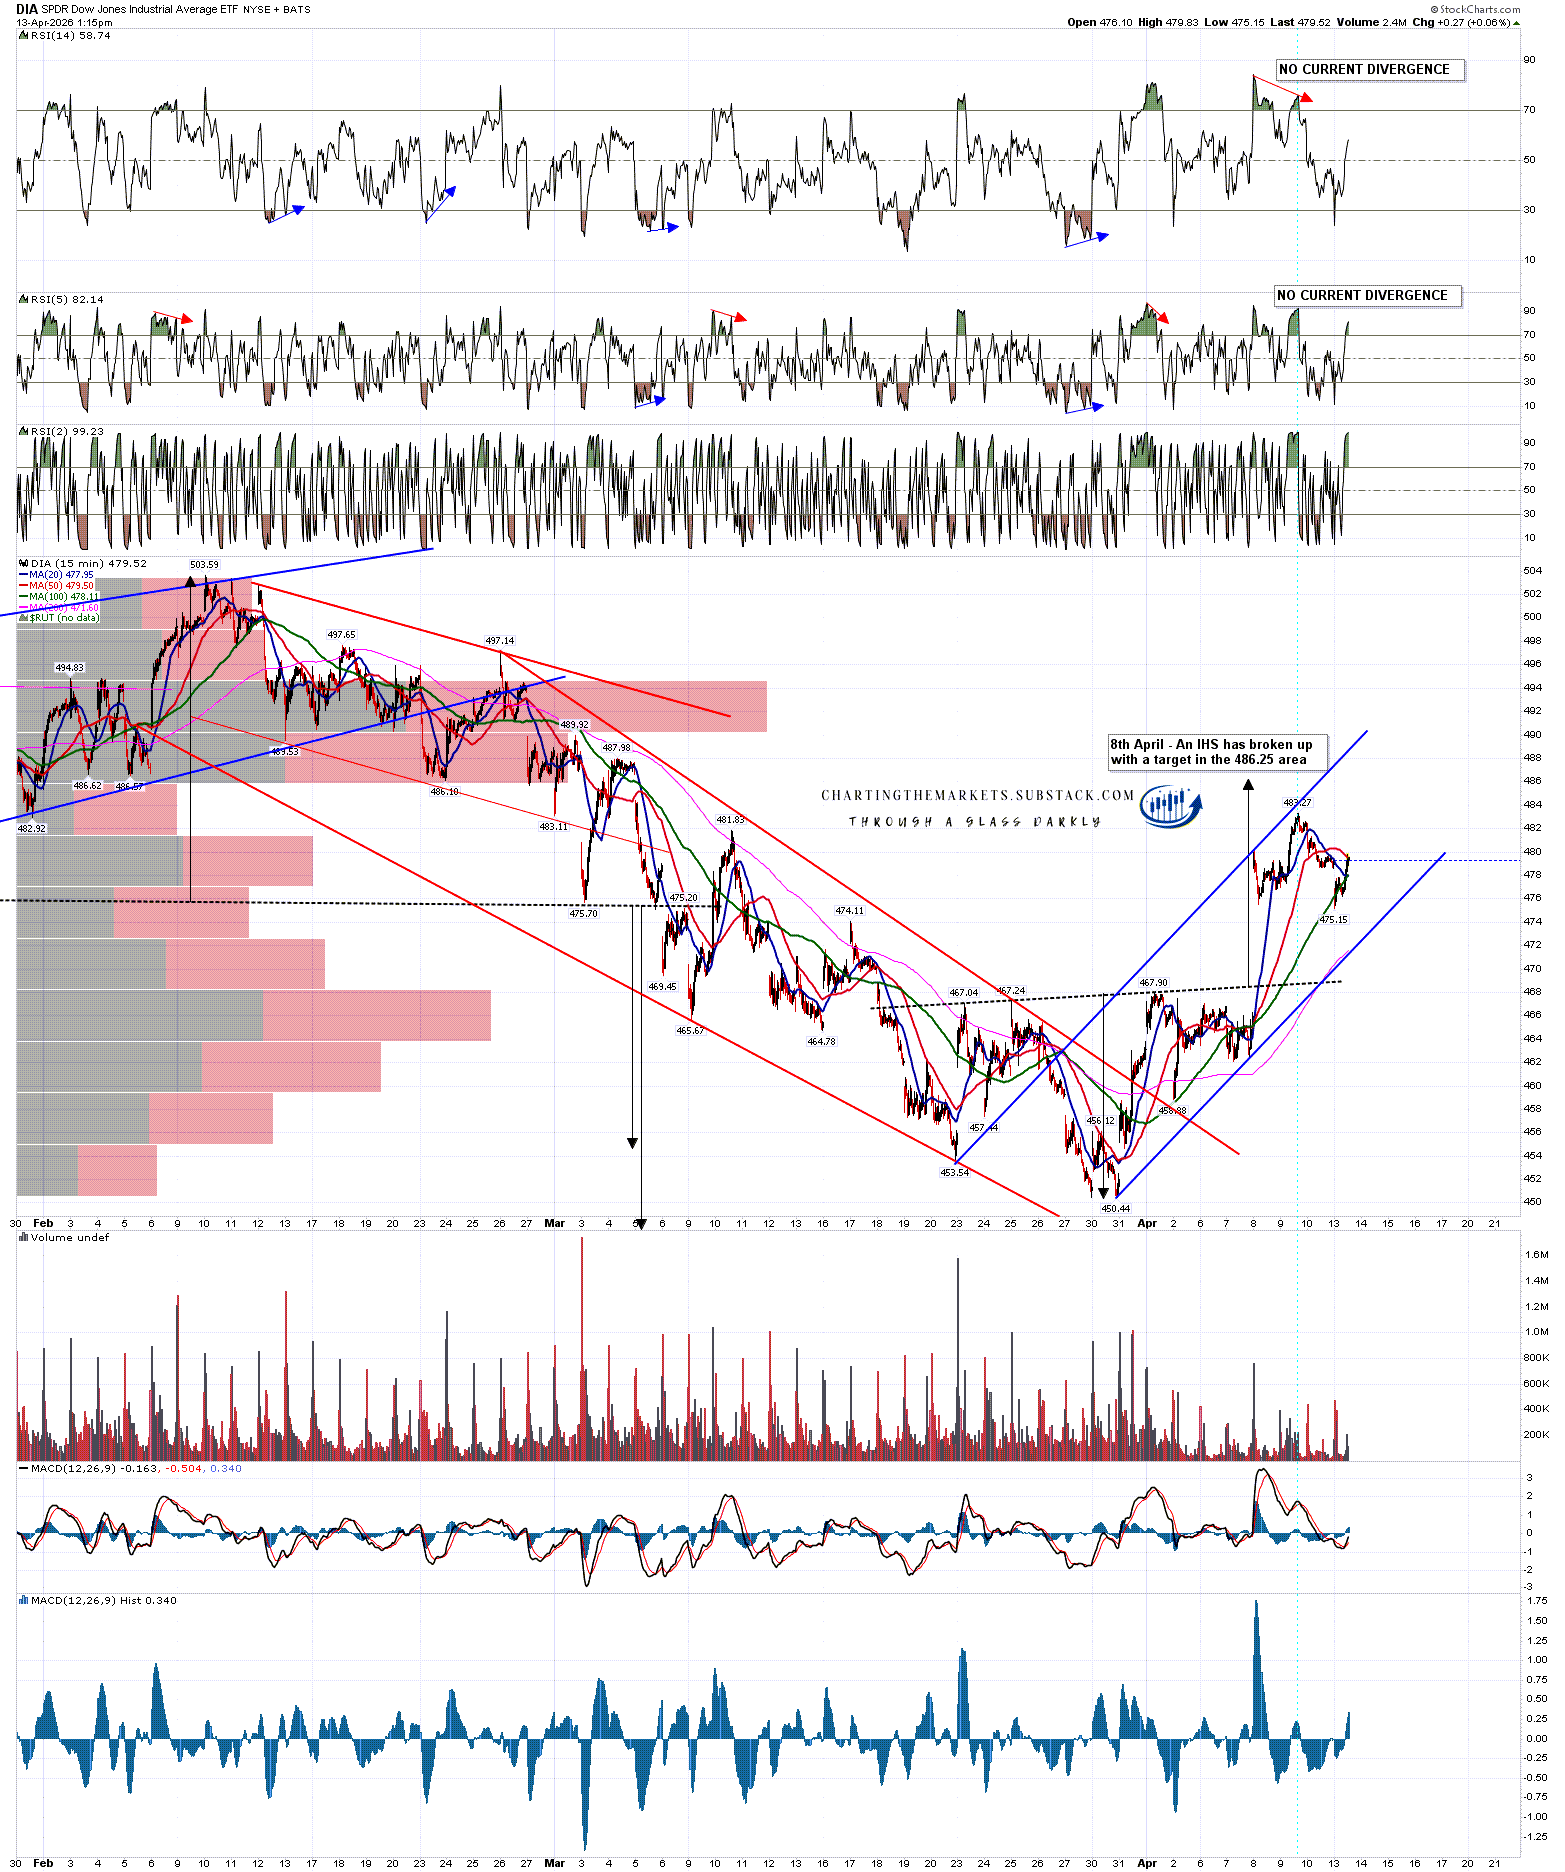
On DIA an IHS had broken up with a target in the 486.25 area, and hasn’t progressed much to the upside since I was looking at this on Wednesday. A high quality rising channel has formed from the low suggesting a short term high may be close.
DIA 15min chart:
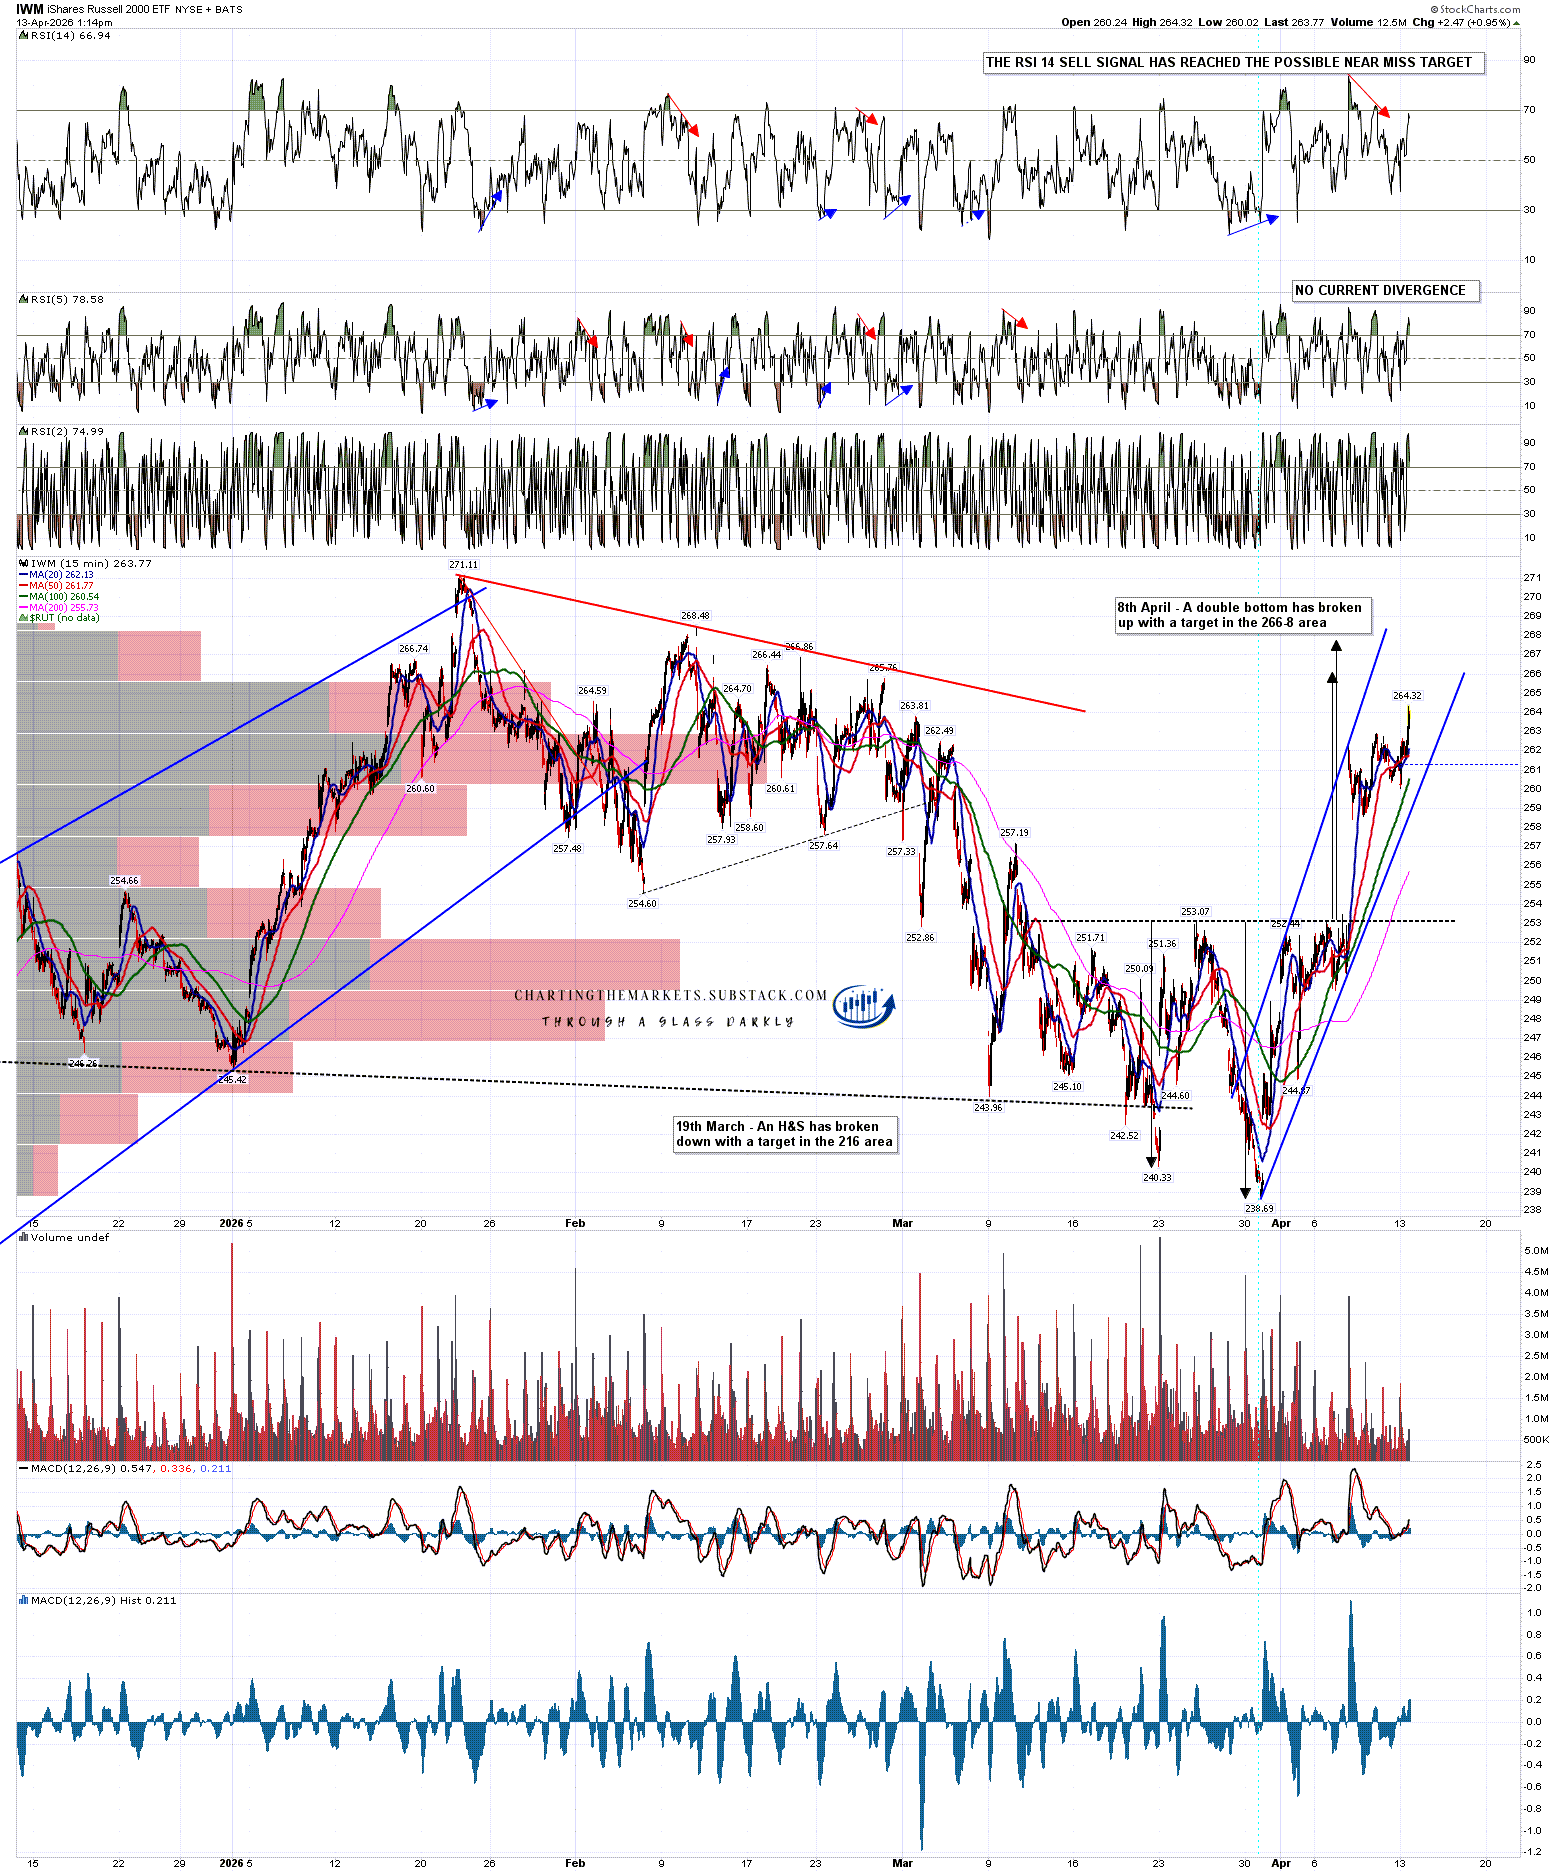
On IWM a double bottom had broken up with a target in the 266-8 area, and hasn’t progressed much to the upside since I was looking at this on Wednesday. A decent quality rising megaphone has formed from the low suggesting a short term high may be close.
IWM 15min chart:
All of these targets are fairly close and with these indices all currently at or close to rally highs day they may all still be hit.
There is a lot of negative divergence on the hourly charts here though, and on the SPX hourly chart below you can see that both RSI 14 and RSI 5 sell signals fixed on Friday.
SPX 60min chart:
I was warning subscribers from Thursday night that hourly sell signals were brewing across the board and other than SPX there are also:
QQQ - Hourly RSI 14 sell signal brewing, RSI 5 sell signal fixed.
DIA - Hourly RSI 14 sell signal fixed, RSI 5 sell signal reached target.
IWM - Hourly RSI 14 and RSI 5 sell signals fixed.
I’m expecting a short term high soon and all these sell signals will likely reach their targets at the 30 area on their respective RSIs. In the absence of any actual good news on the Iran War, and I’m not currently seeing much reason to expect any, we’ll likely be seeing lower lows in the near future.
If you like my analysis and would like to see more, please take a free subscription at my chartingthemarkets substack, where I publish these posts first. I also do a premarket video every day on equity indices, bonds, currencies, energies, precious commodities and other commodities at 8.45am EST, but only for paying subscribers. Other places to find me are my page on the platform previously known as twitter, and my YouTube channel.
No comments:
Post a Comment