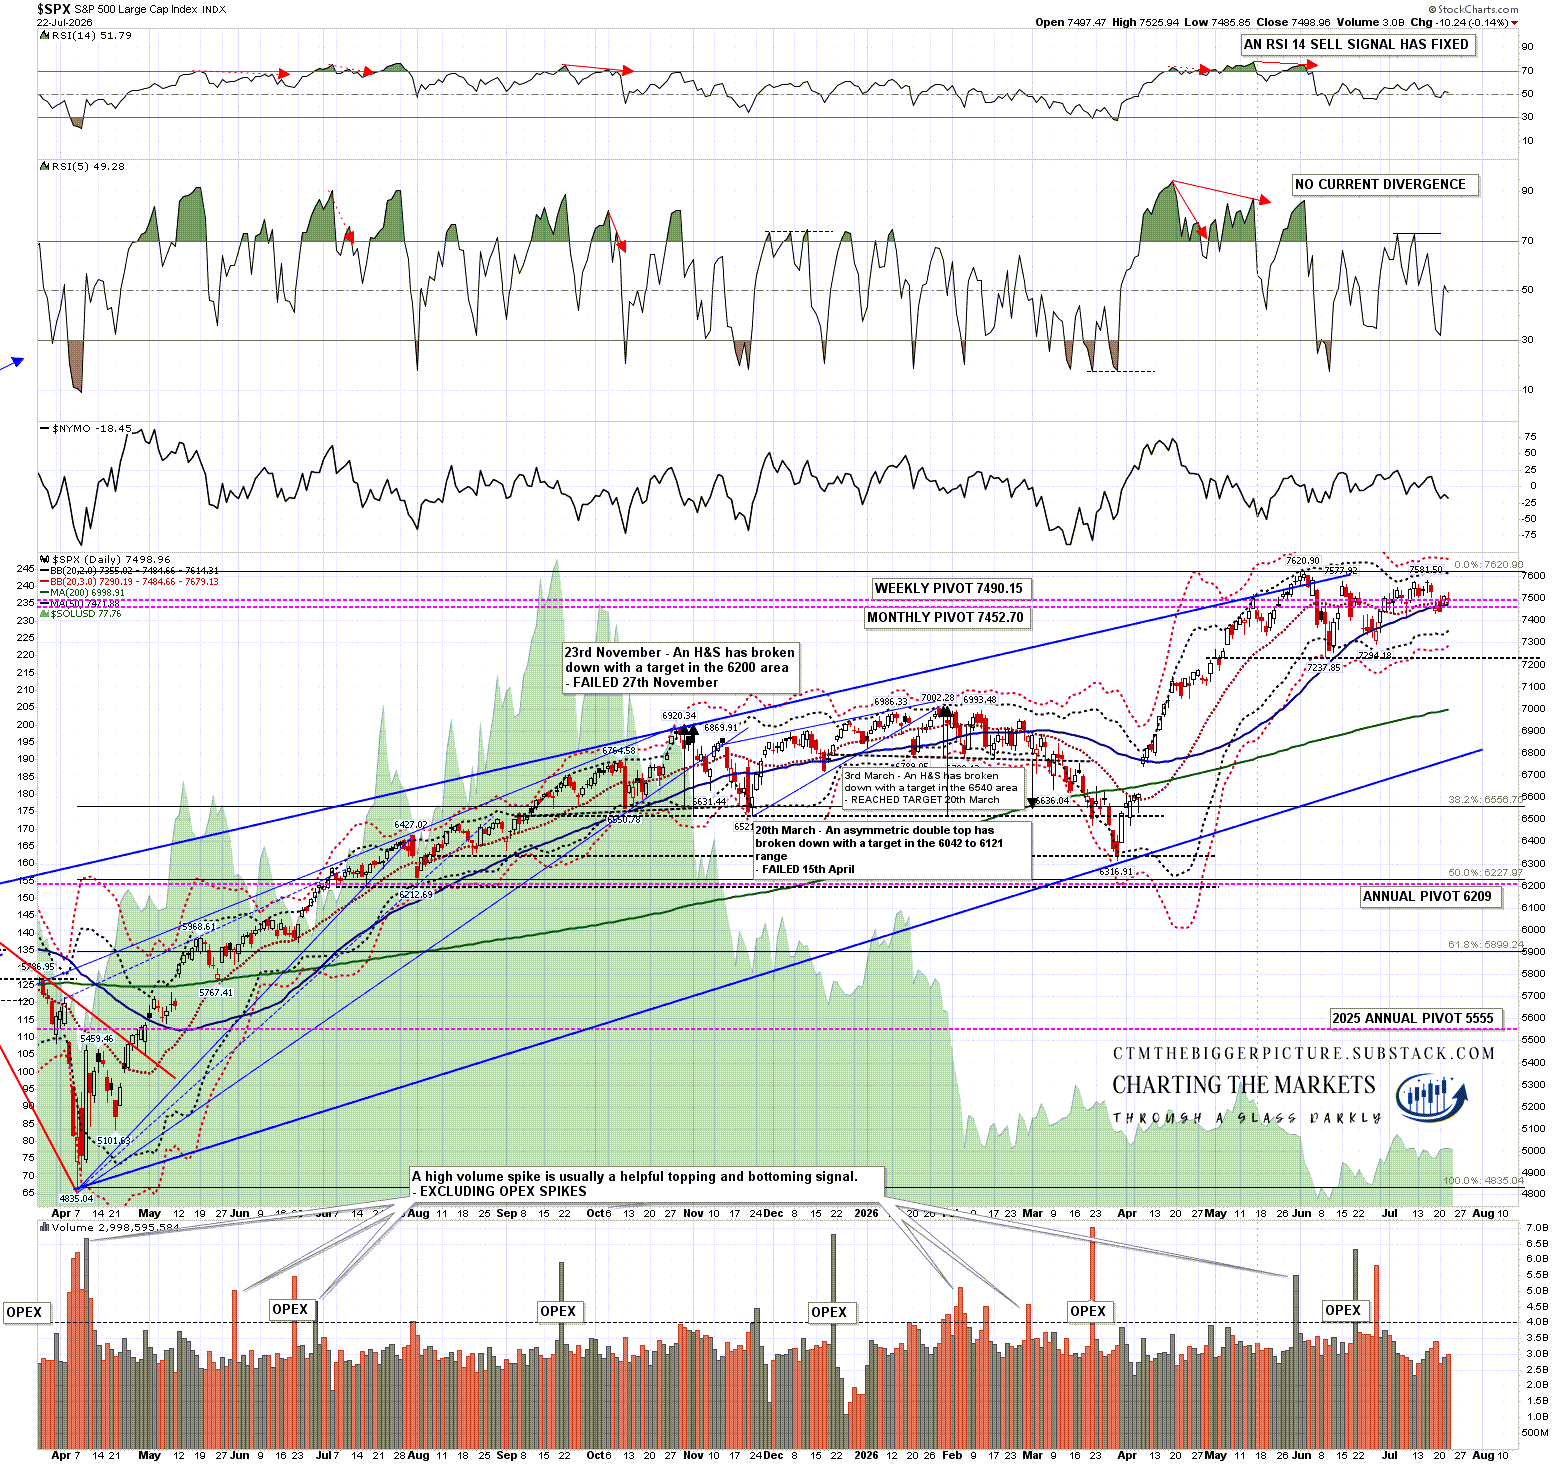
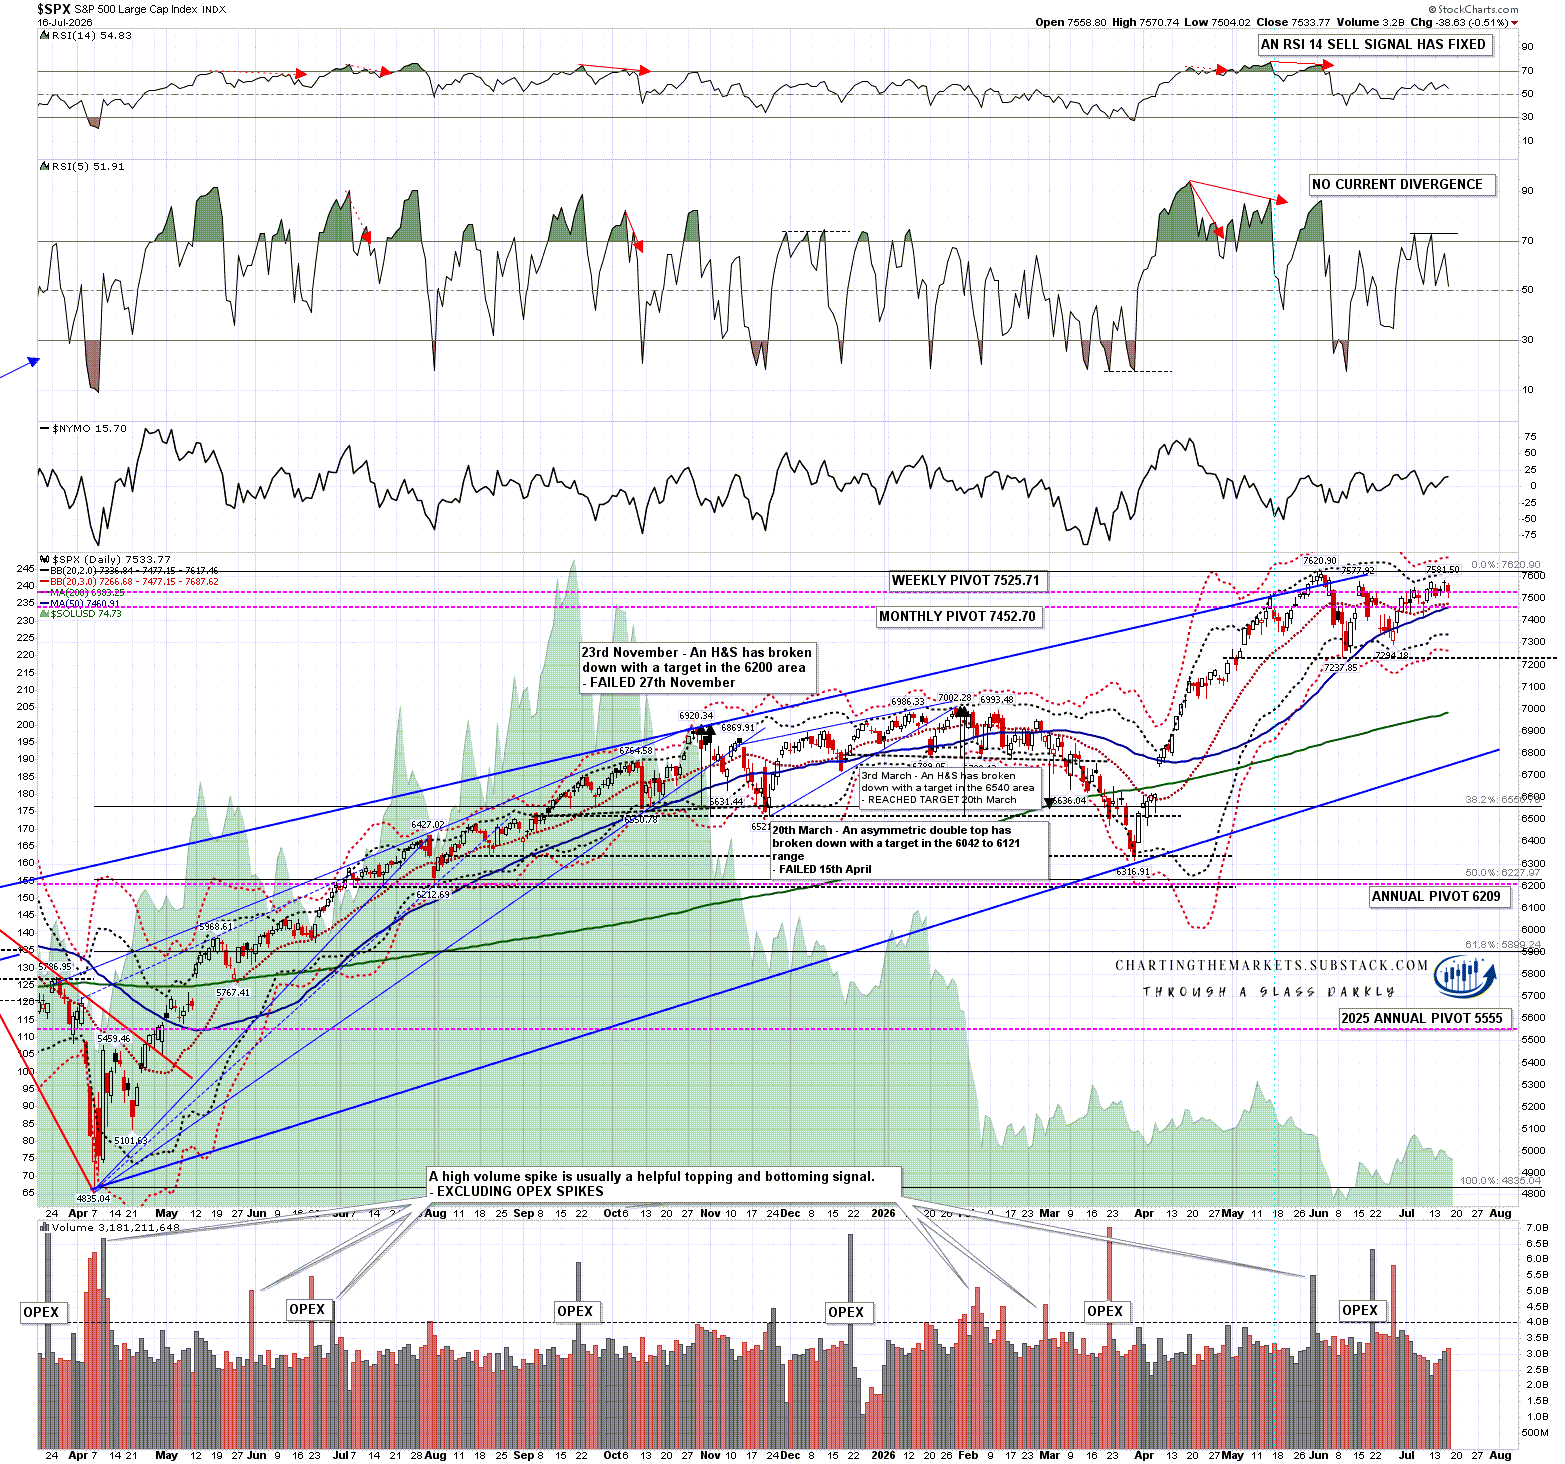
In my last post on Thursday I was looking at the solitary break back over the daily middle band on SPX and considering the possibility that SPX might go higher. SPX then broke back below the daily middle band again.
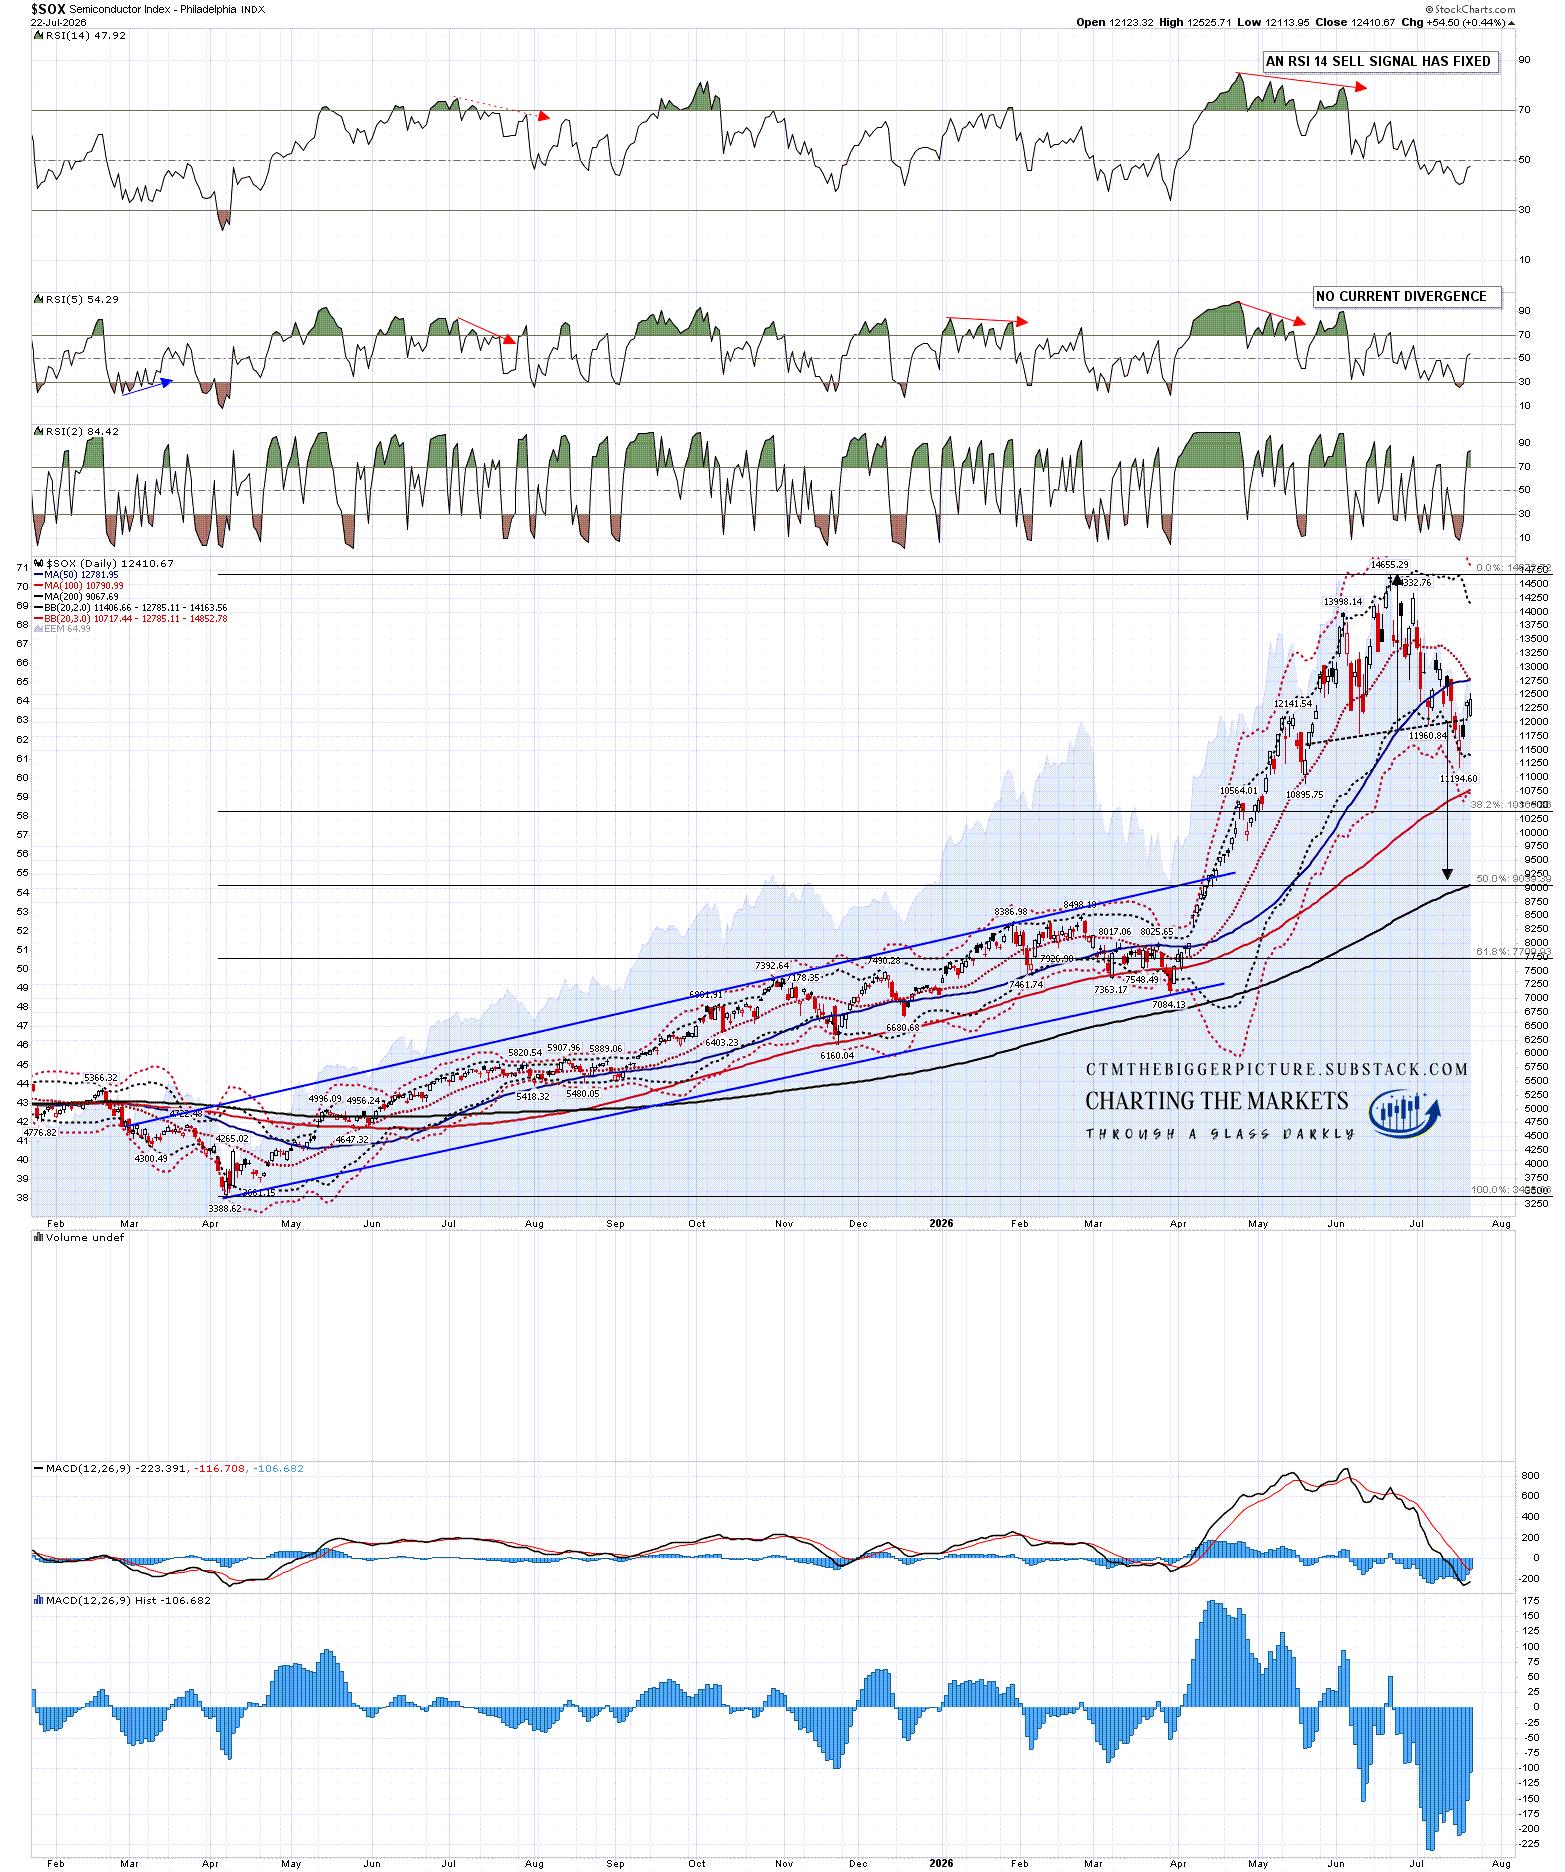
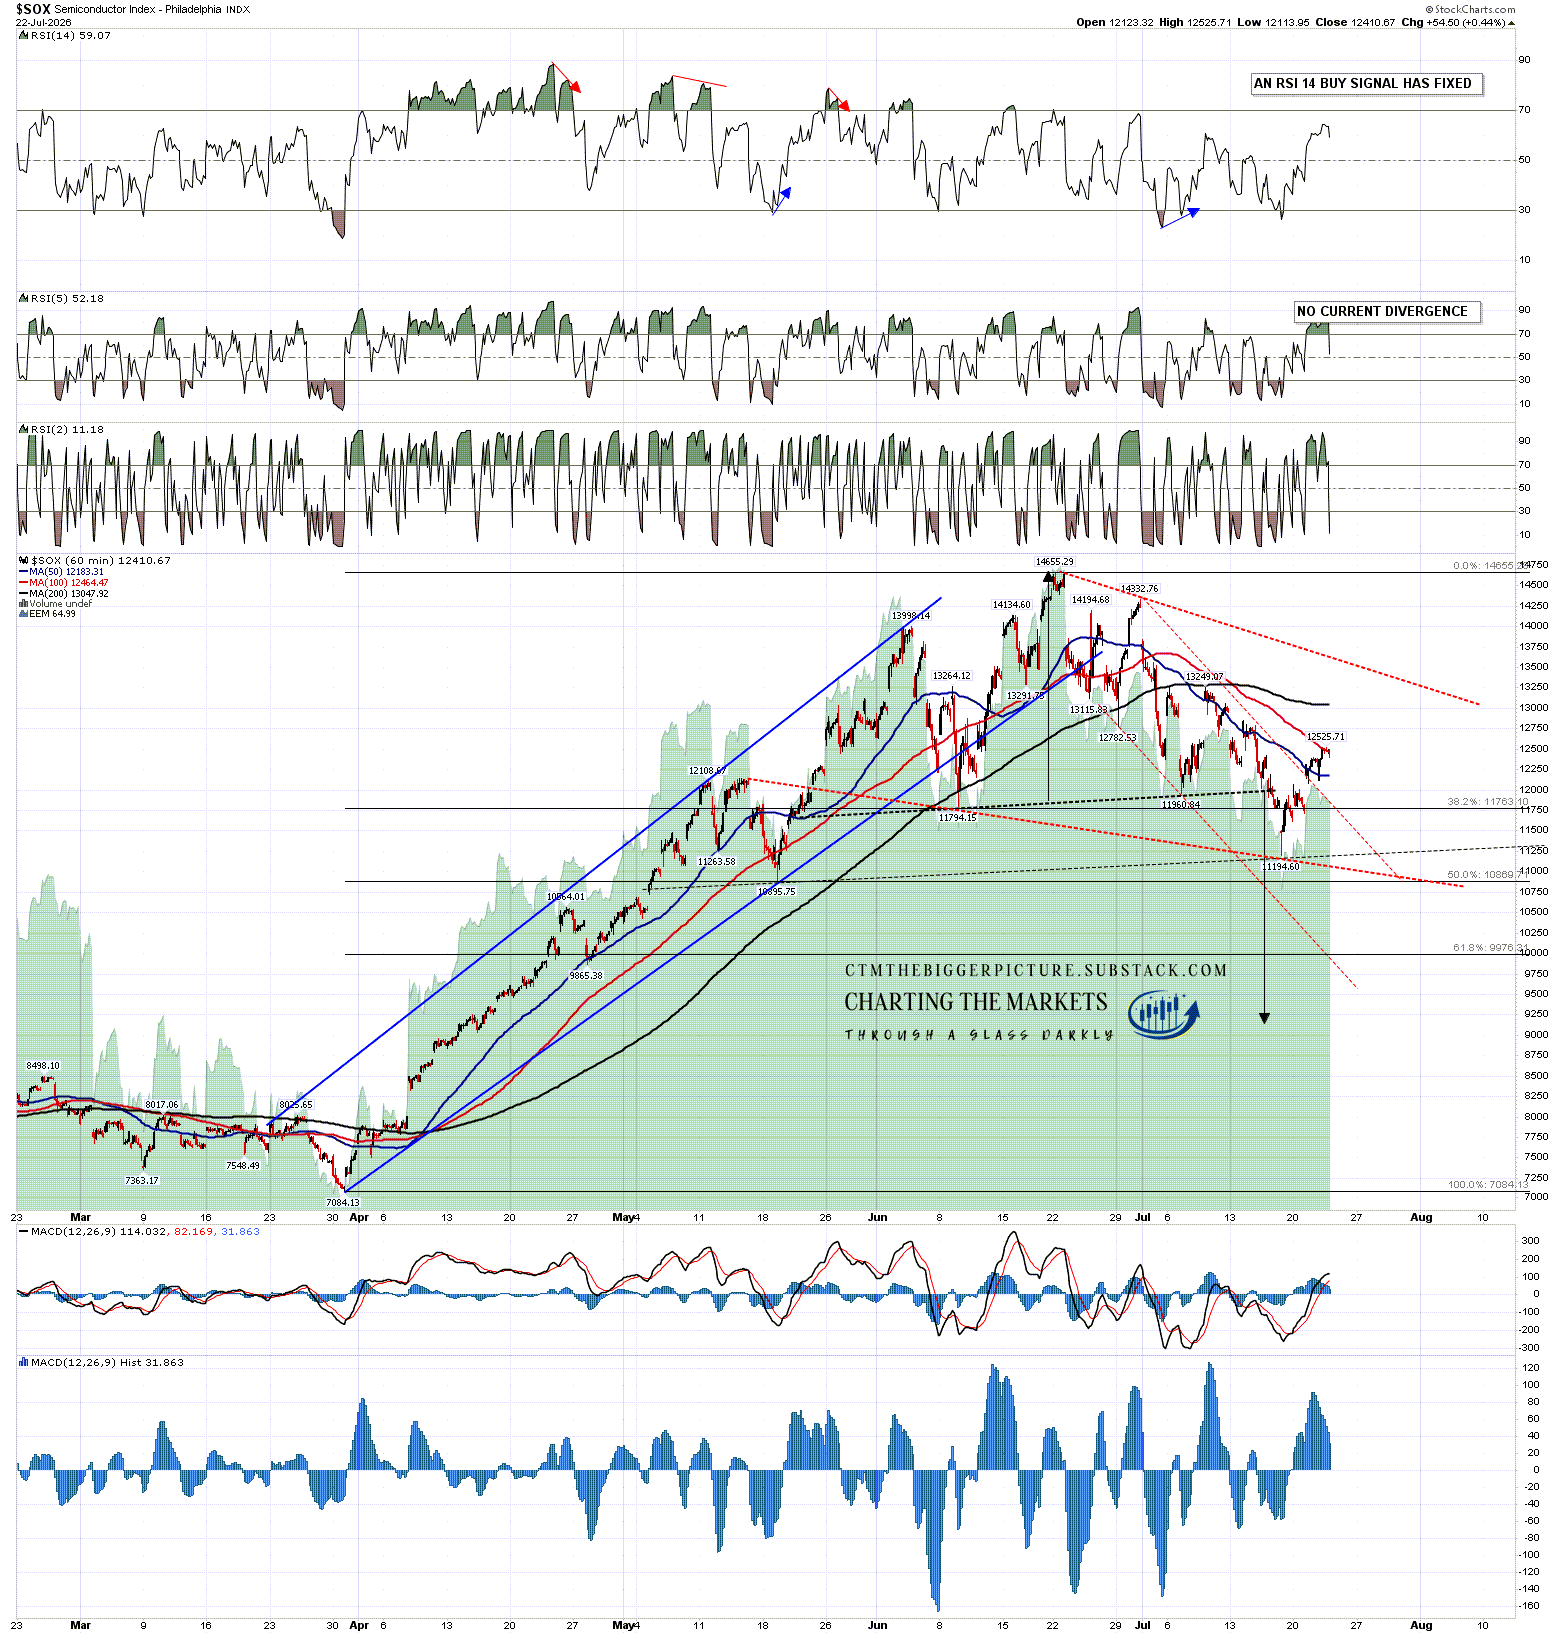
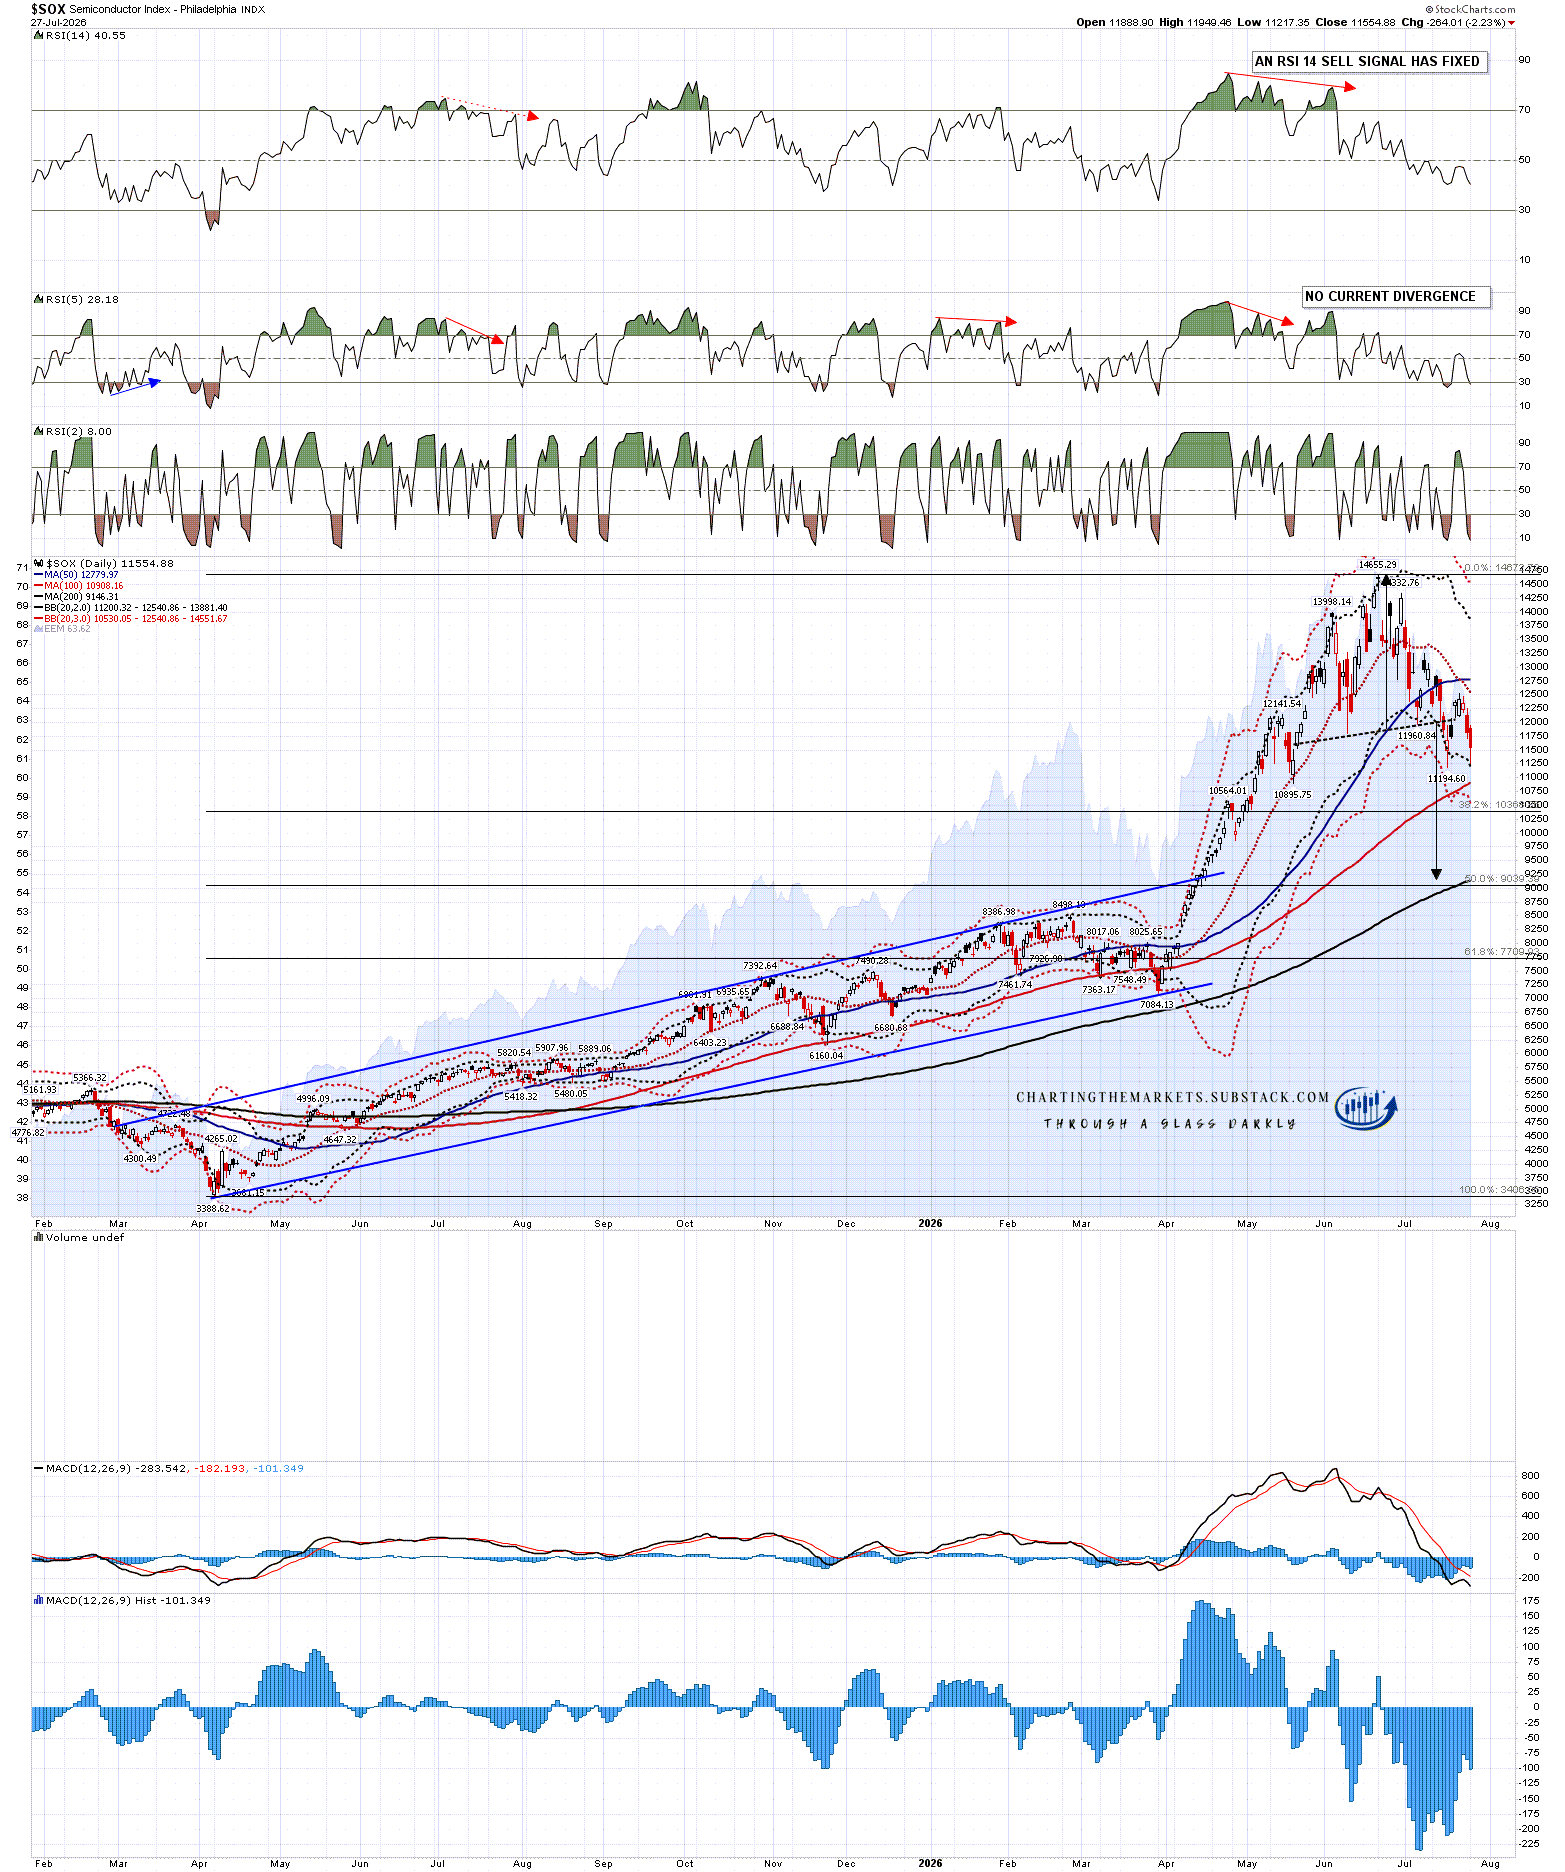
I was also looking at the strong rally on the Philadelphia Semiconductor Index (SOX) and looking at the very binary setup there where it is likely either to head down to the fixed H&S target in the 9,150 area or, on a break back over the right shoulder high at 13,249.07, to reject back up to a retest of the all time high.
SOX has since given back most of that rally, but is still in that same inflection point, as it may currently be forming a double bottom to go higher. A double bottom setup that forms at the current low at 11,194.60 could deliver a bigger rally or full rejection higher. A sustained break below would look for that 9,150 target.
SOX daily chart:
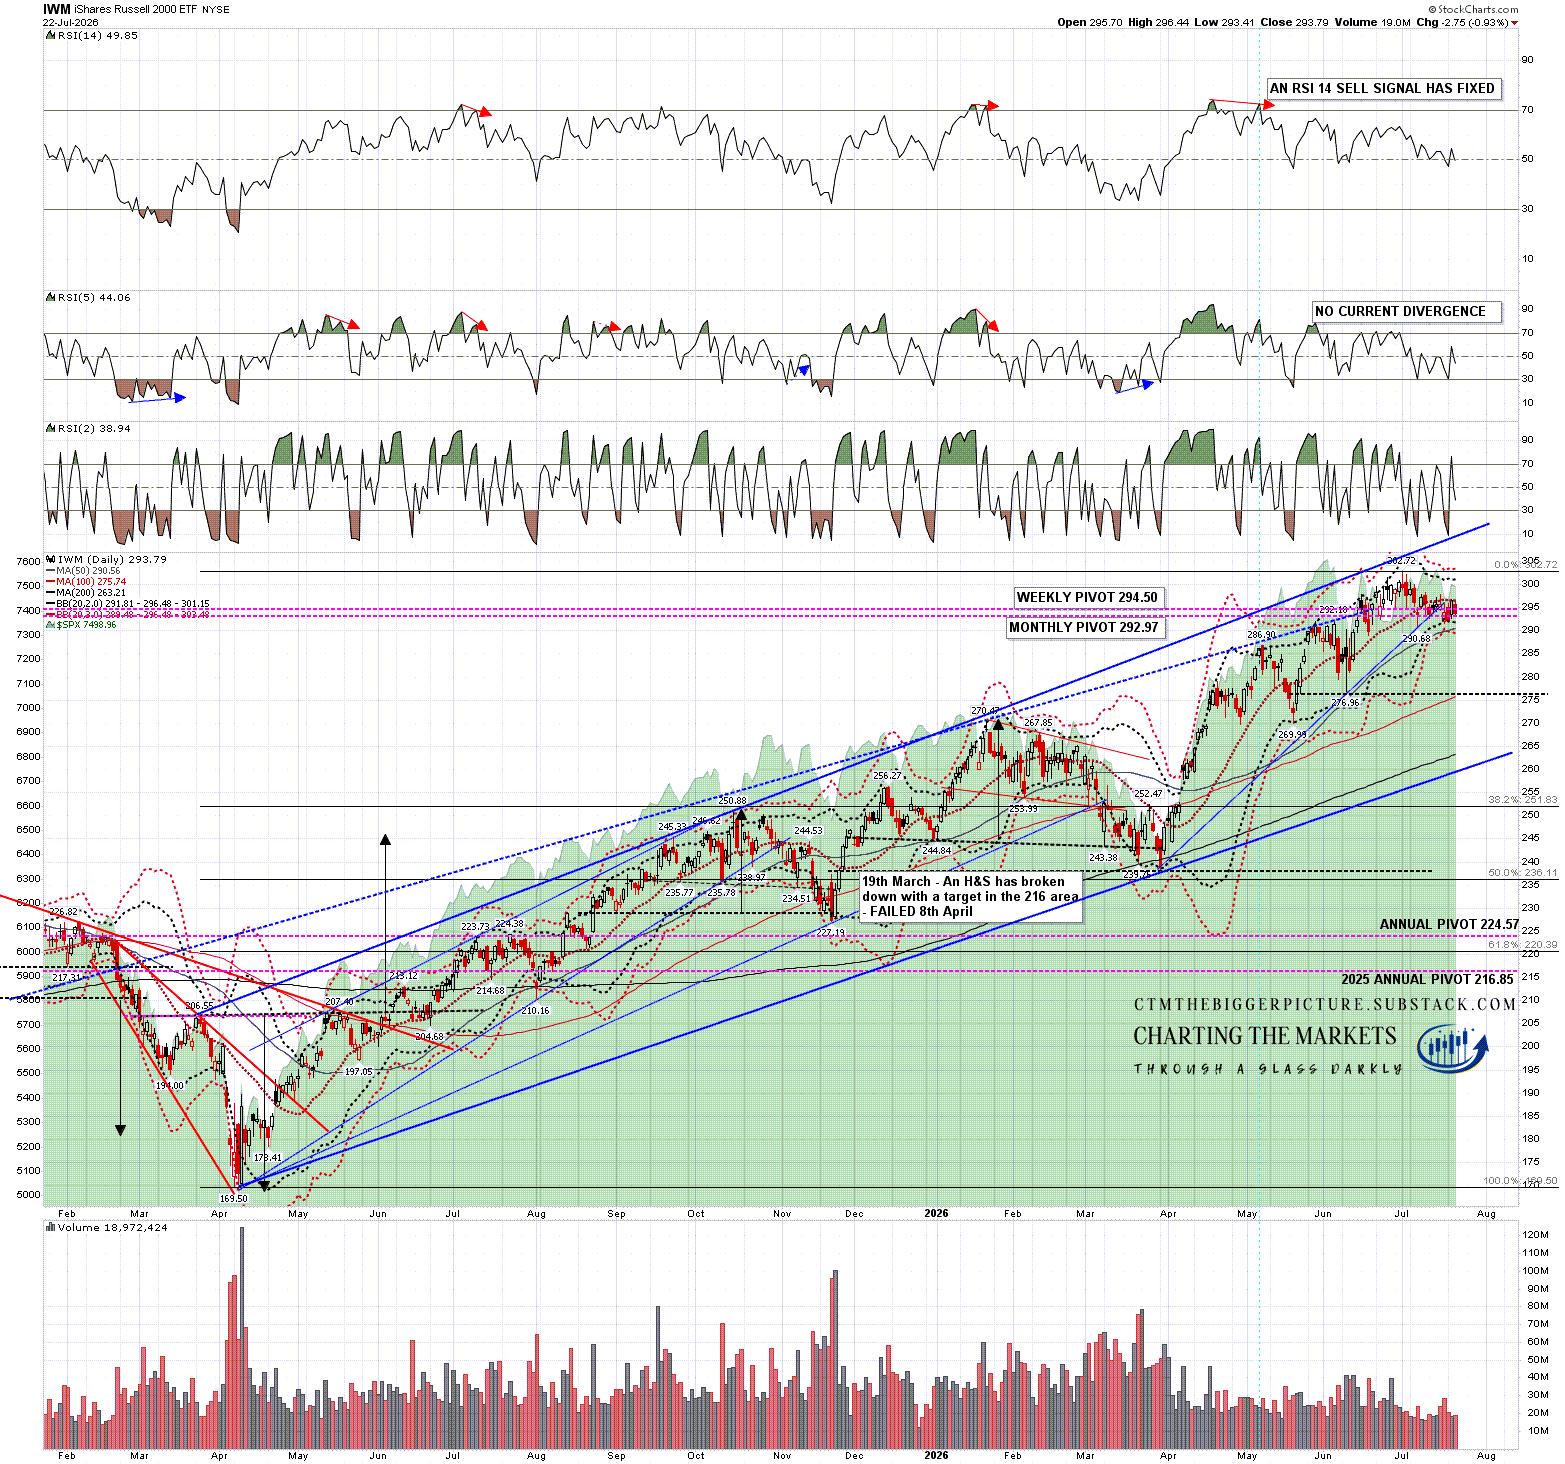
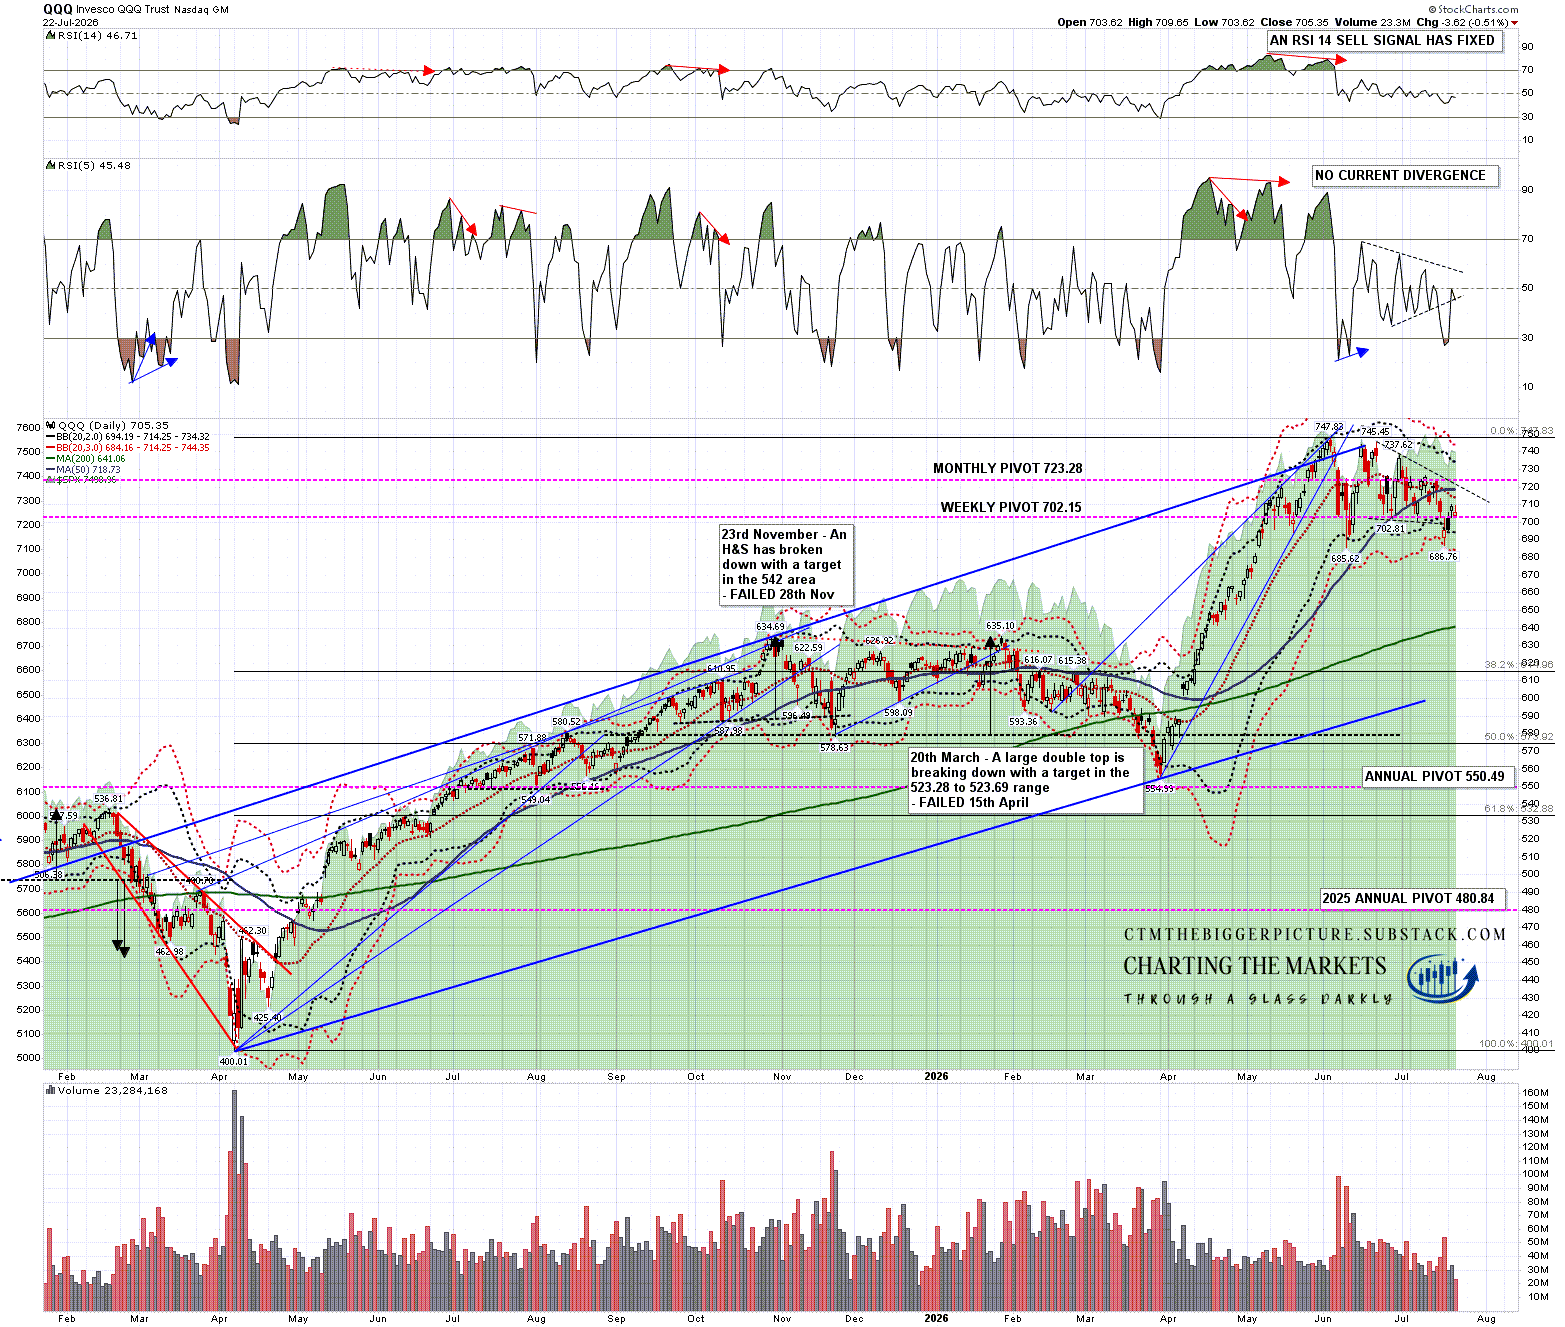
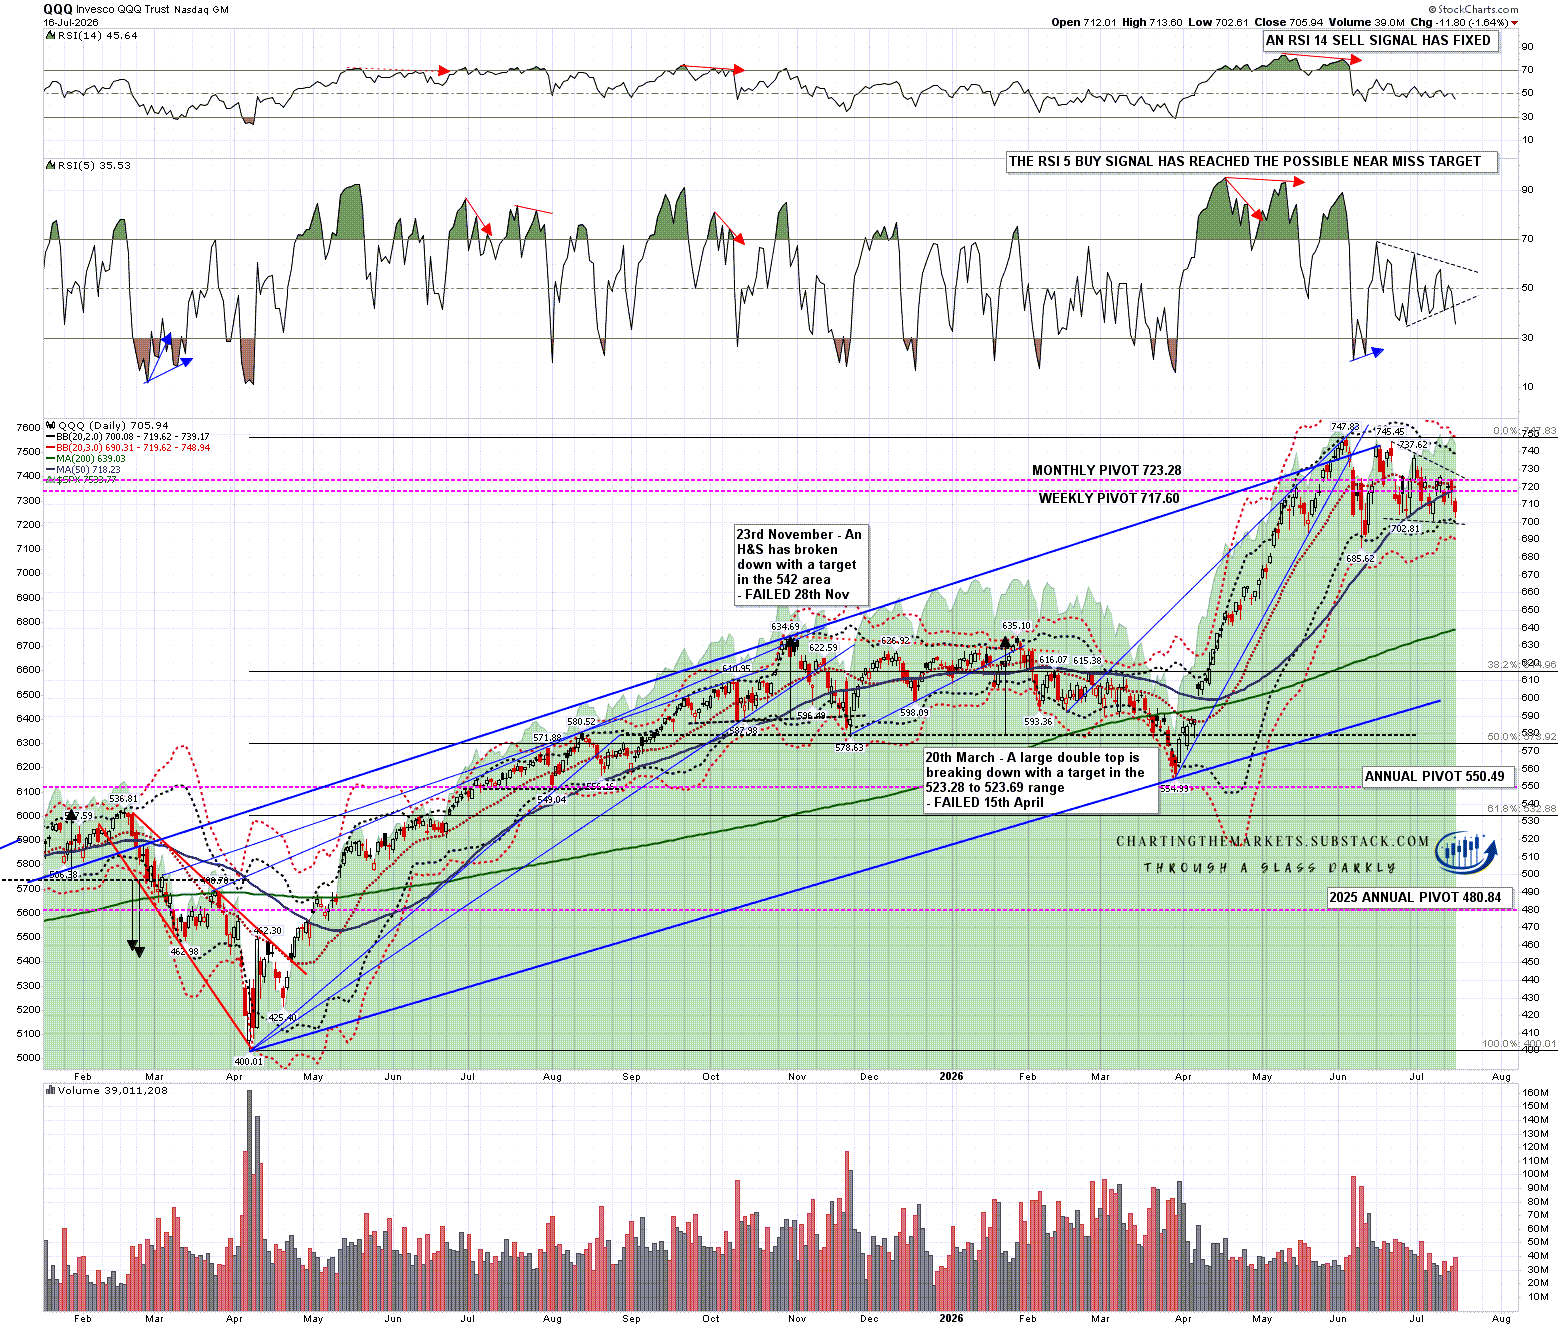
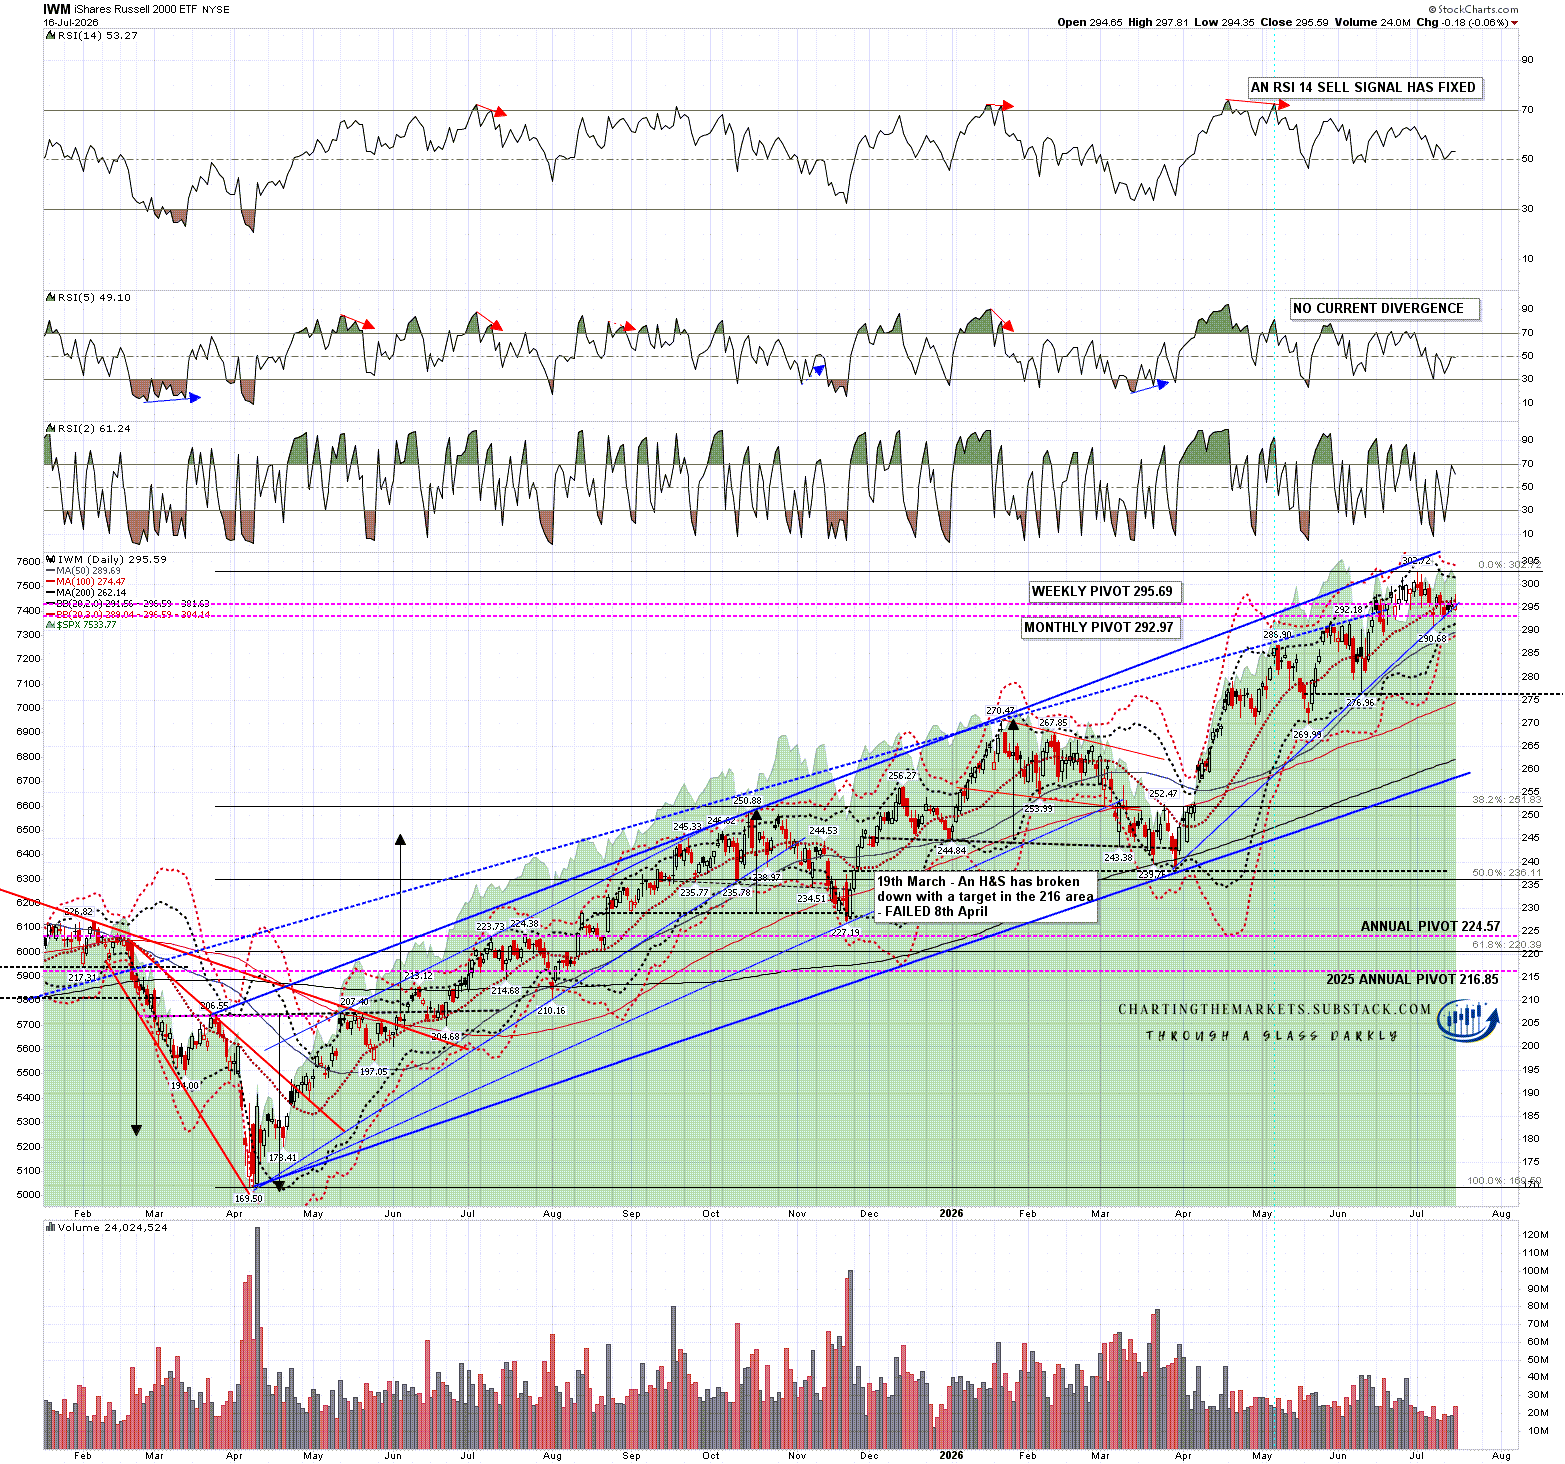
So as we stand after the failed rally yesterday, with all of SO, SPX, QQQ, DIA & IWM still below their daily middle bands, and all also on fixed daily RSI 14 sell signals, there is a clear opportunity to break lower here, and I’ll be watching for that today and tomorrow. Tomorrow leans bearish and is also FOMC, where the Fed may of course have bad news about inflation and interest rates.
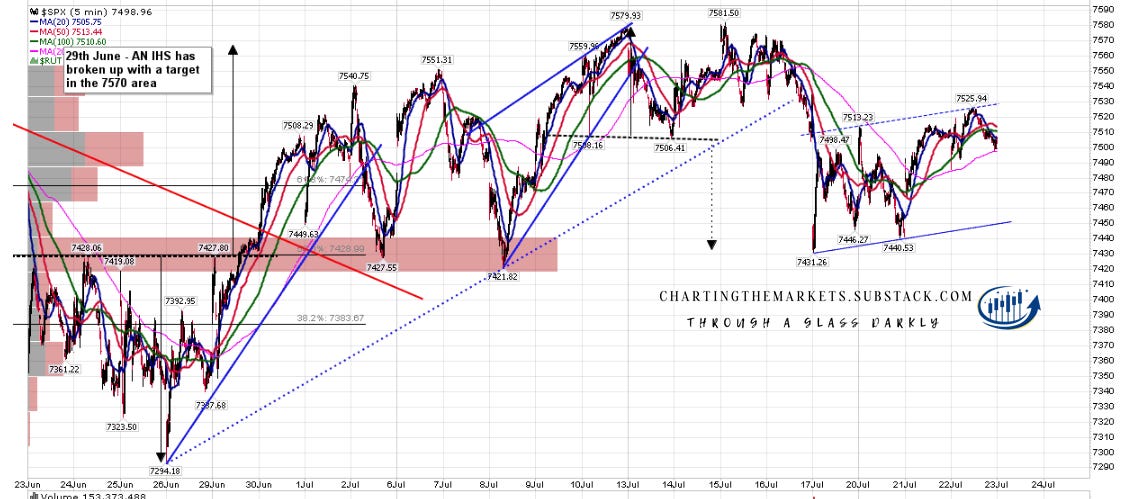
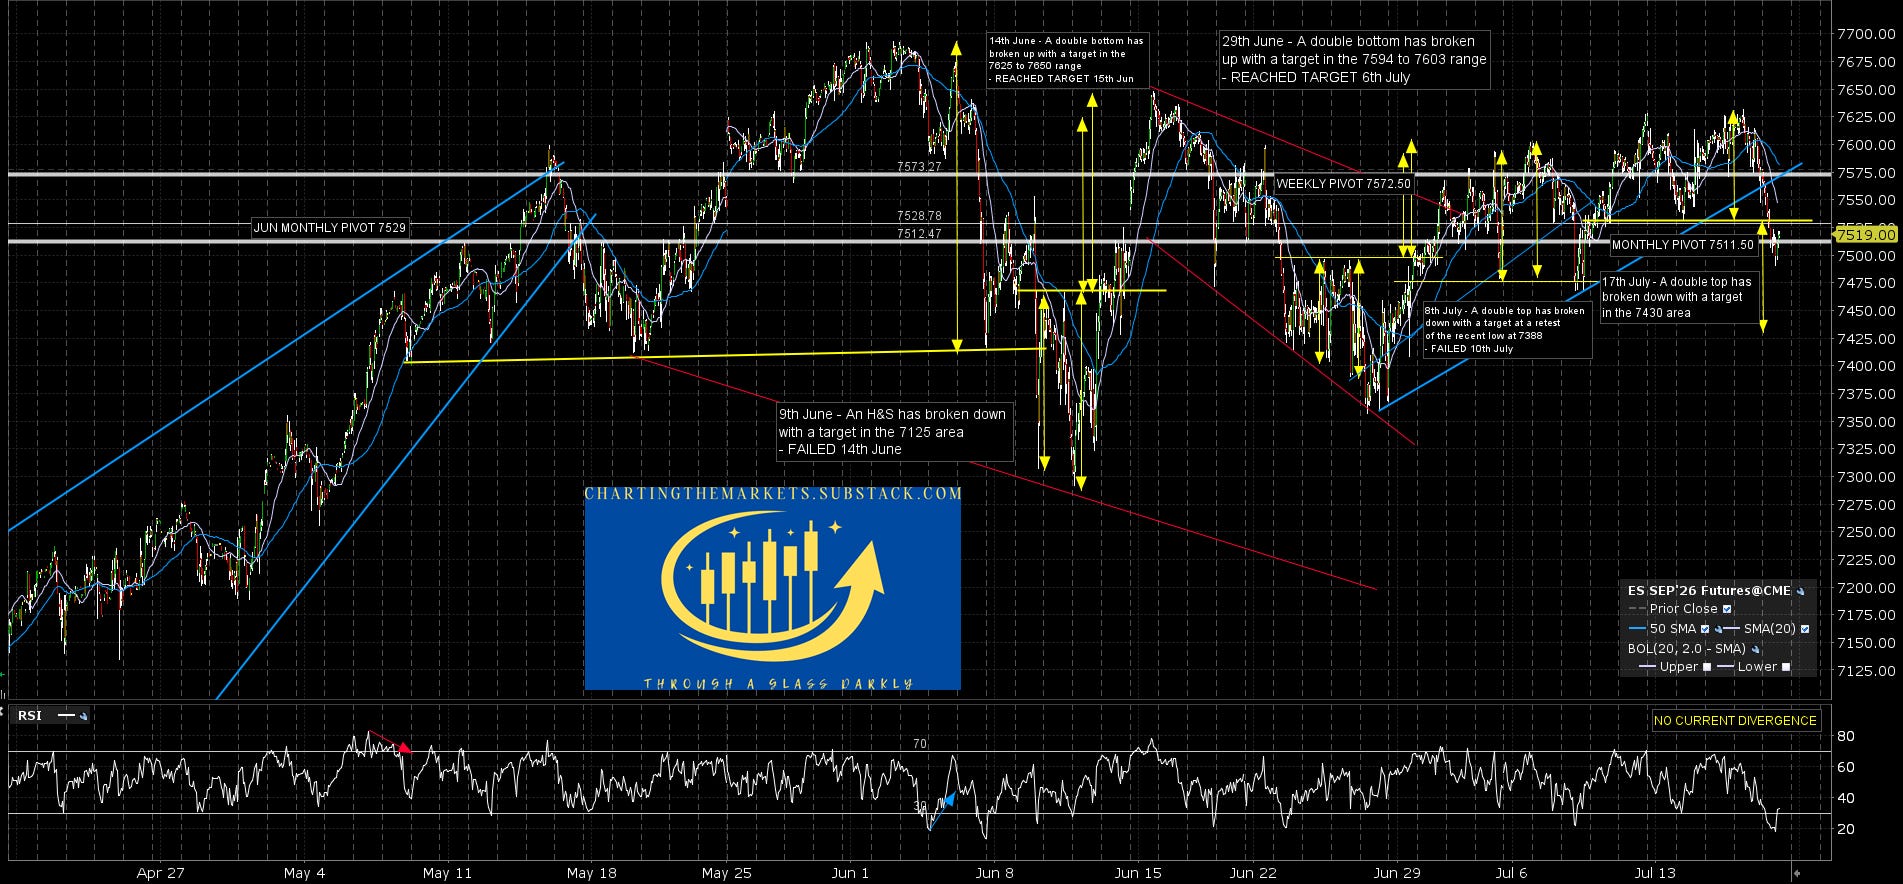
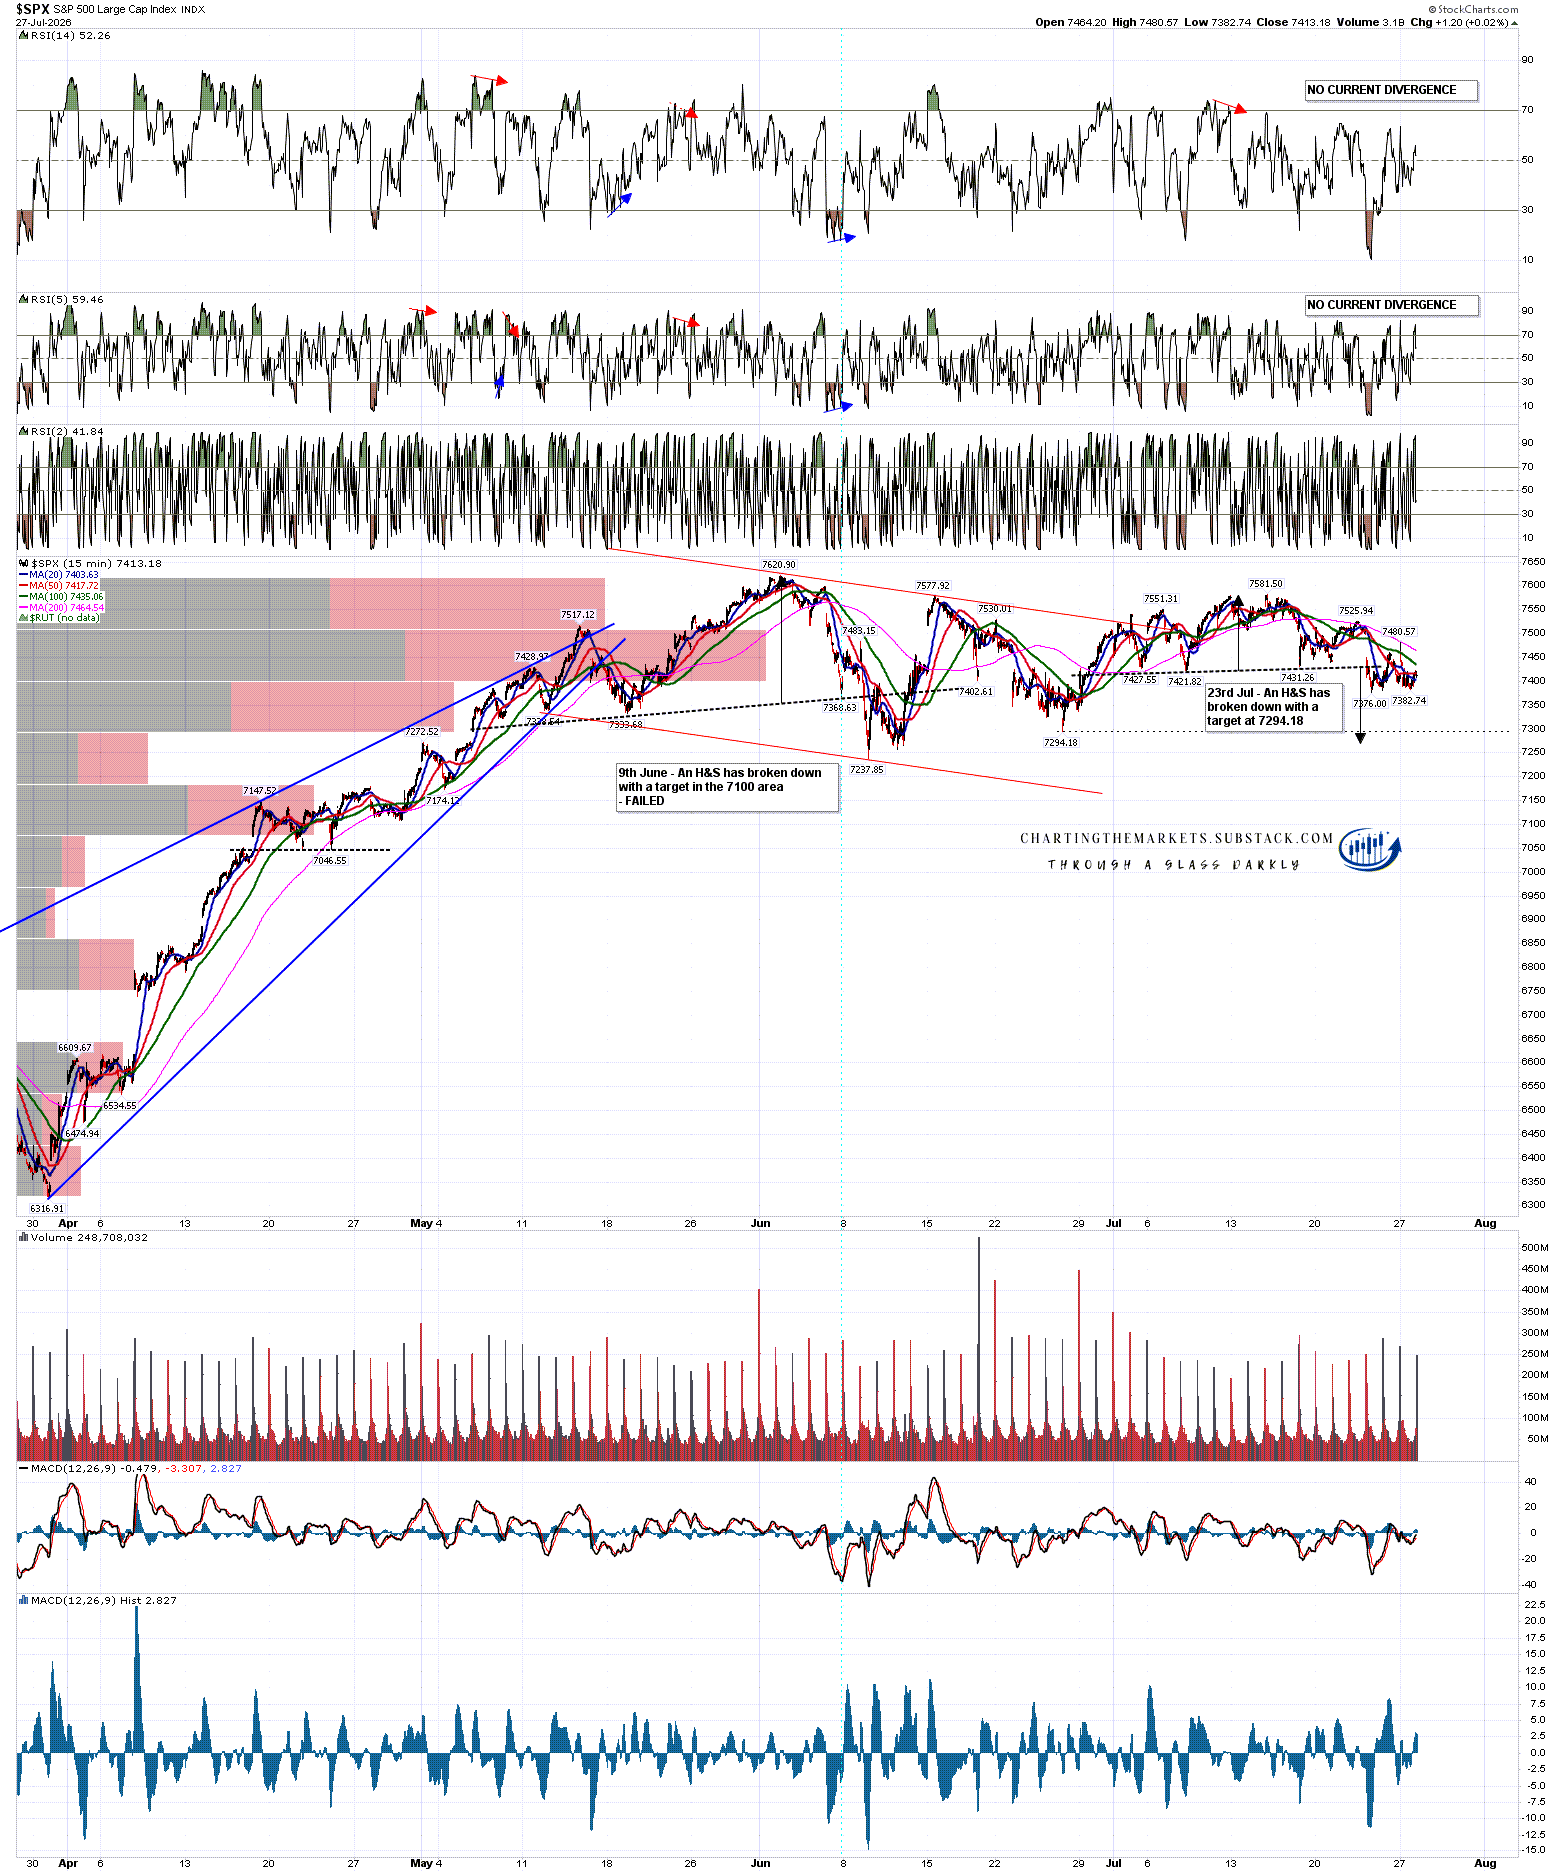
So what are the other pattern targets looking lower here? Aside from on SOX there’s nothing that dramatic to see. On SPX a small H&S has broken down with a target at a retest of the late July low at 7294.18.
SPX 15min chart:
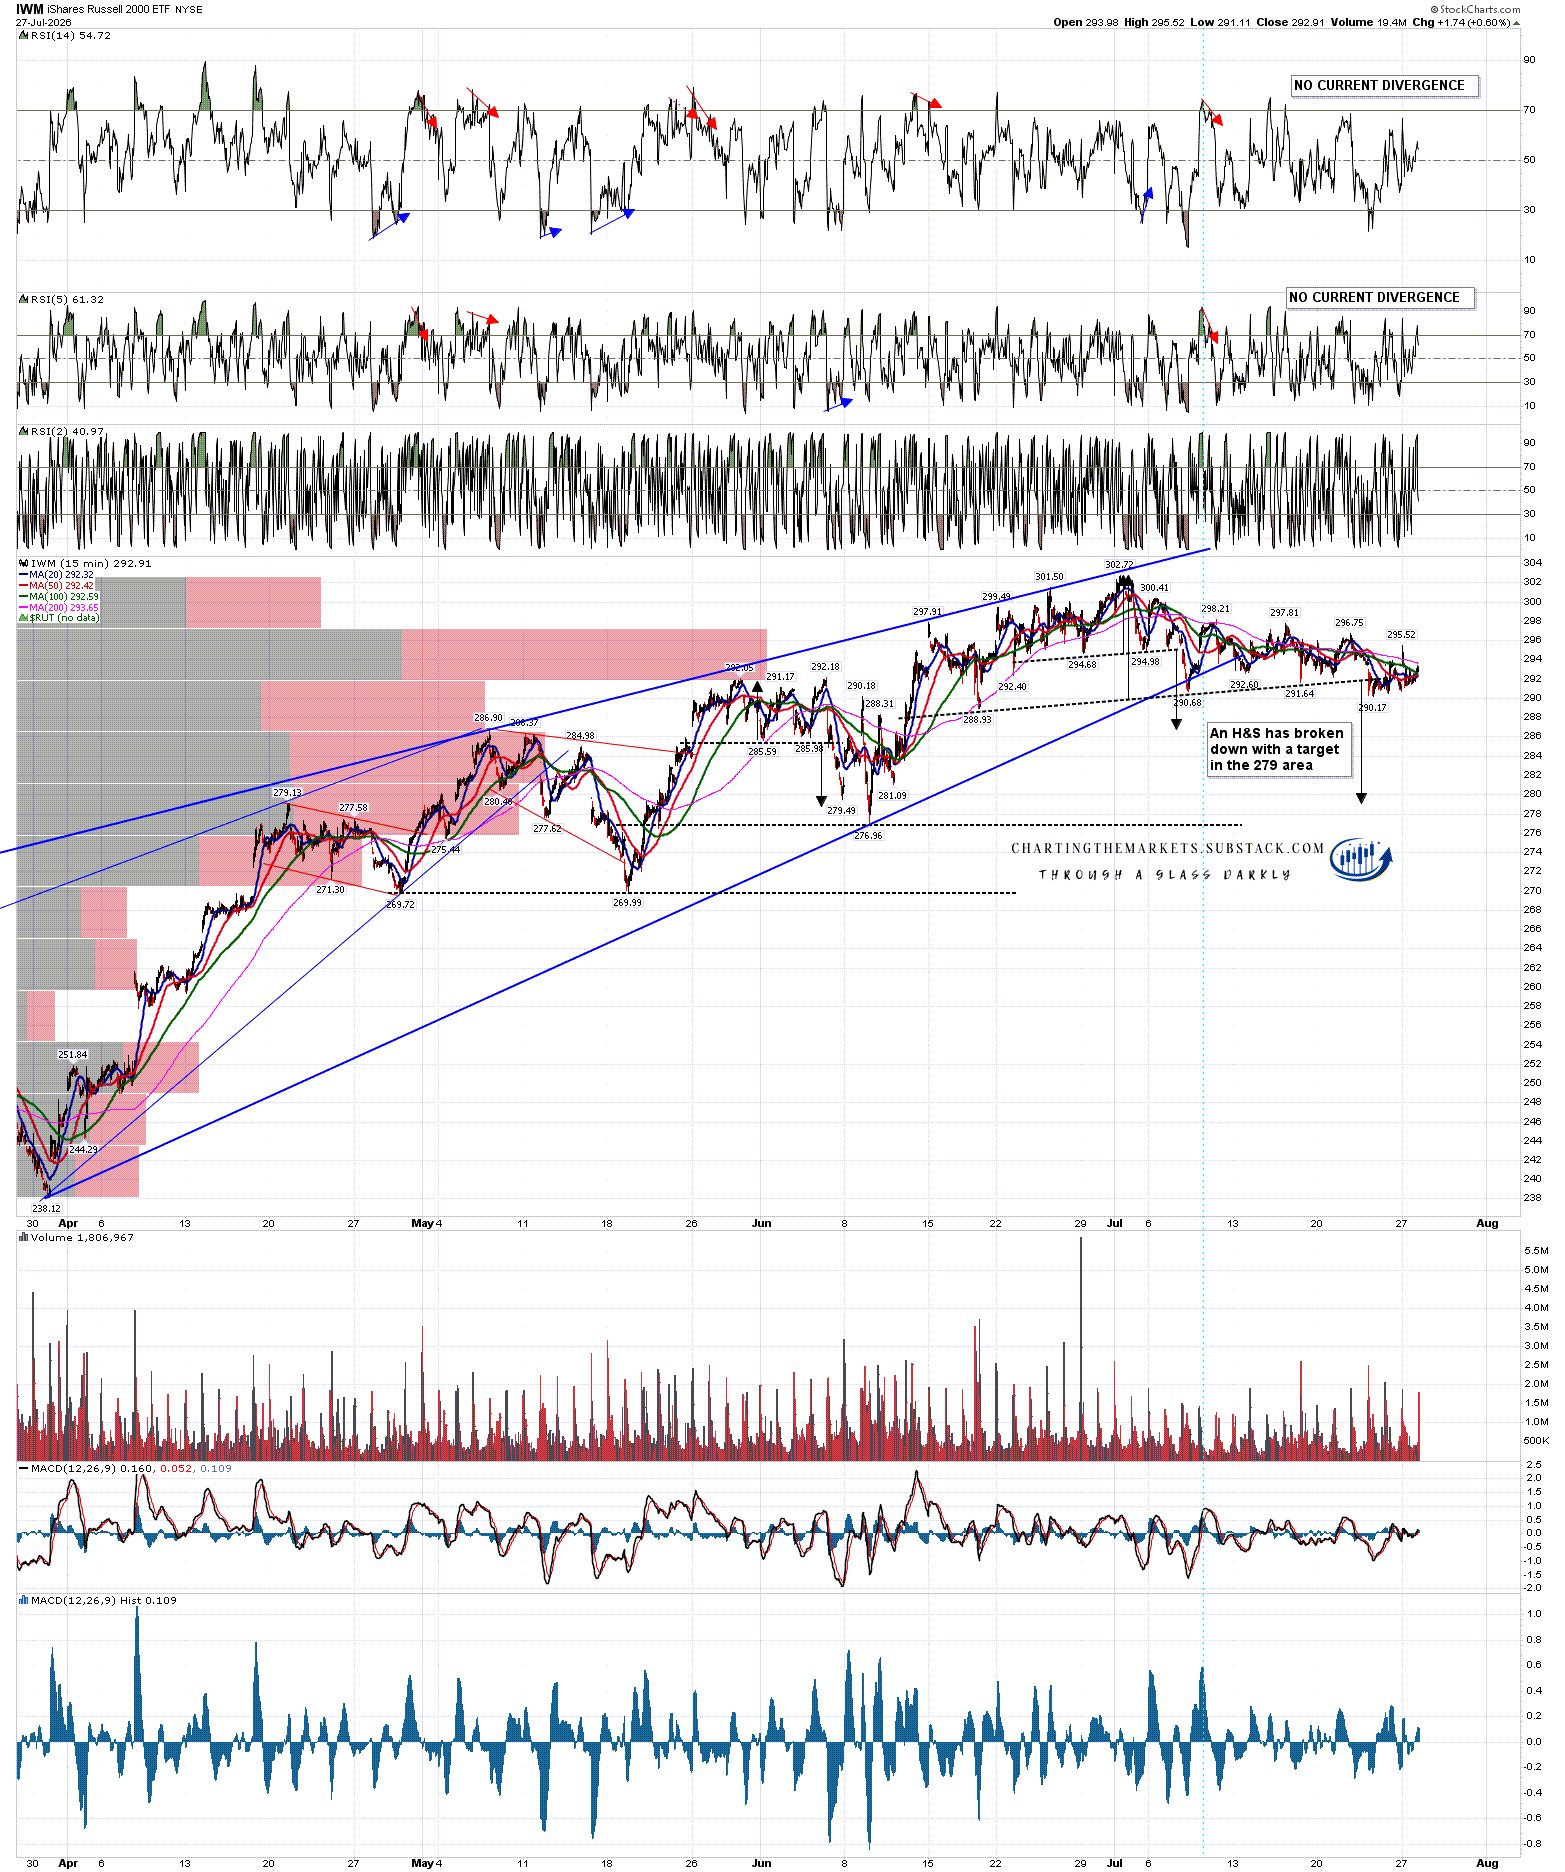
On IWM there is a larger H&S now that has broken down with a target in the 279 area.
IWM 15min chart:
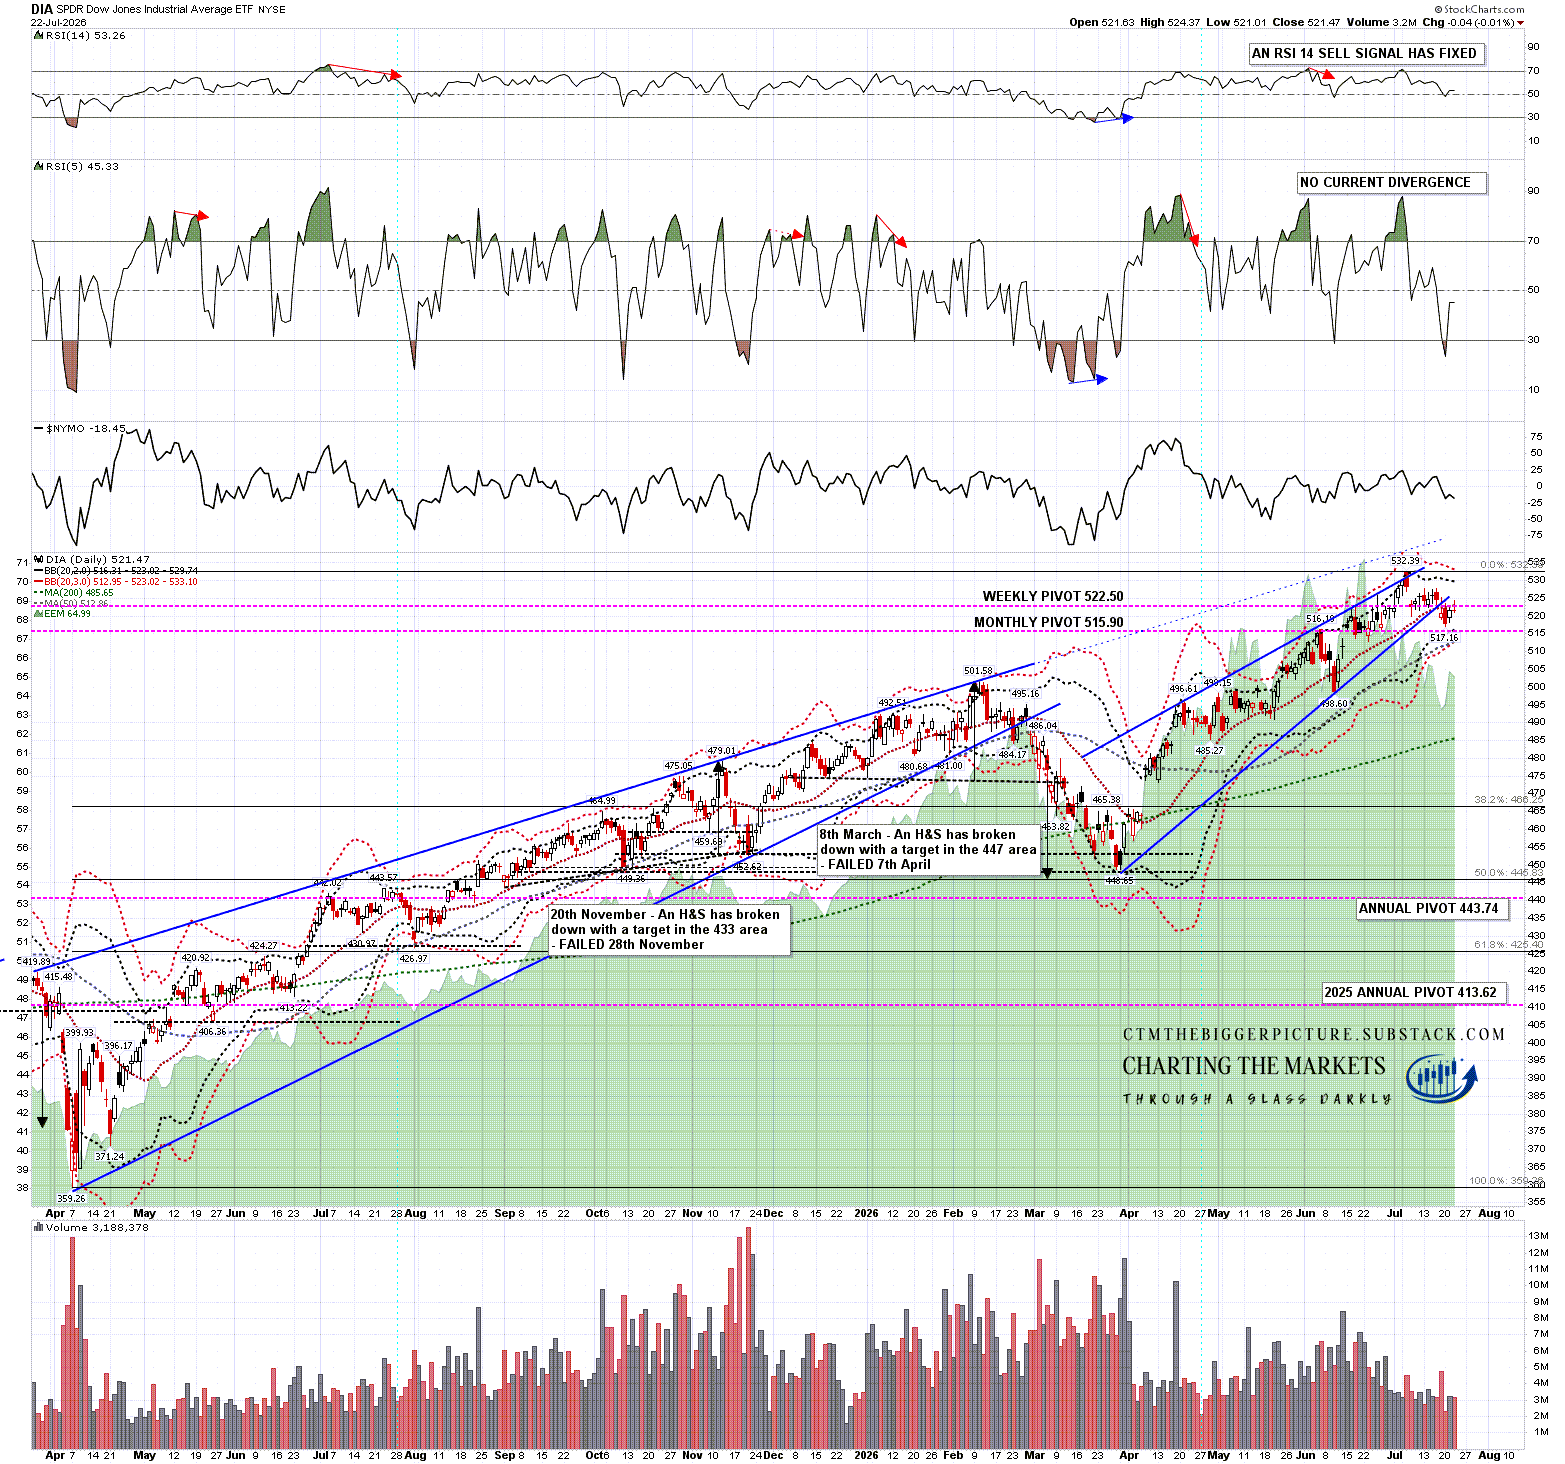
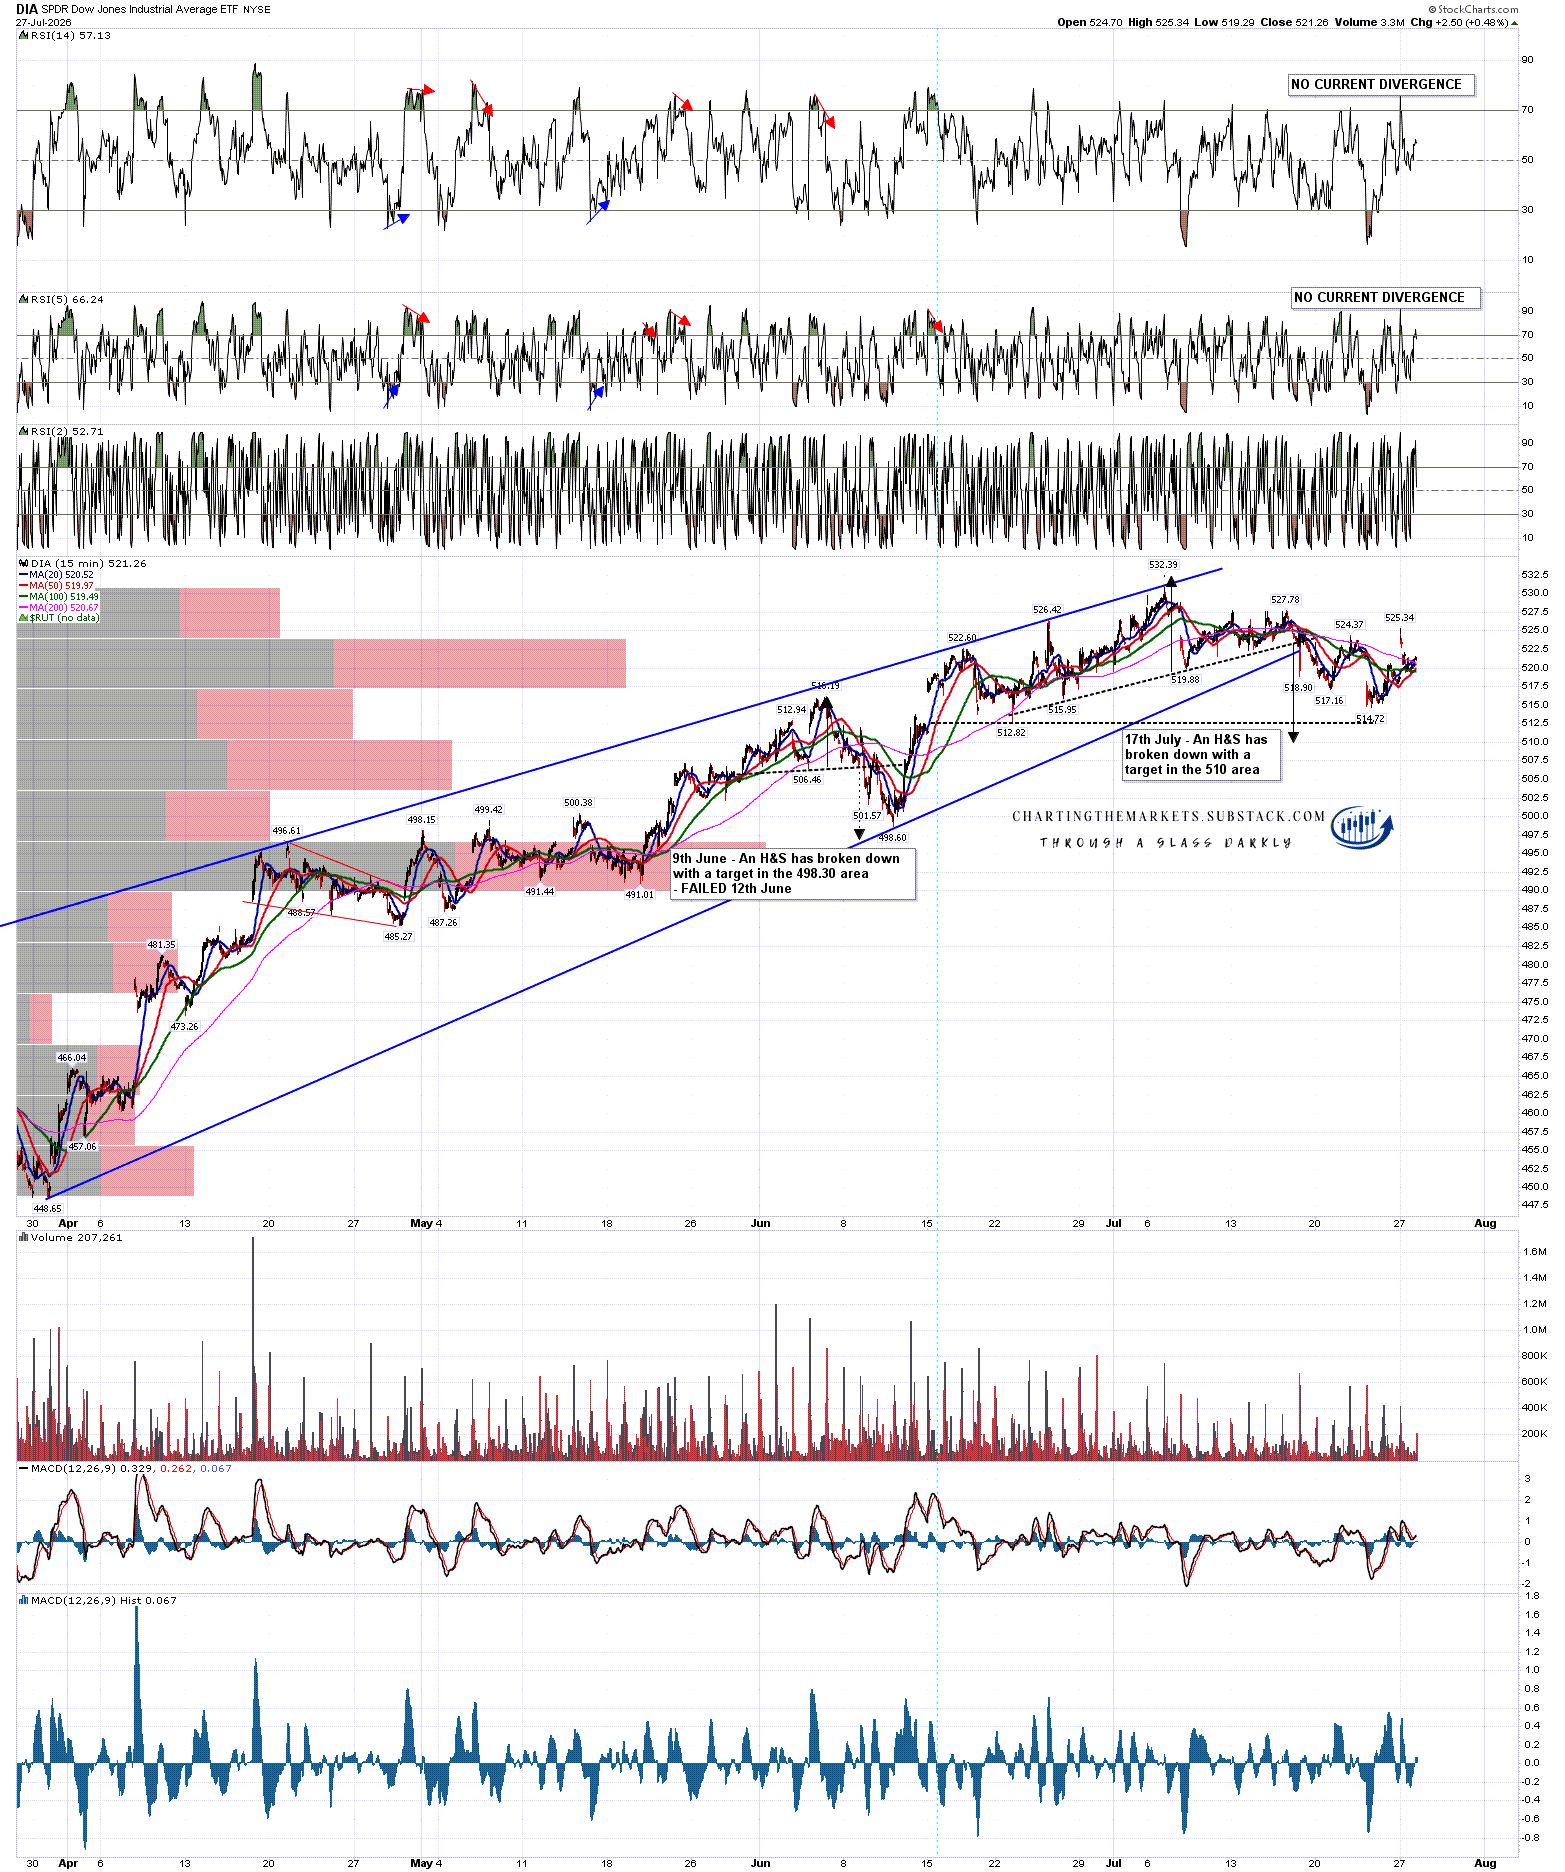
On DIA a small H&S has broken down with a target in the 510 area, though a larger H&S may also be forming.
DIA 15min chart:
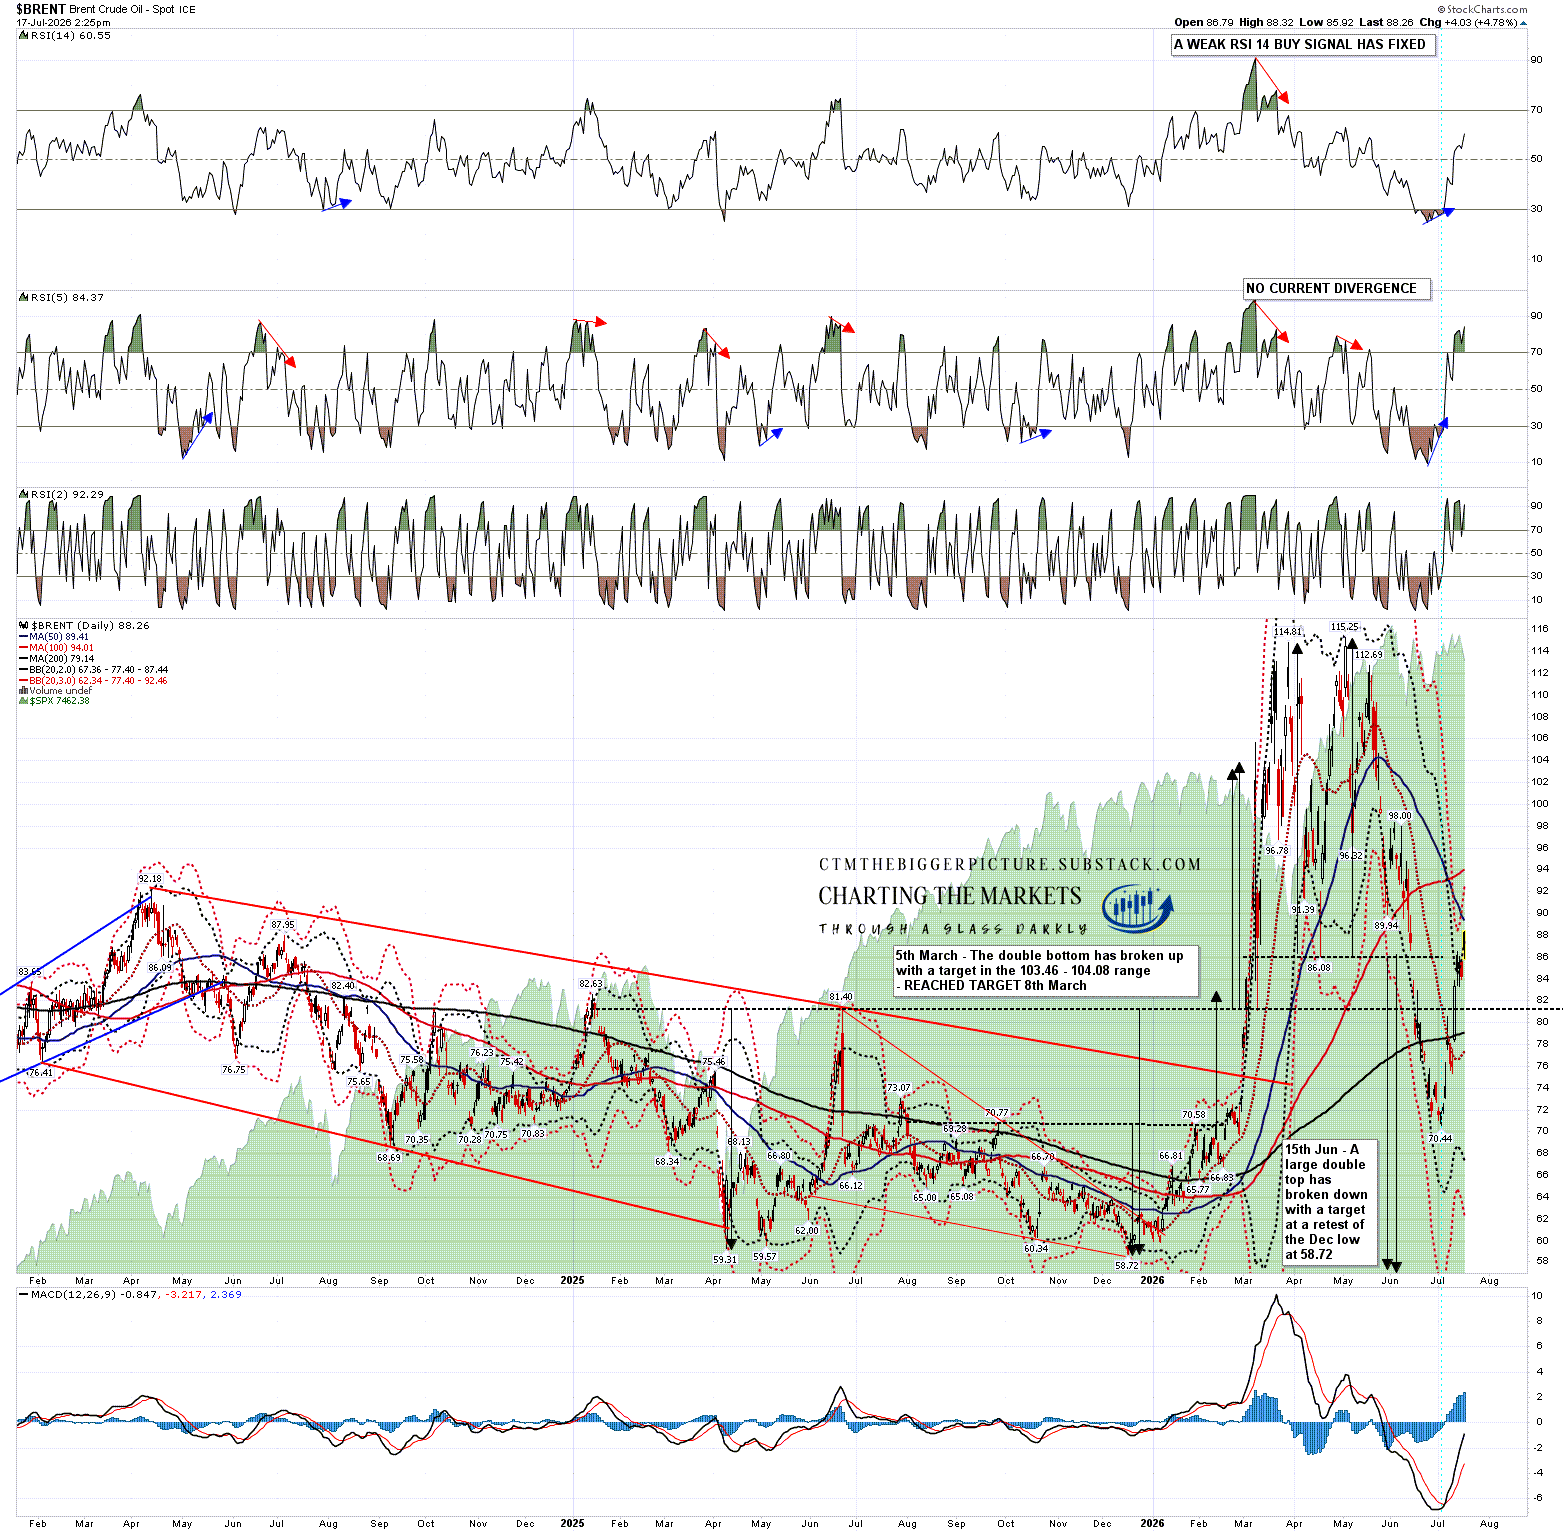
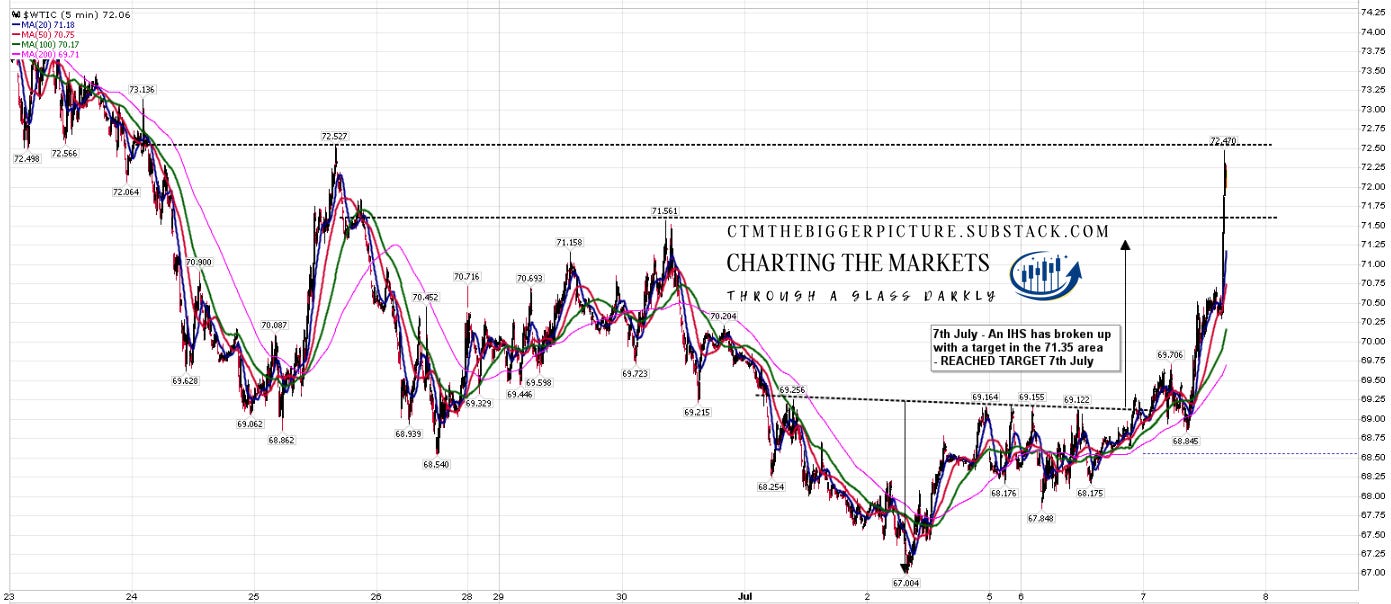
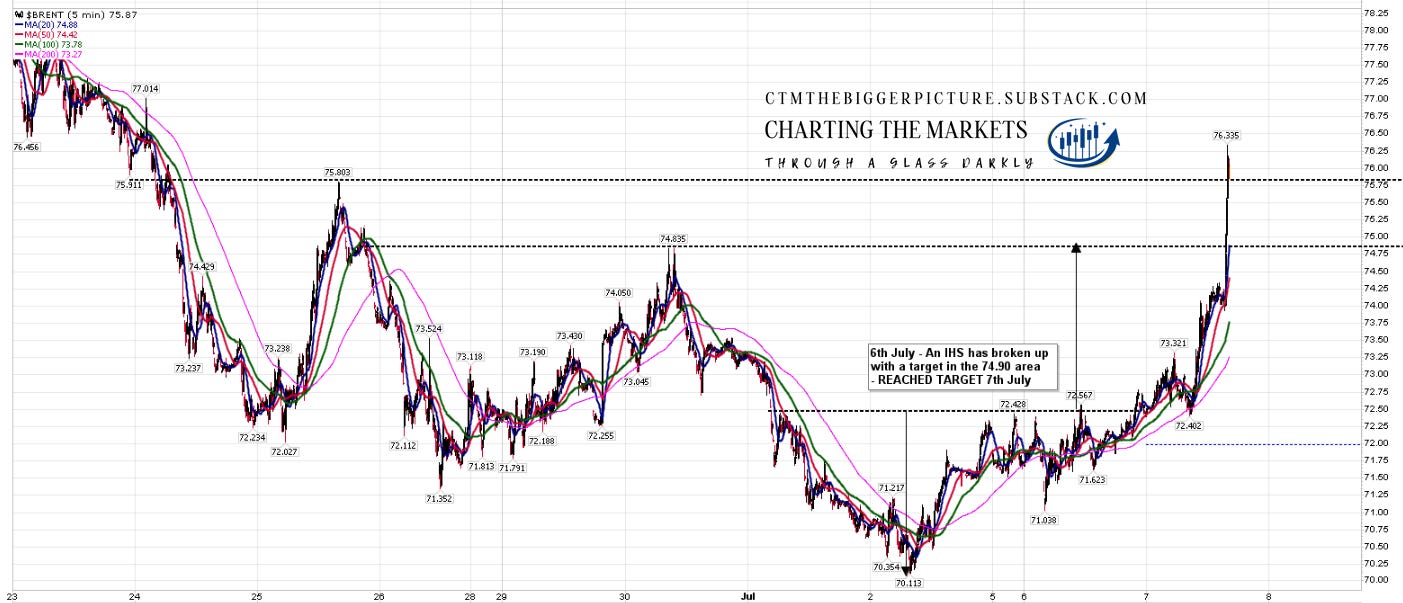
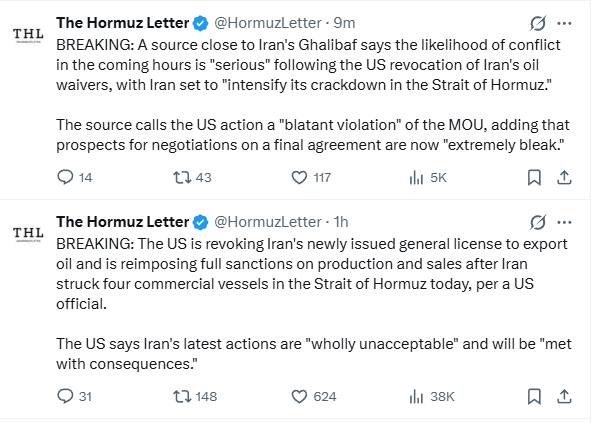
Is there a bull scenario here? Yes, though the Iran War news isn’t great and may well get worse. All of these H&S patterns, as with the H&S on SOX, are of course potentially bullish patterns if they fail on a break back over the H&S right shoulders.
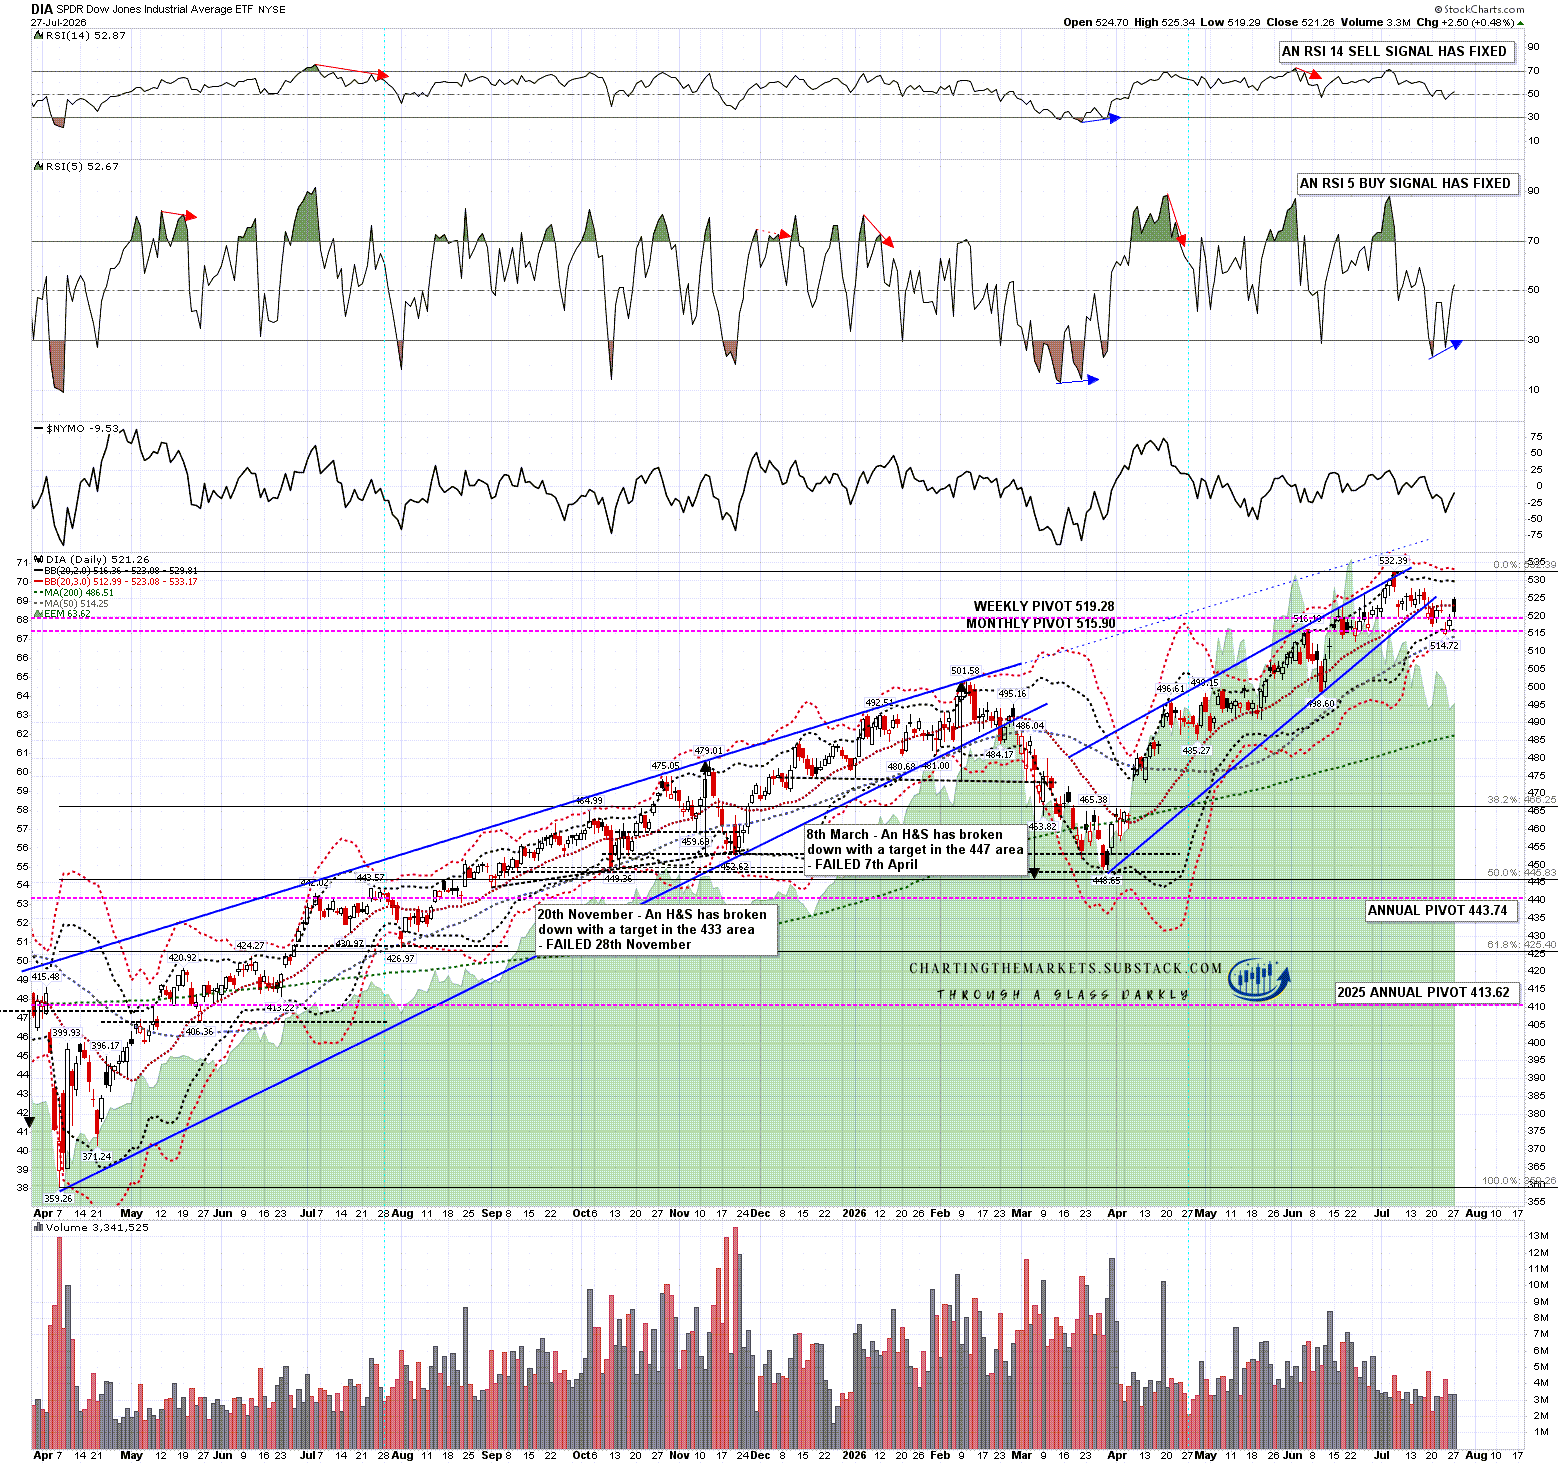
There is a good quality daily RSI 5 buy signal that fixed yesterday on DIA, though it is the only one across these five indices and DIA tested but failed to break back over the daily middle band yesterday.
DIA daily chart:
There is also a potentially bullish setup on QQQ here, with what looks like a bull flag formed from the all time high, and possible RSI 14 and RSI 5 buy signals brewing on the hourly chart:
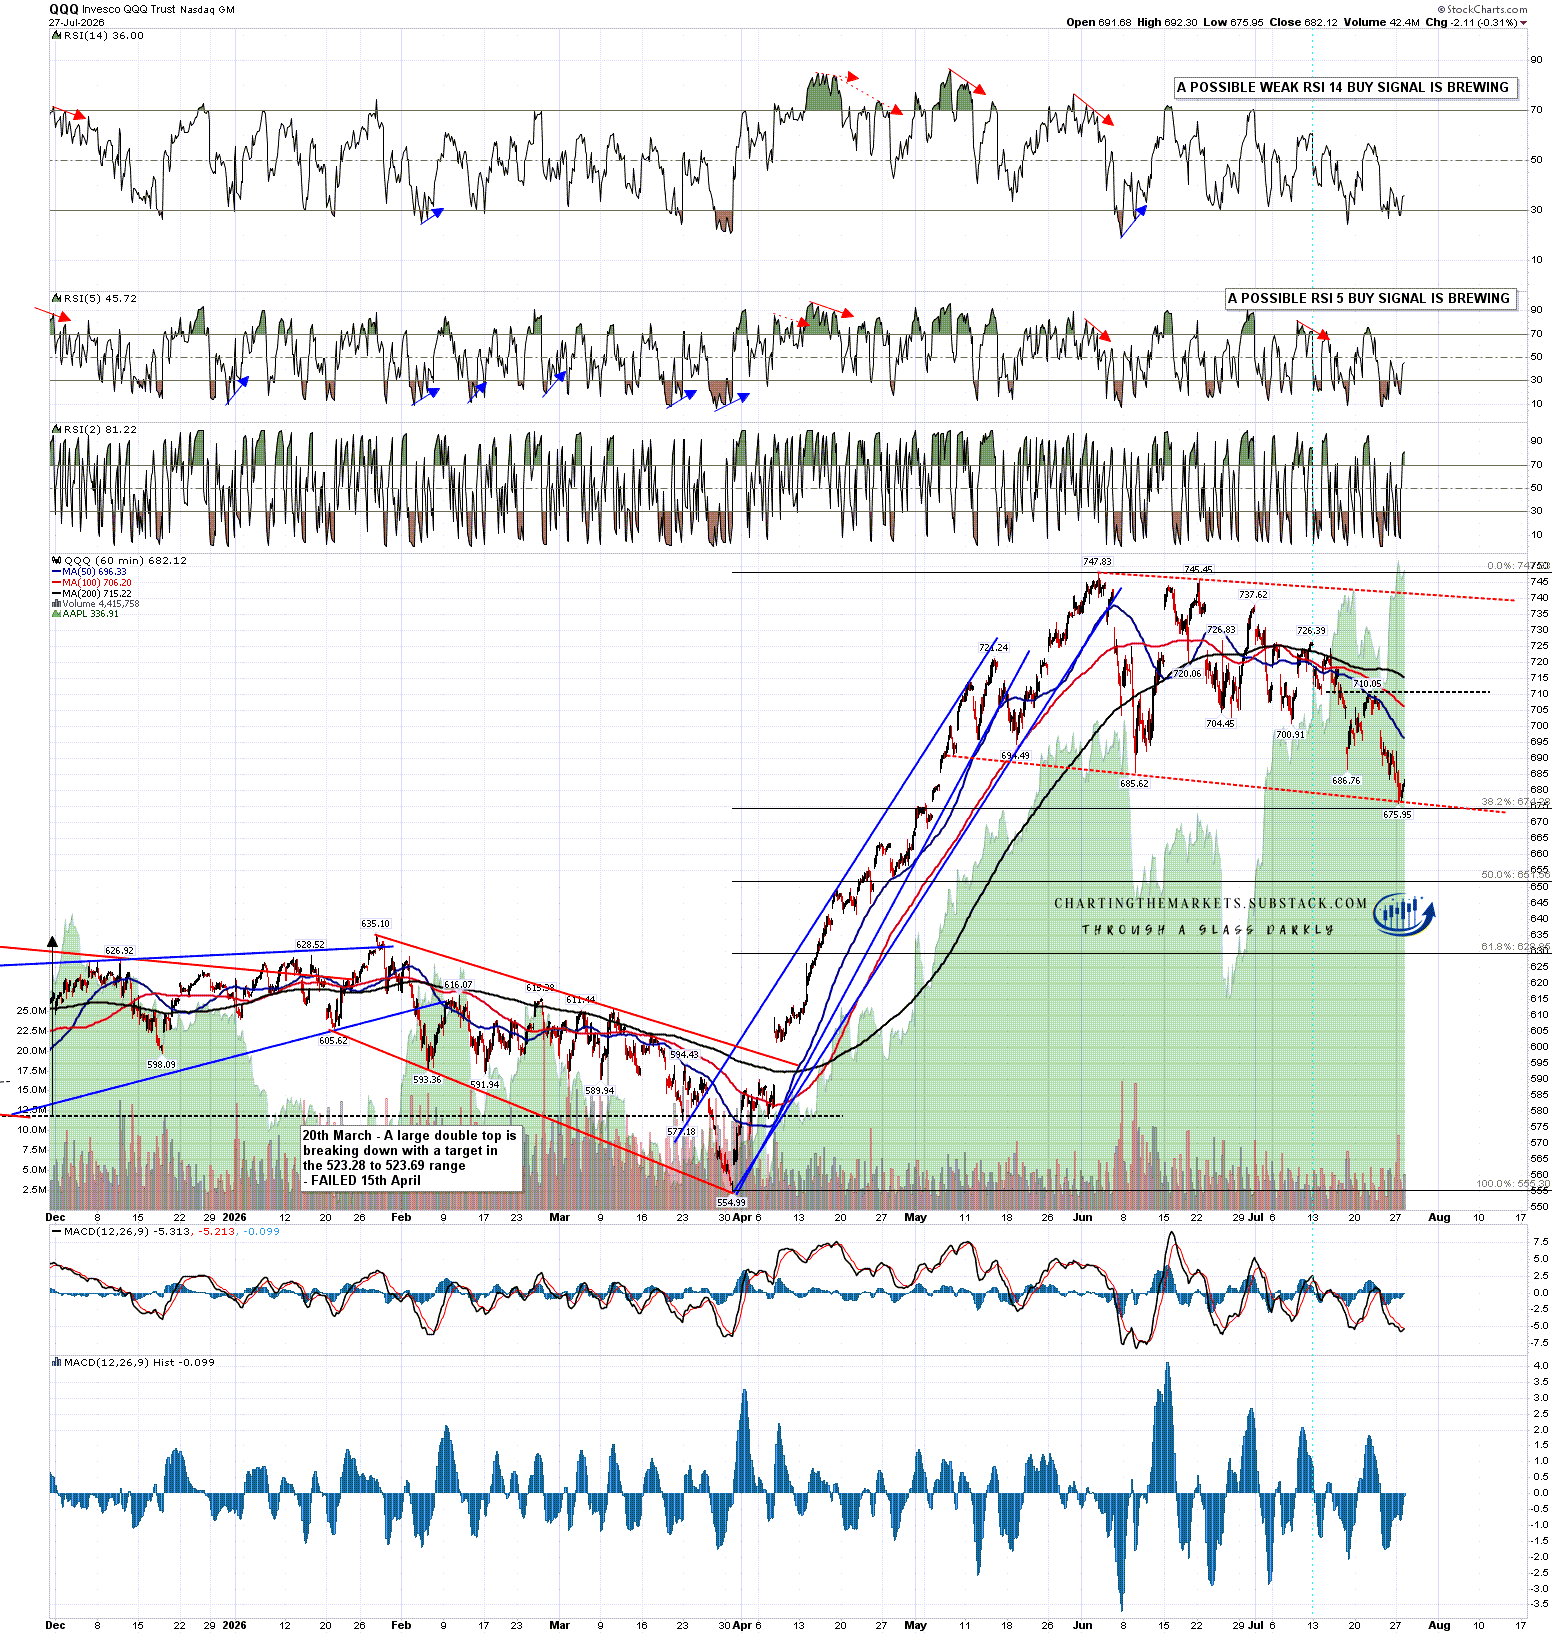
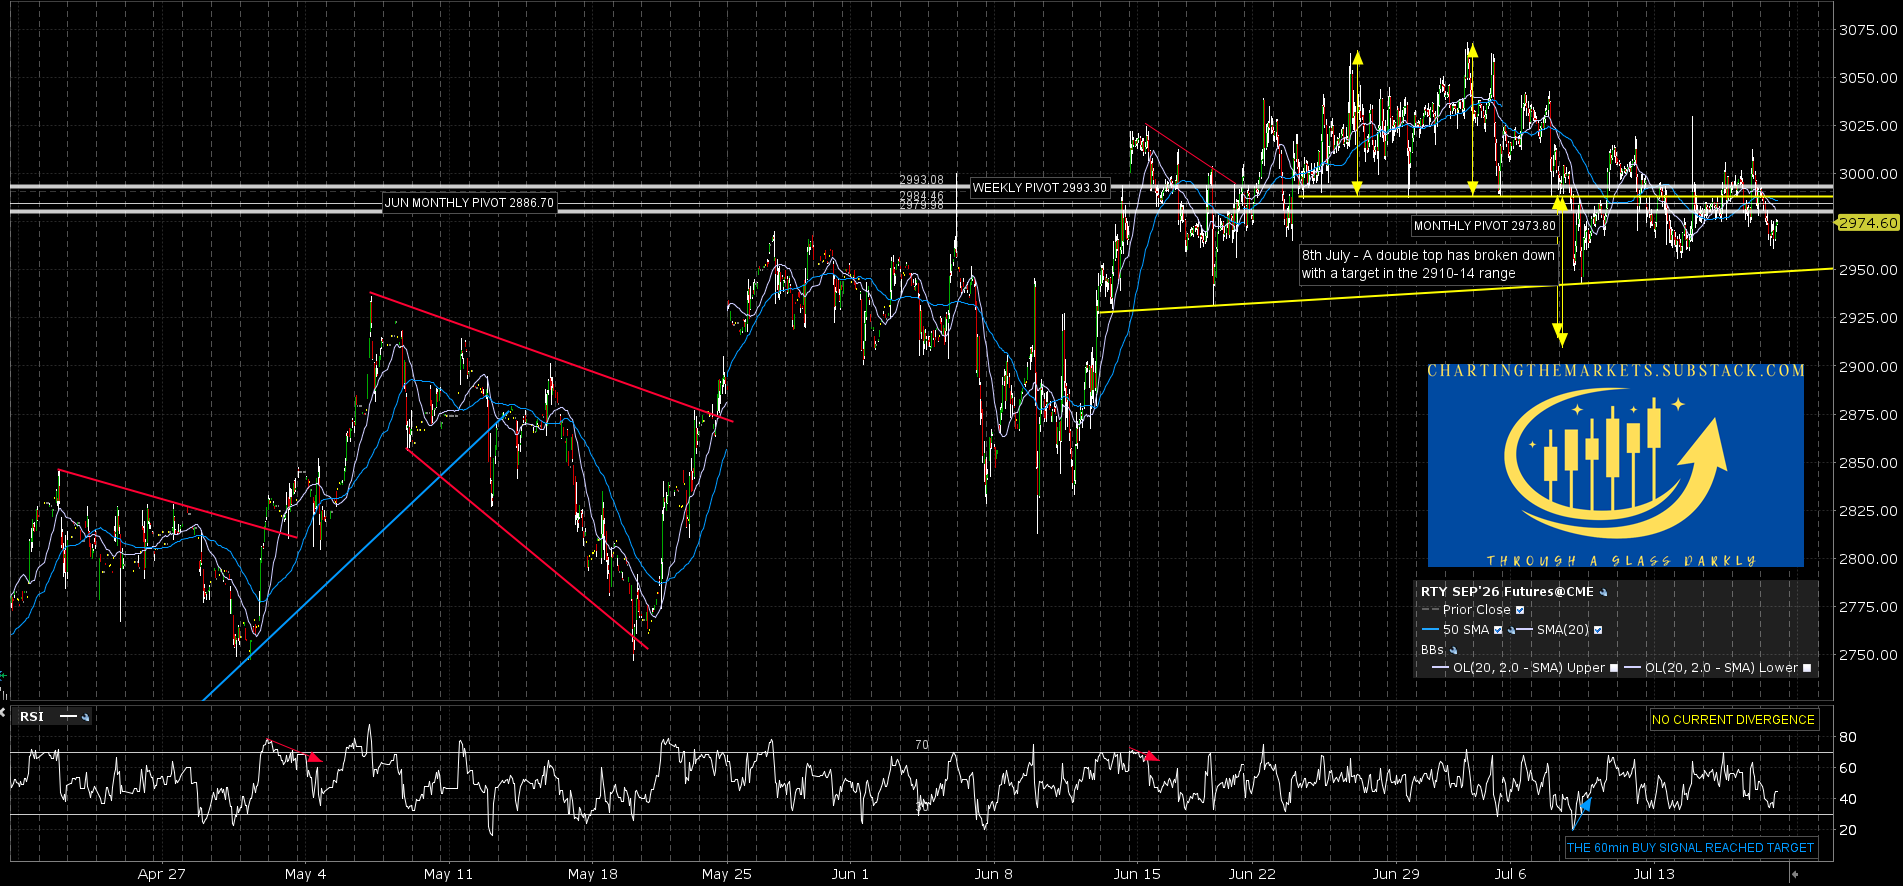
Overall equities are still in the same inflection area that they were in last Thursday but have moved back down to the bottom of that area. There is an opportunity to break lower here and, if we are going to see that happen, a decent timing opportunity to do that this week. This isn’t yet a strongly directional setup, but as long as all five of these equity indices remain below their daily middle bands, the odds lean towards continuation down. If we were to see a strong move higher though, these setups could all turn bullish with targets at retests of their all time highs.
If you like my analysis and would like to see more, please take a free subscription at my chartingthemarkets substack, where I publish these posts first. I also do a premarket video every day on equity indices, bonds, currencies, energies, precious commodities and other commodities at 8.45am EST, but only for paying subscribers. Other places to find me are my page on the platform previously known as twitter, and my YouTube channel.