
On the 2nd of June I wrote a post looking at the bullish looking setup on oil, but that then fell apart in the days before the Memorandum of Understanding (MOU) was signed by President Trump at Versailles on 17th June. In the three weeks since then the Brent and West Texas Intermediate (WTIC) crudes have fallen almost to pre-war levels before the most recent low last week.
Now after any steep decline there will generally be a low found and a bounce will start that should at least retrace a sizable proportion of the preceding decline, usually in the 38.2% to 61.8% range. I’ve been watching for that bounce and I think that has now likely started, though that doesn’t mean we won’t see retests of last week’s lows as part of that process.
So what’s the setup so far?
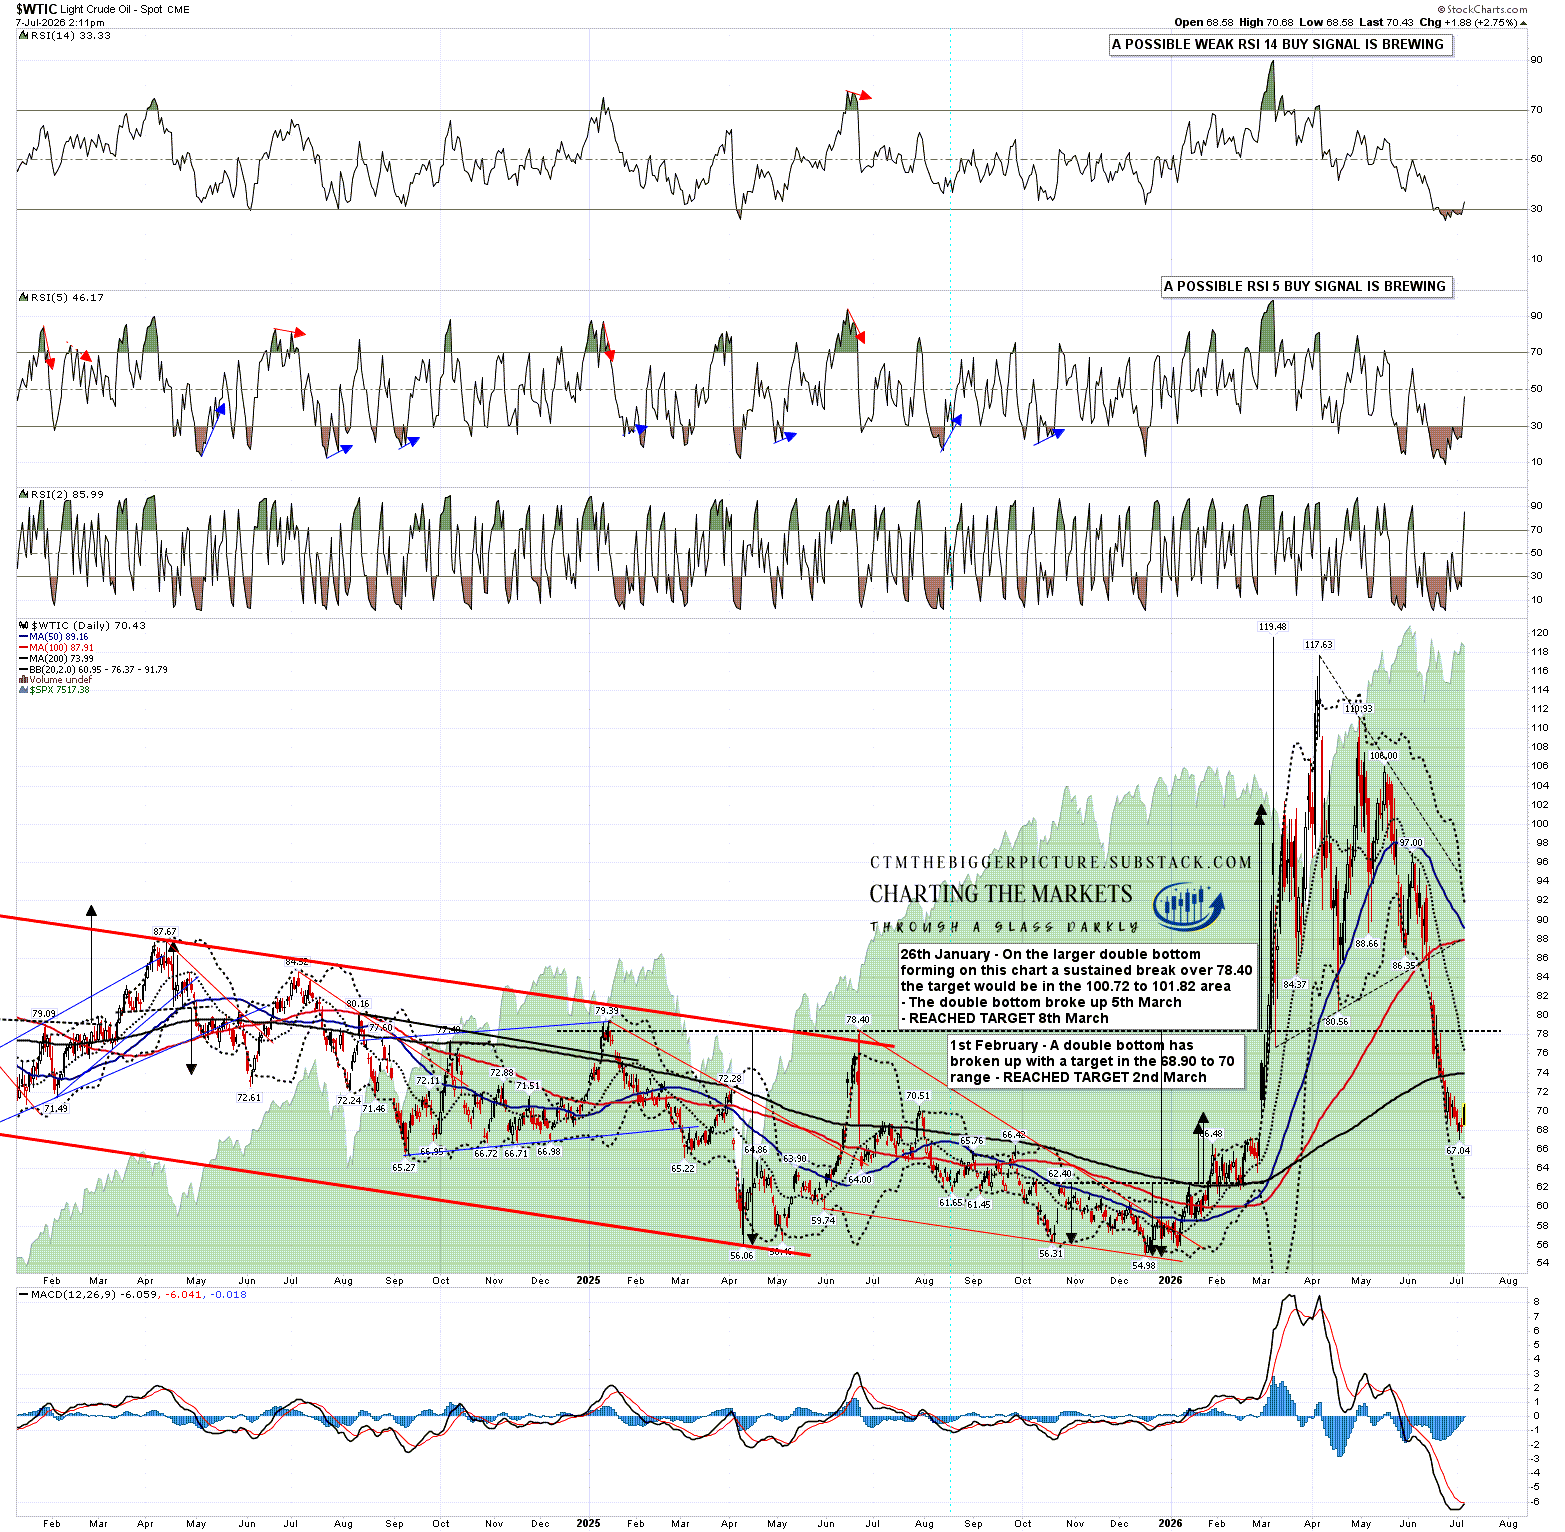
On the daily chart there are initial targets that might hold a first bounce and on WTIC those obvious resistance levels are the 200dma, currently at 74.00, and the daily middle band, currently at 76.46. Possible daily RSI 14 (weak) and RSI5 (full) buy signals are also brewing and will likely fix at the close today.
WTIC daily chart:
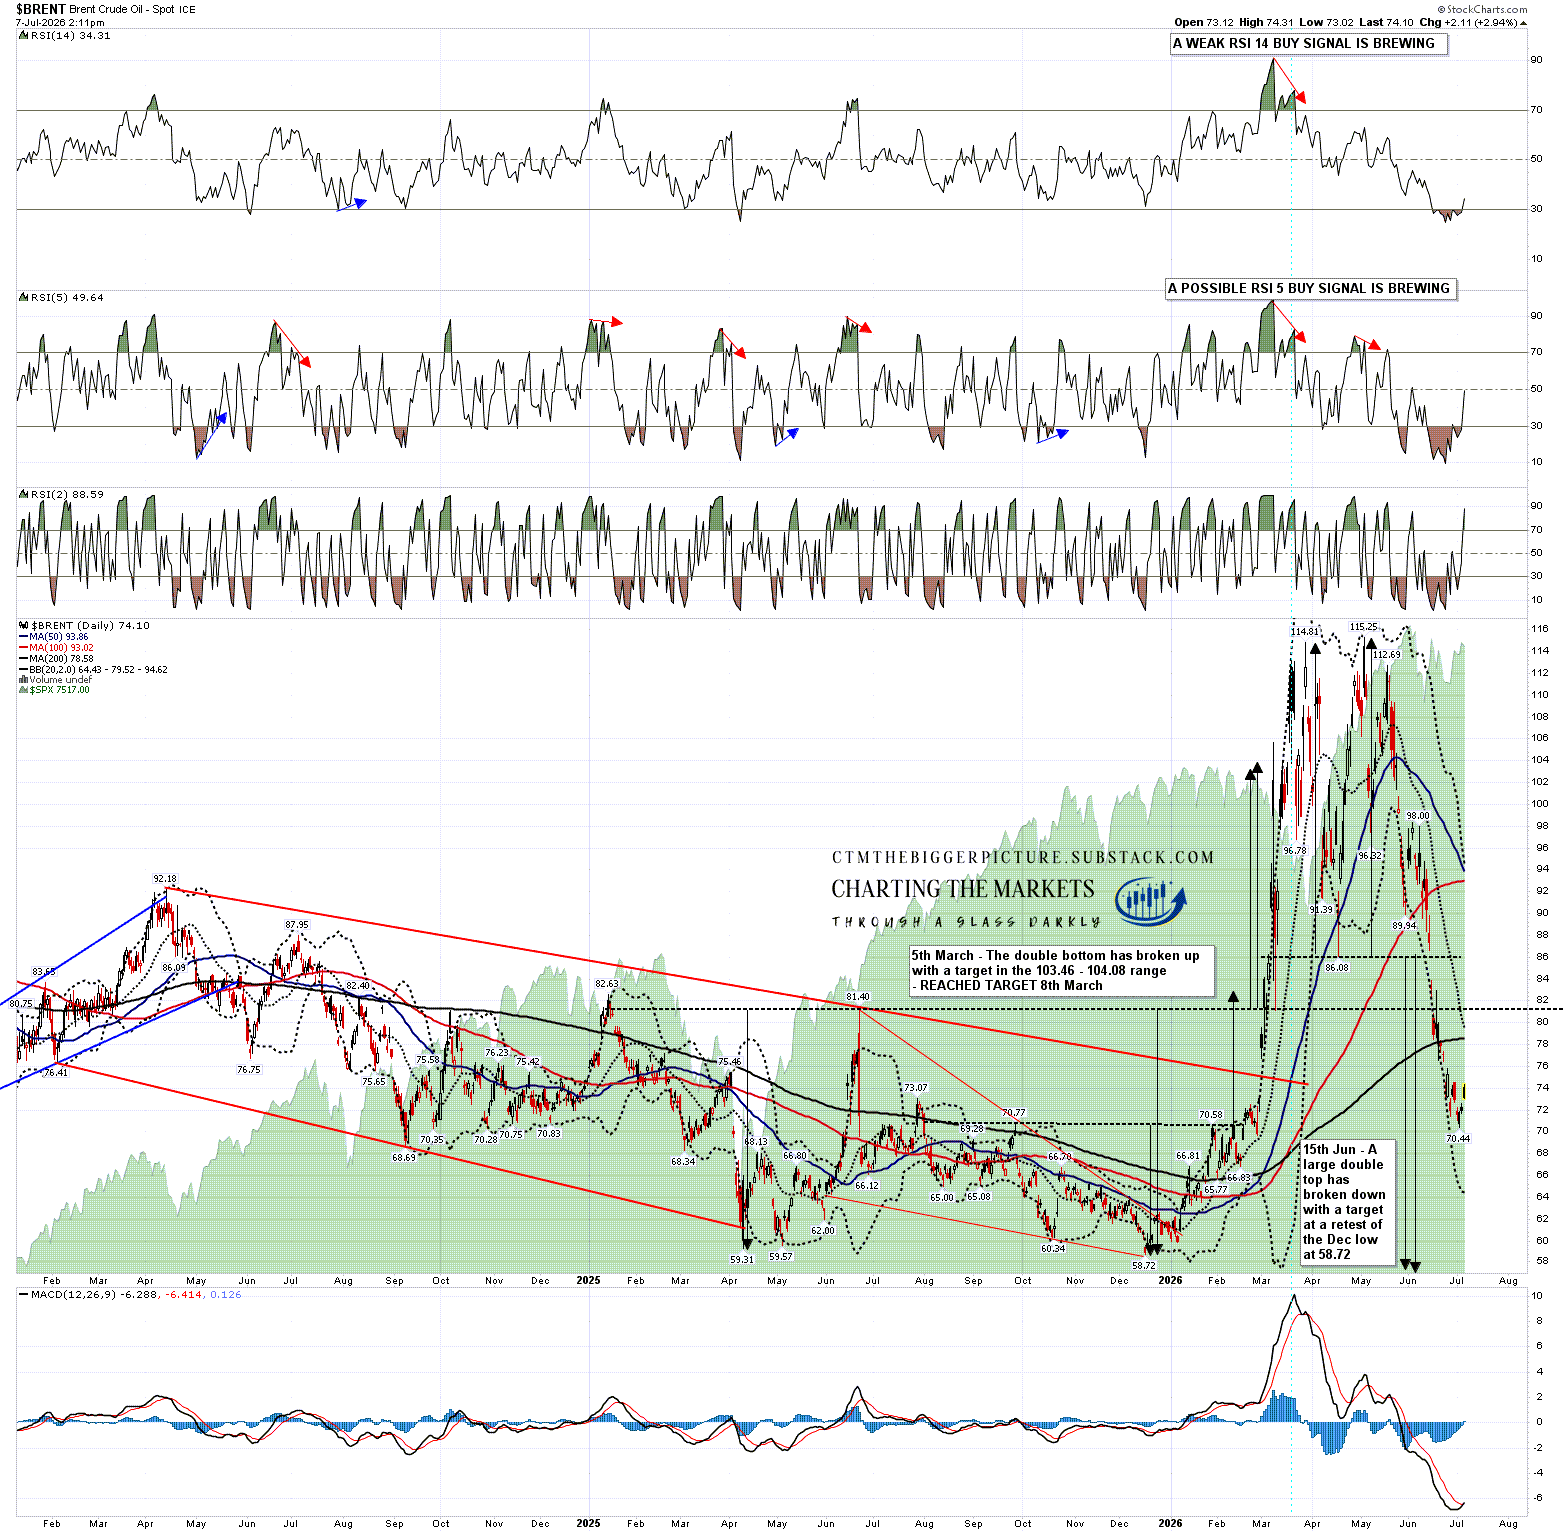
On the BRENT daily chart there are initial targets that might hold a first bounce and those obvious resistance levels are the 200dma, currently at 78.59, and the daily middle band, currently at 79.61. Possible daily RSI 14 (weak) and RSI5 (full) buy signals are also brewing and will likely fix at the close today.
BRENT daily chart:
I was looking at the short term IHS setups on Brent Crude and WTIC in my premarket video for subscribers this morning and they have both since made target and somewhat more.
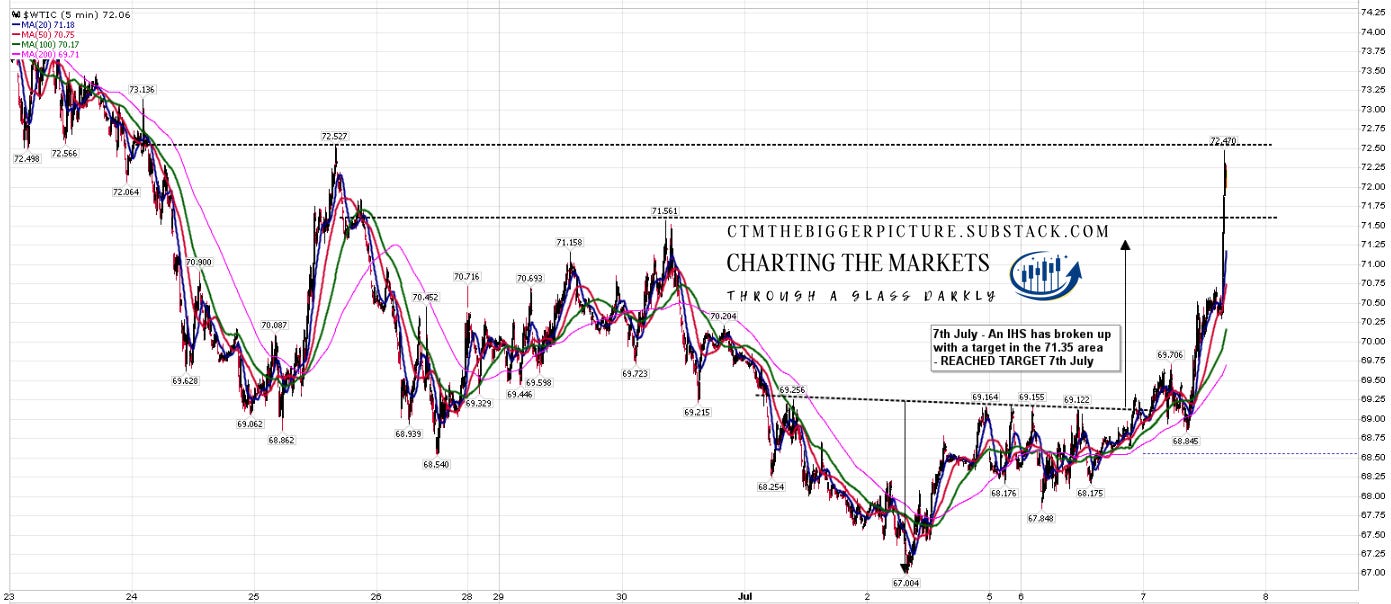
On WTIC an IHS broke up overnight with a target in the 71.35 area, and I drew in two possible larger IHS necklines at 71.56 and 72.53. At the time of writing WTIC has reached 72.47, so almost at the higher of those two. If both are broken then I’d either be looking for a larger double bottom setup involving another low retest, or the two higher possible H&S necklines in the 79 to 80 area.
WTIC 5min chart:
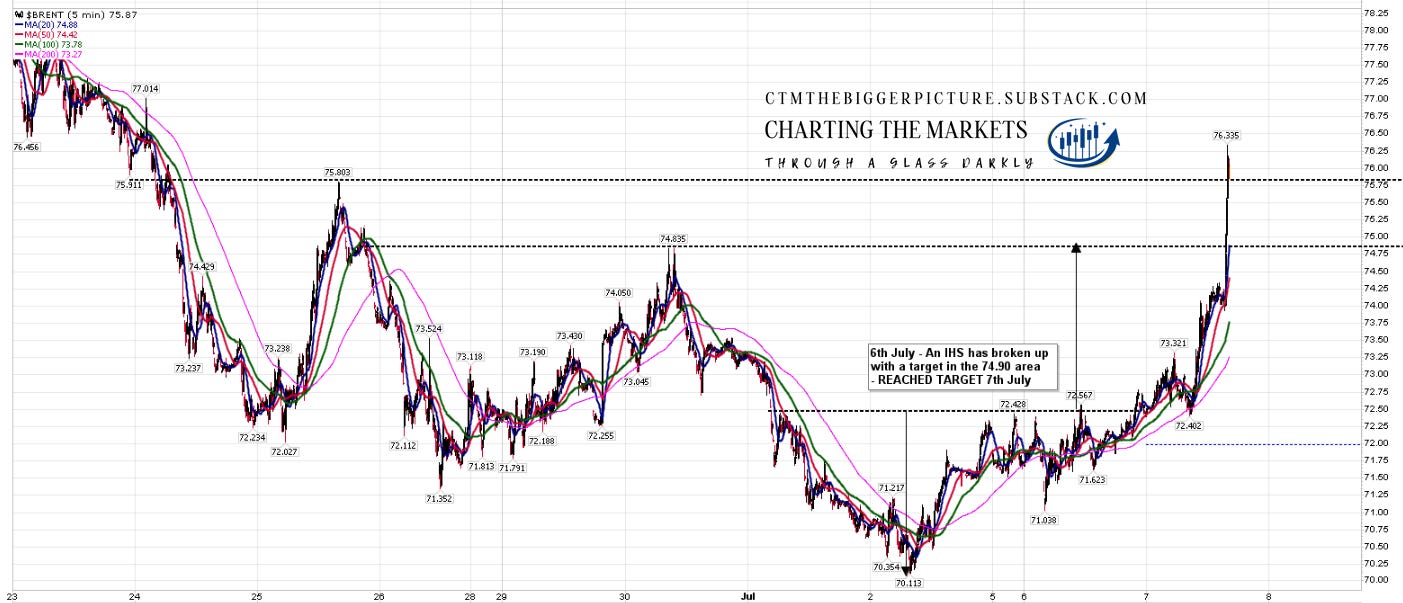
On BRENT an IHS broke up yesterday with a target in the 74.90 area, and I drew in two possible larger IHS necklines at 74.83 and 75.80. At the time of writing WTIC has reached 76.33, so above both of those but possibly still able to use the higher neckline if we see a retracement from that high. If both are broken hard then I’d either be looking for a larger double bottom setup involving another low retest, or the two higher possible H&S necklines in the 82 to 83 area.
BRENT 5min chart:
Is there much reason to think that oil might go up much further short term? Well the US has been trying to set up a route through the Strait of Hormuz independent of Iran since the MOU was signed, despite one of the explicit conditions agreed in the MOU being that the Strait would remain under Iranian control. Iran isn’t prepared to concede this point and have hit five tankers using the US route in the last 24 hours. The last time Iran started doing this on 25th June the US responded with retaliatory strikes, so we’ll see what happens in the next day or two.
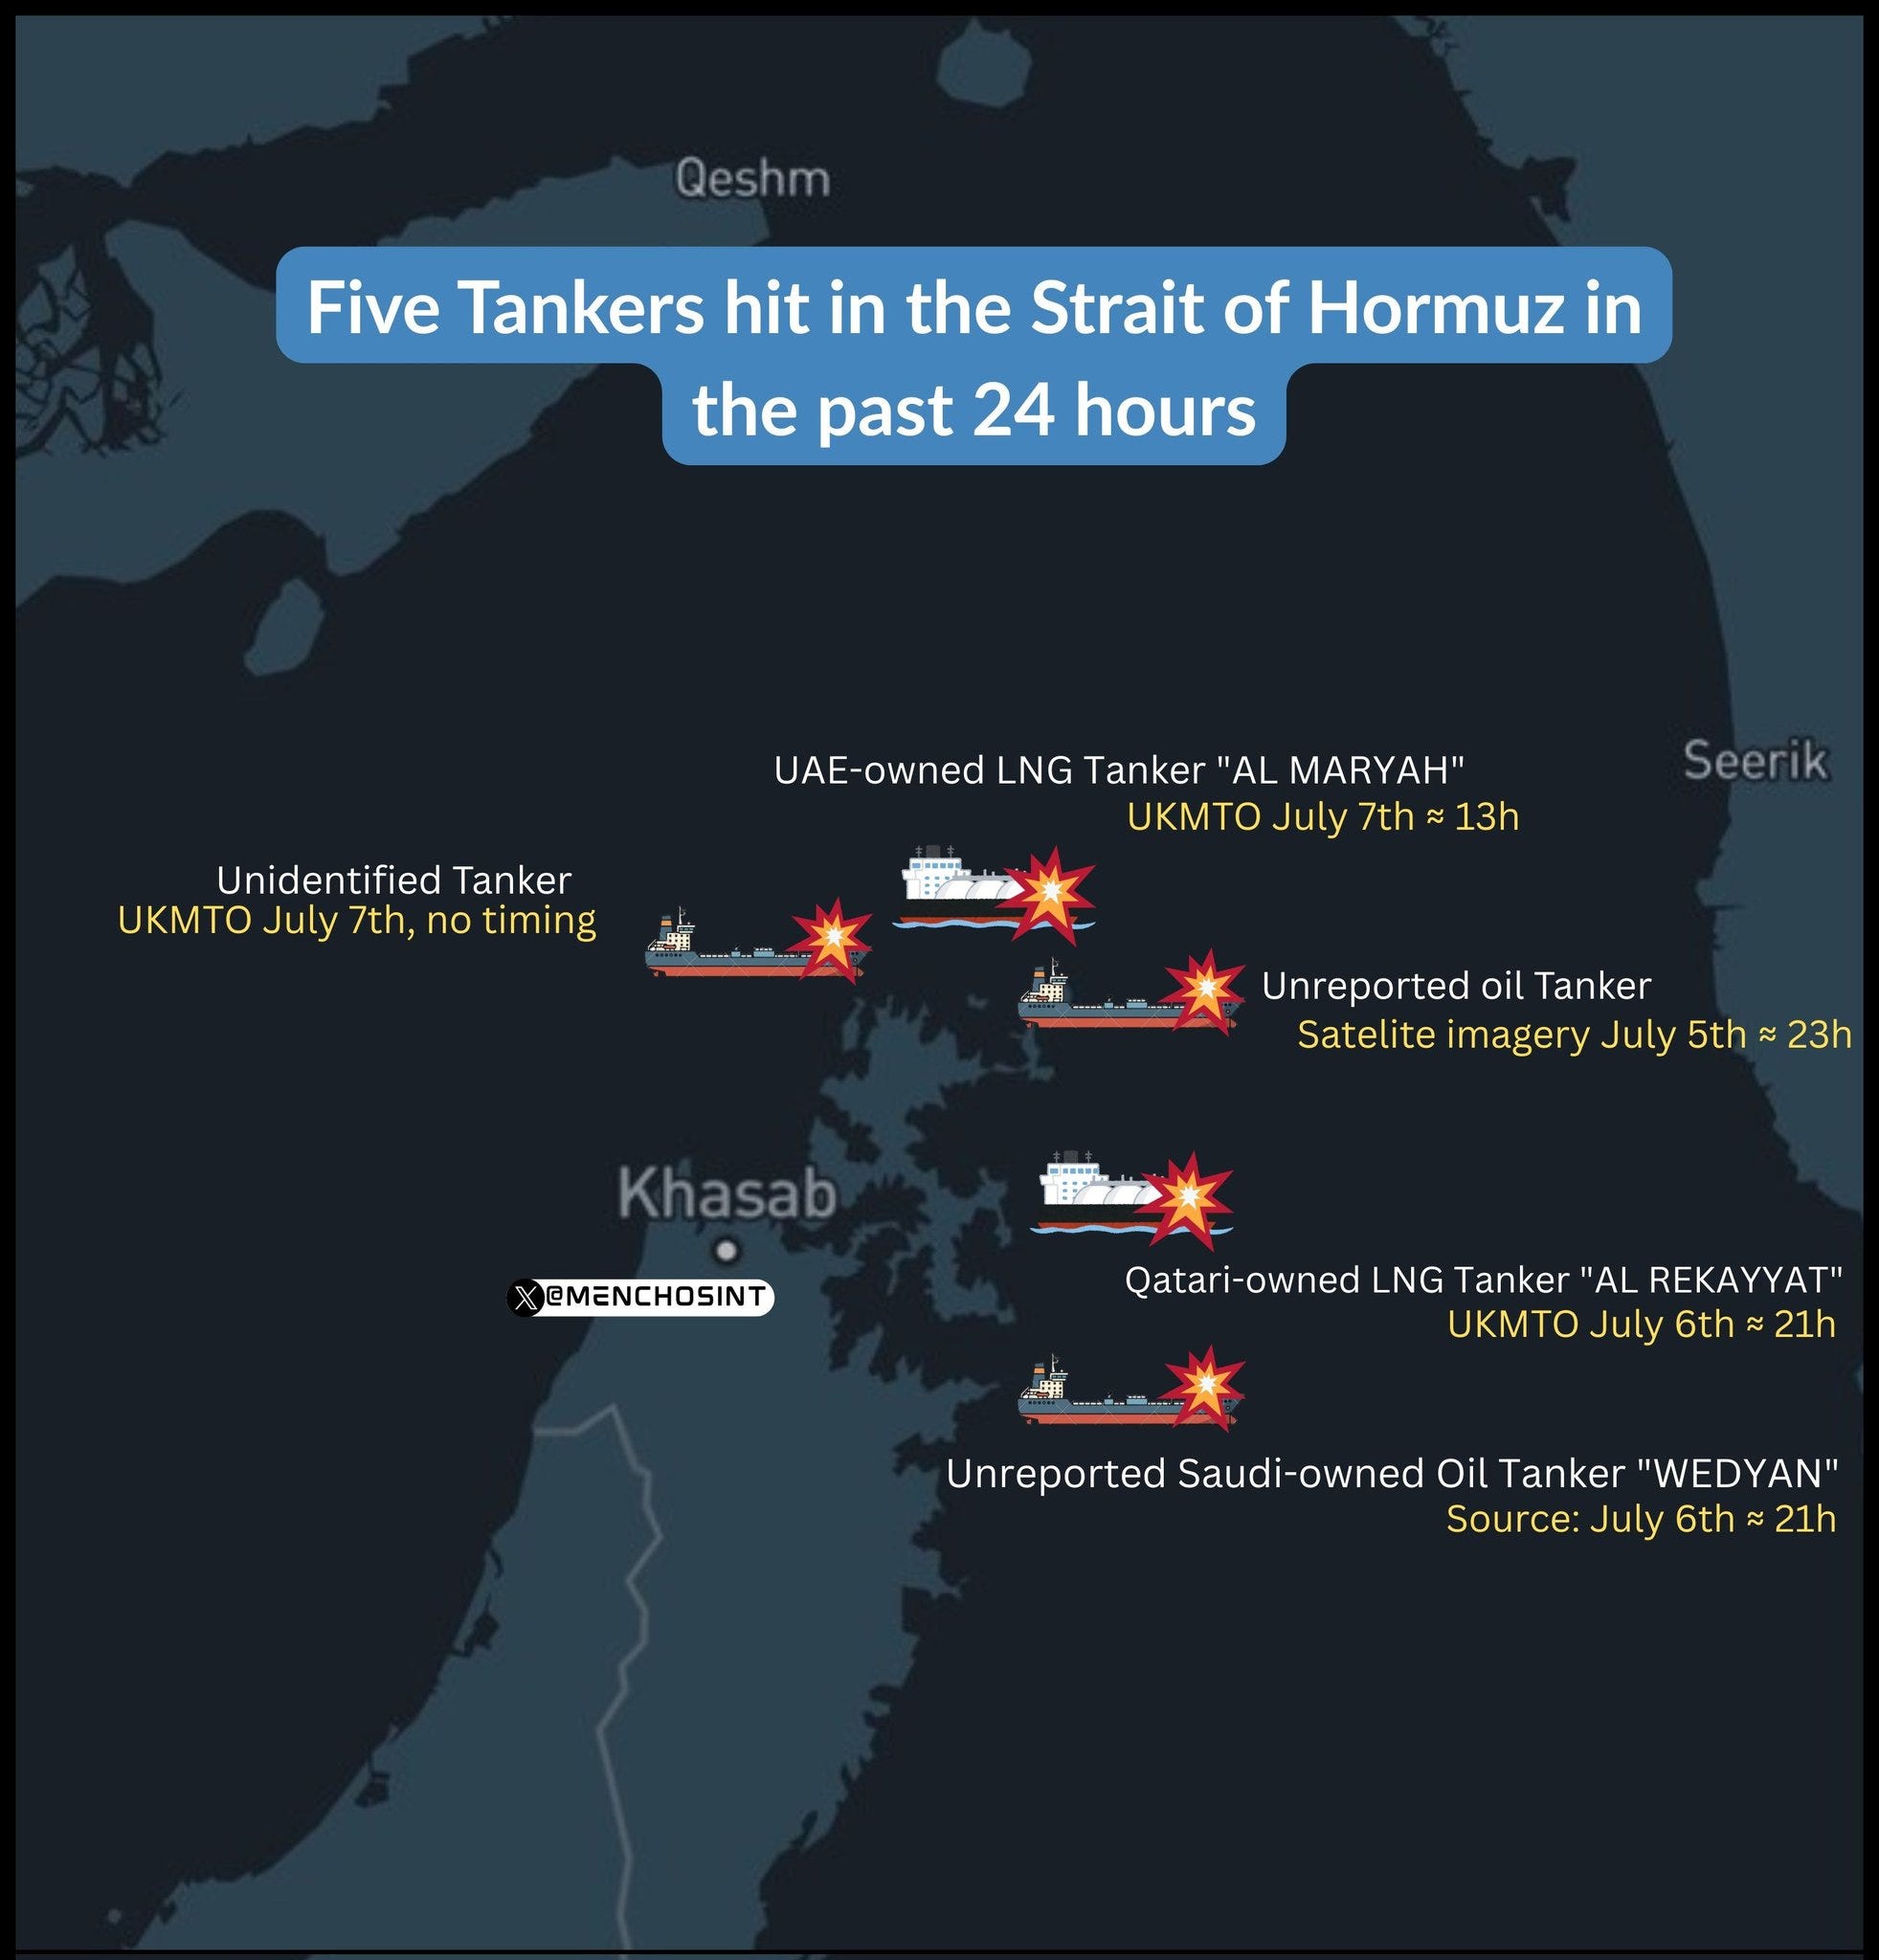
While I’ve been writing this there have been more updates:
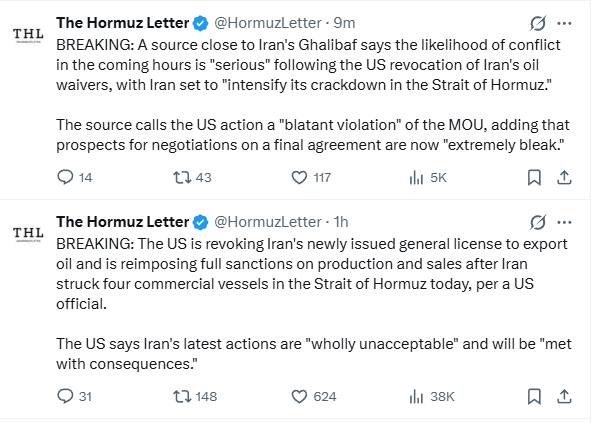
I’m going to be writing a follow up post later this week talking about where I think oil prices will be heading over the rest of the year, with an update on this short term bottoming setup.
If you like my analysis and would like to see more, please take a free subscription at my thebiggerpicture substack, where I publish these posts first and for members (from next week) also bi-weekly videos looking at equity indices, bonds, currencies and commodities. Those videos are posted on my Youtube channel after a seven day delay. Links to all my posts from my charting substacks are also always posted on my twitter.


No comments:
Post a Comment