
In my post on Monday I stated that any move to retest the highs would require the participation of Tech and said I’d do a dedicated post yesterday to explain why that is very likely the case. That has slipped a few trading hours into this morning.
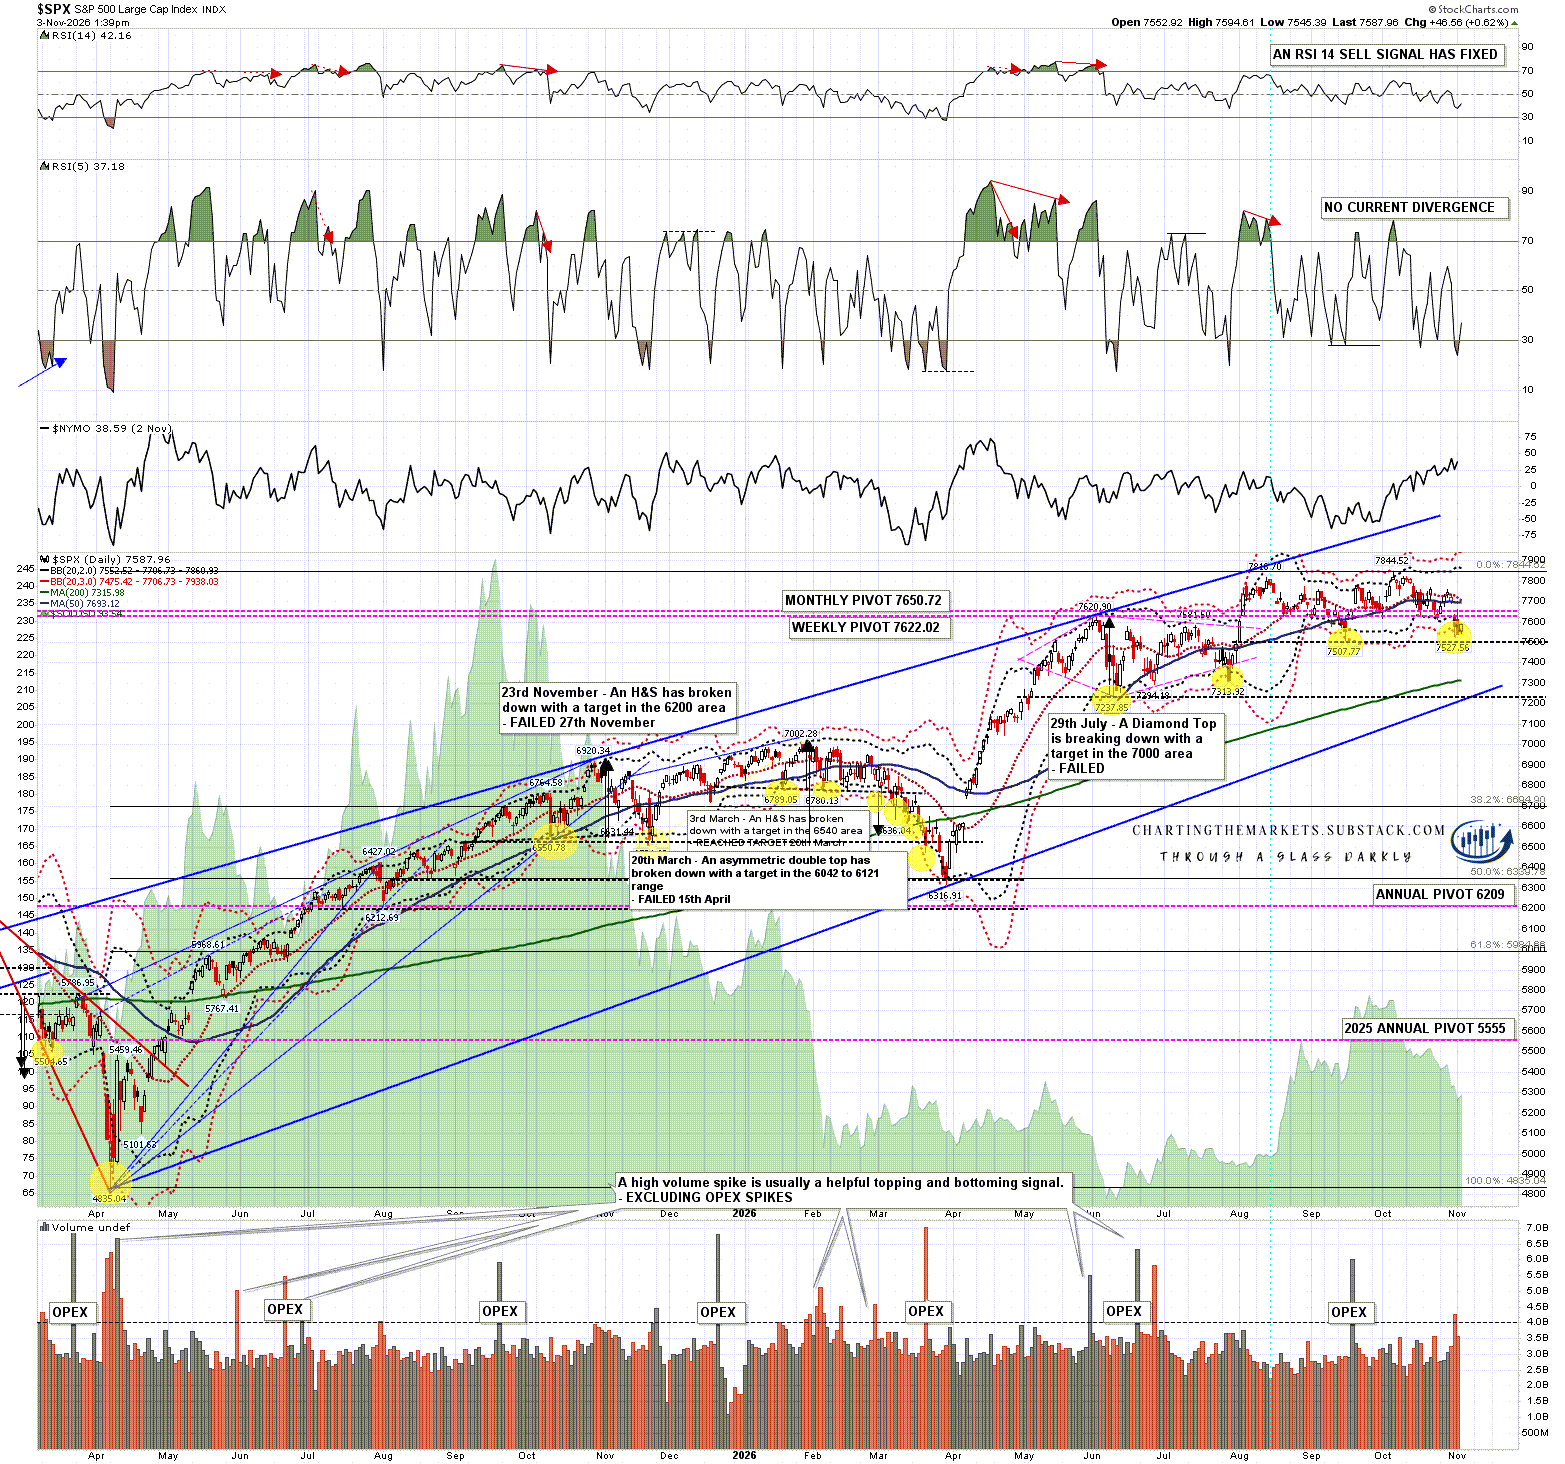
The chart below you’ve already seen if you read my post on Monday, and that is the SPX daily chart, showing a new all time high at the start of October, and then a bumpy retracement since then.
SPX daily chart:
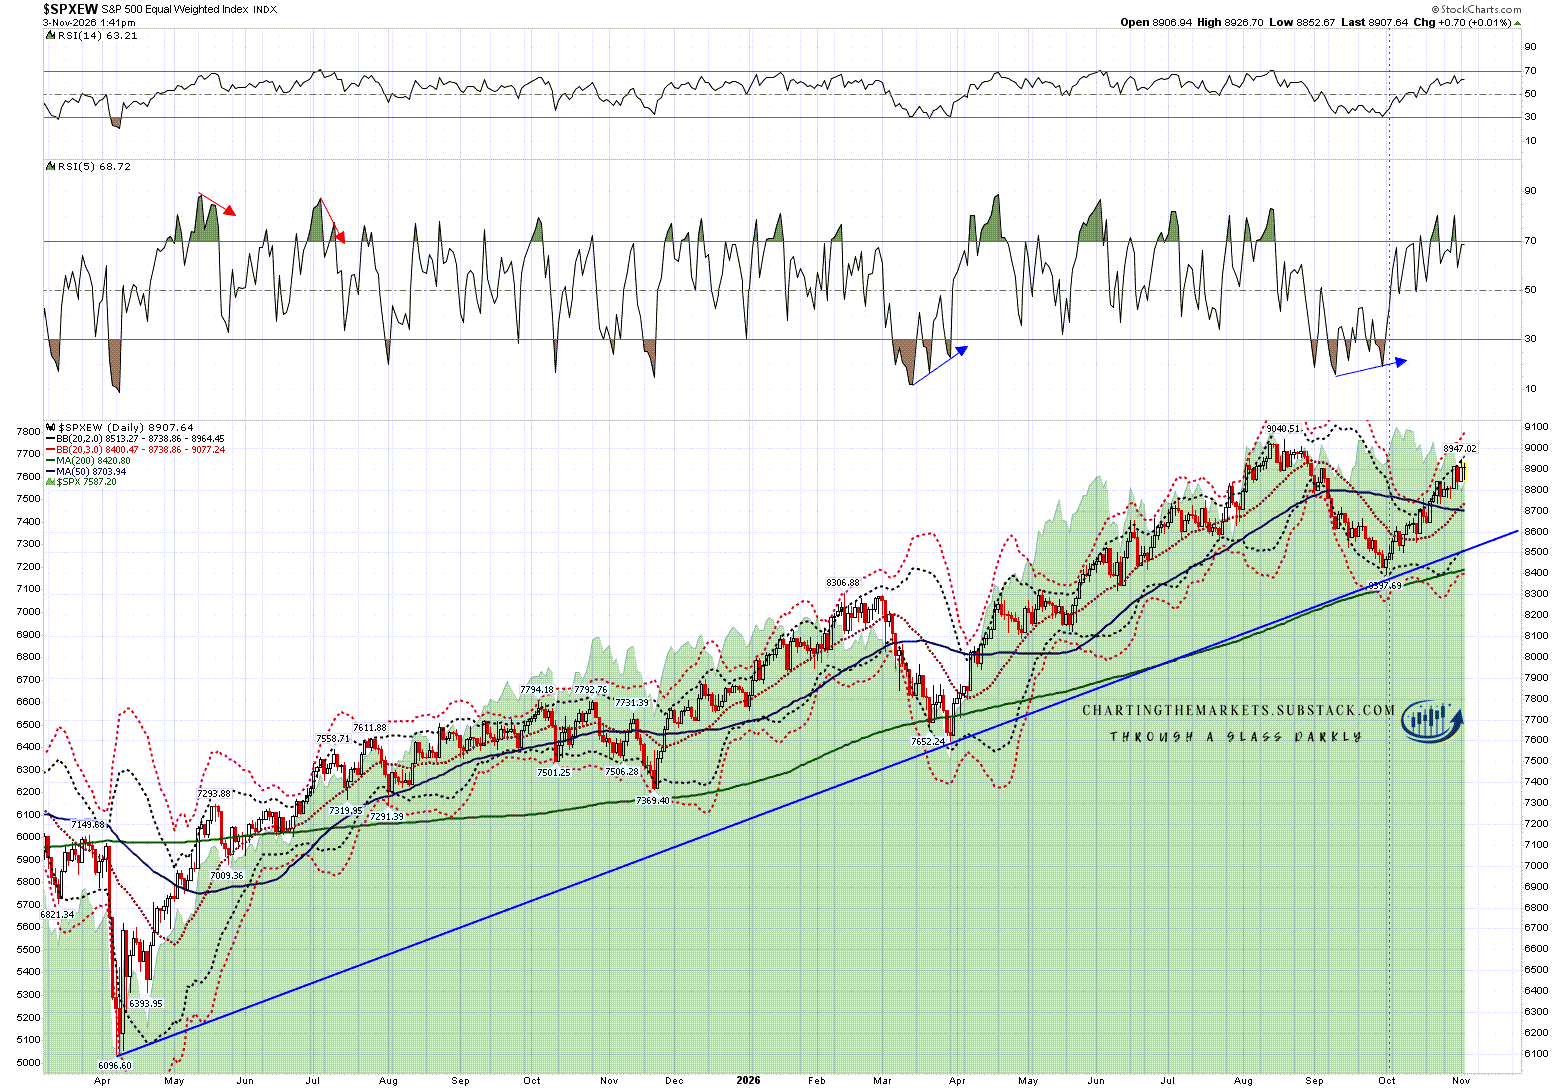
The chart below is very different, on this chart there was a significant swing low at the start of October, and a strong uptrend for the rest of the month, with the index staying close to the daily upper band for most of the rest of the month and the latest high on this move yesterday.
The chart below is $SPXEW, the version of SPX that includes all the same companies, but with them all having equal weight rather than being weighted by market cap. The difference is stark, and that difference is the relatively modest in number but very heavily weighted Tech component in SPX.
According to quant500.com as of Monday there were 86 Tech companies in SPX, accounting for 36.2% of the index by market cap, though it seems likely that the weight in the index was in the 40% to 45% range before recent declines, given that QQQ is down over 10% since the ATH at the start of October, and SOX is down about 30% since the ATH in June.
Either way it seems that over 80% of SPX companies were in an overall strong uptrend since the start of October, but the downtrend in Tech was enough to drag the whole index into a significant downtrend for the month.
SPXEW daily chart:
DIA has a Tech component too, with six Tech companies out of the total of 30, weighted today at 18.6% of the index by market cap. That too made a significant low at the start of October and was in a strong uptrend over most of October, but was dragged down towards the end as GOOG fell 20%, CSCO fell 15%, AAPL, AMZN & NVDA dropped 10% and MSFT dropped 6%. That was enough to drag the whole of the Dow 30 down over 3% over the last ten days of October against the 2% or so the overall index actually dropped over the period. Excluding Tech, DIA was also in a strong uptrend through October.
DIA daily chart:
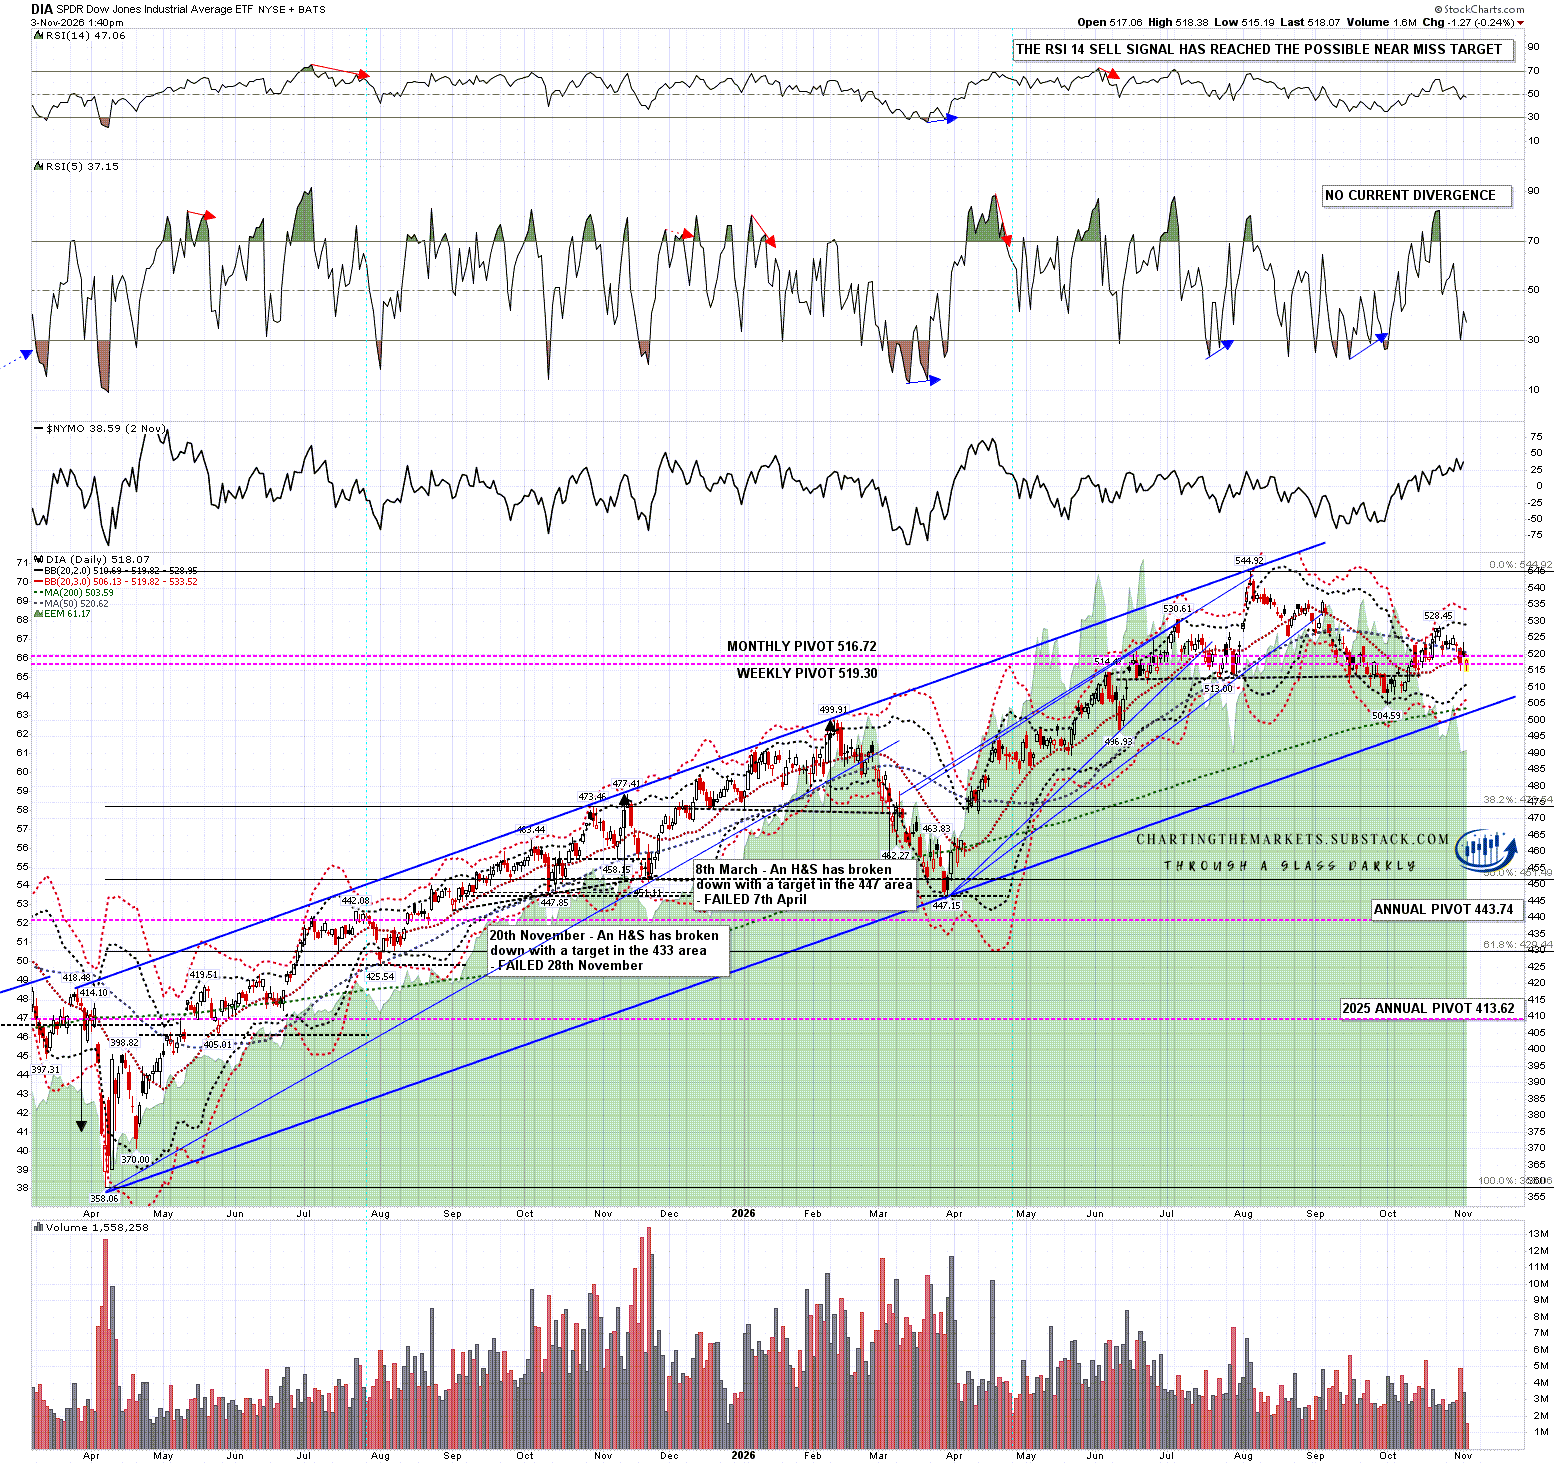
Tech is the elephant in this index room, and if Tech hadn’t dropped hard from the high at the start of October, both SPX and DIA would have had a strongly bullish month. That is the reason that I said that if we are going to see US indices follow the rest of the historical stats up into the end of the year, Tech will have to lead or at least join that move.
How likely is that? Well there are some signs that Tech could turn back up here.
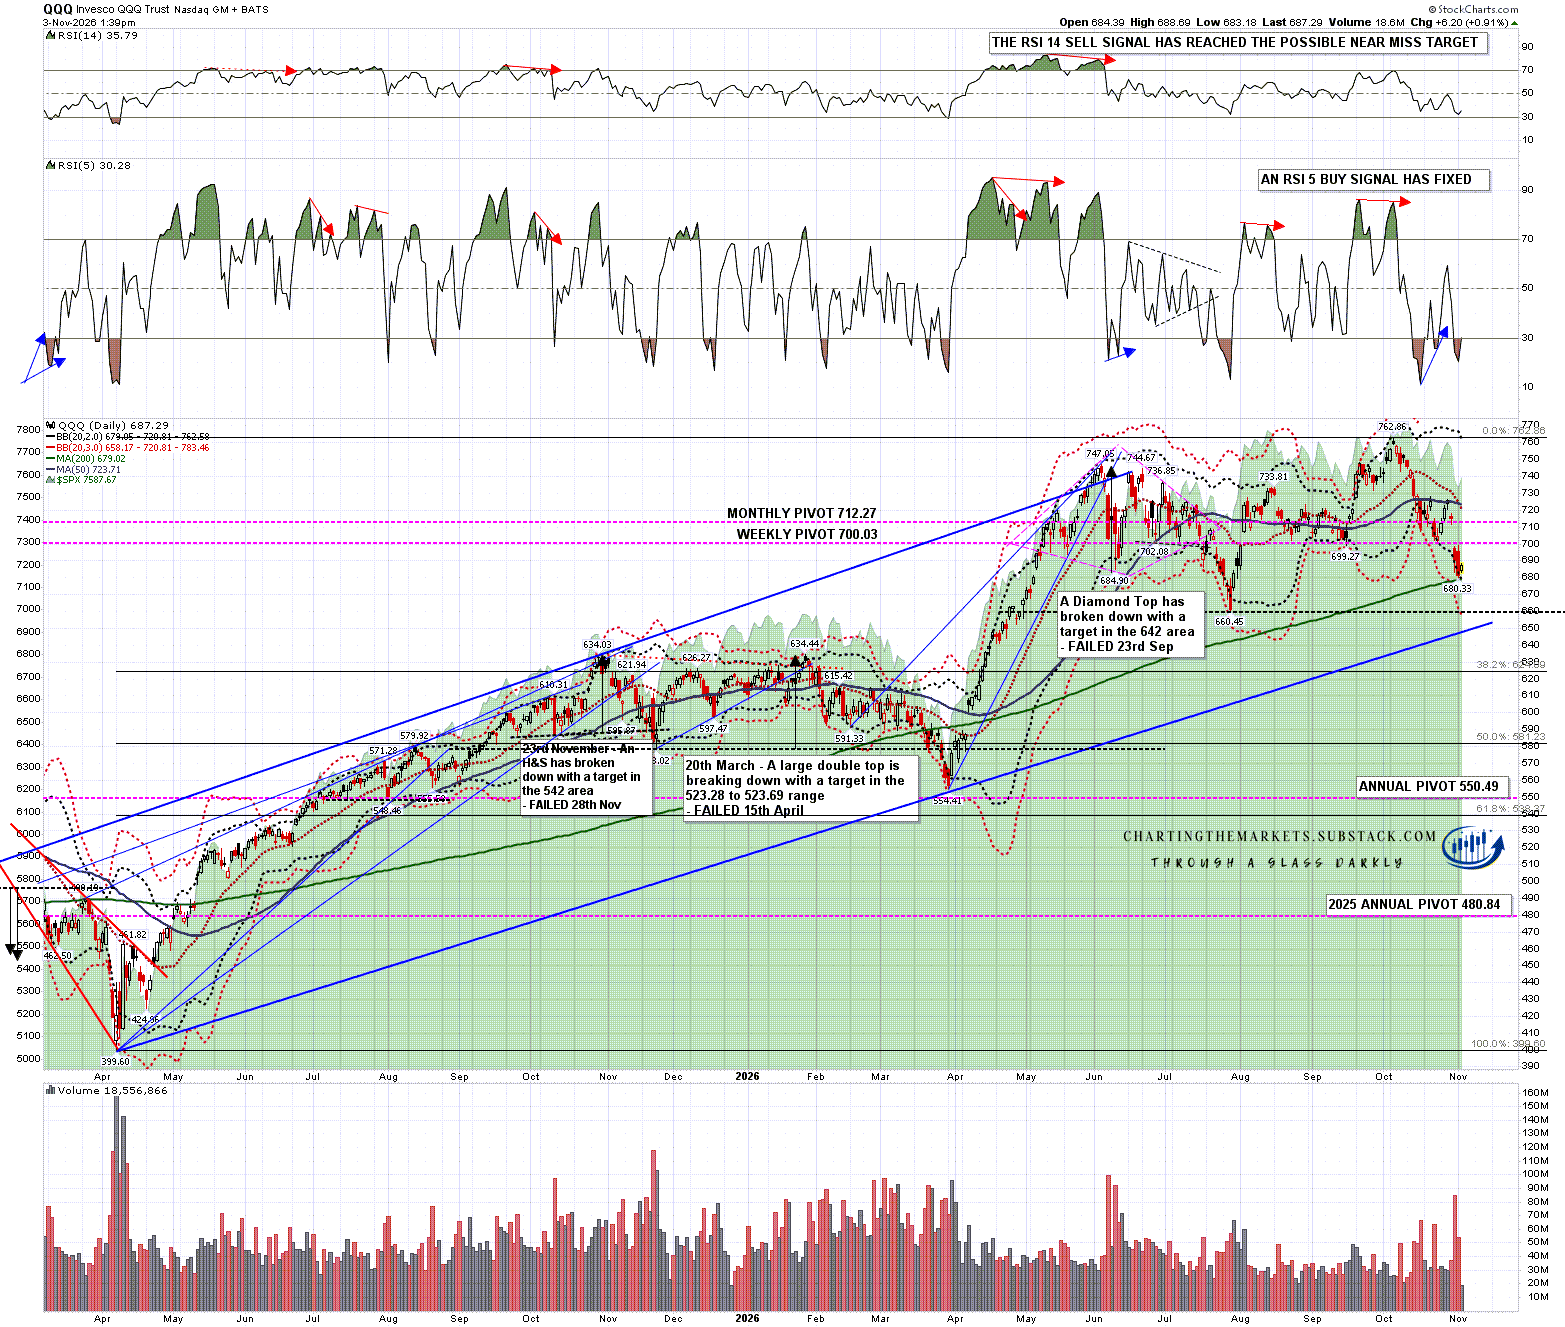
On QQQ a daily RSI 5 buy signal fixed last week and these historically perform well. As I write a possible hourly RSI 14 is brewing and, if it fixes, those also tend to perform well. QQQ was testing the 200dma at the lows so far this week and that is an important level that often holds as support or resistance.
QQQ daily chart:
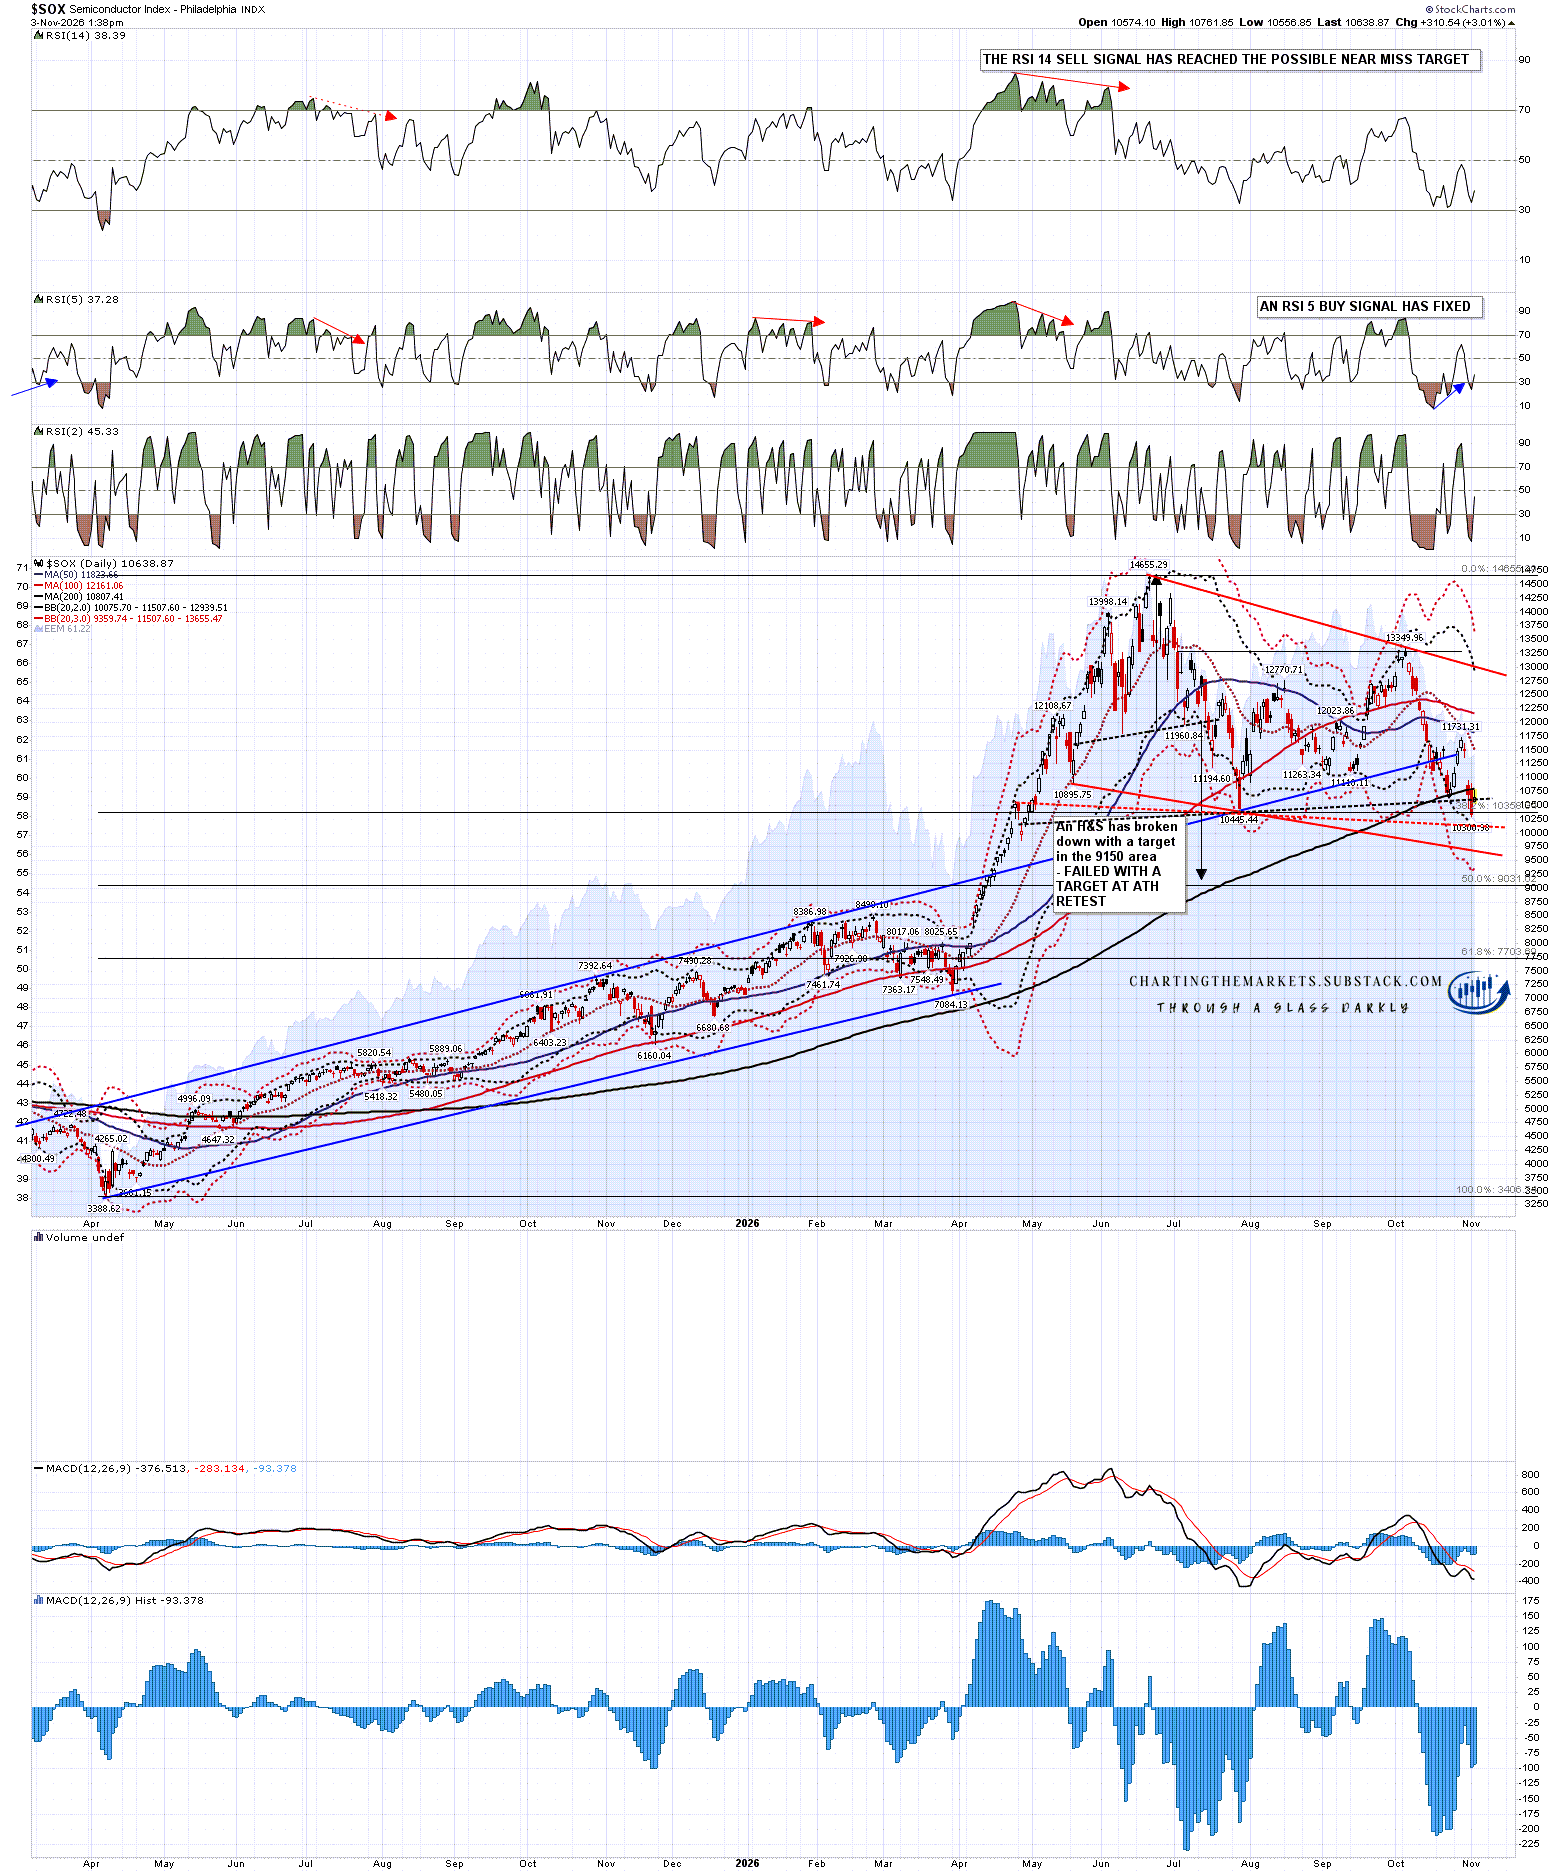
There is also a daily RSI 5 buy signal fixed on the Philadelphia Semiconductor Index (SOX), though as with the one on QQQ the index has fallen significantly since that buy signal fixed. There is also an hourly RSI 14 buy signal that fixed yesterday. SOX has now fallen an eye-watering 30% or so high to low since the high in June and is still testing a decent support level between 10,000 and 10,500.
There was an H&S that had broken down on SOX with a target in the 9150 area that I posted a few times in December and that failed at the start of October with a target at a retest of the all time high. That target isn’t always made but usually delivers.
If it is going to deliver here then the current pattern forming from the June high would likely be a bull flag and I have drawn in a couple of flag support trendline options. Neither of those has been reached yet but the lower low below the July low at 10,445.44 on Monday is encouraging for this being a bull flag. If it is a bull flag I would expect the next significant low soon. If it isn’t a bull flag then I’d note that I see almost no support between 10,000 down to 8,500.
SOX daily chart:
There is a lot of talk here that Tech is in an AI bubble, which I agree with, and that the AI bubble has now popped, which I am doubtful about, but could be the case. If the AI bubble has popped then the aftermath could easily drag SPX down 50% all time high high to low as the air comes out of the bubble.
As for the bubble I’m planning another post this week explaining why I believe that AI is a speculative bubble, though that post might get bumped into next week if the rest of the week on SPX is particularly interesting.
In terms of whether that AI bubble has popped I’m keeping an open mind, though I’d note that while identifying likely bubbles is fairly easy, identifying when that bubble is bursting is notoriously hard. The patterns on the individual Tech AI players don’t look that encouraging as yet, and the topping process can take a few months to a couple of years. We’ll see.
If you like my analysis and would like to see more, please take a free subscription at my chartingthemarkets substack, where I publish these posts first. I also do a premarket video every day on equity indices, bonds, currencies, energies, precious commodities and other commodities at 8.45am EST, but only for paying subscribers. Other places to find me are my page on the platform previously known as twitter, and my YouTube channel.


No comments:
Post a Comment