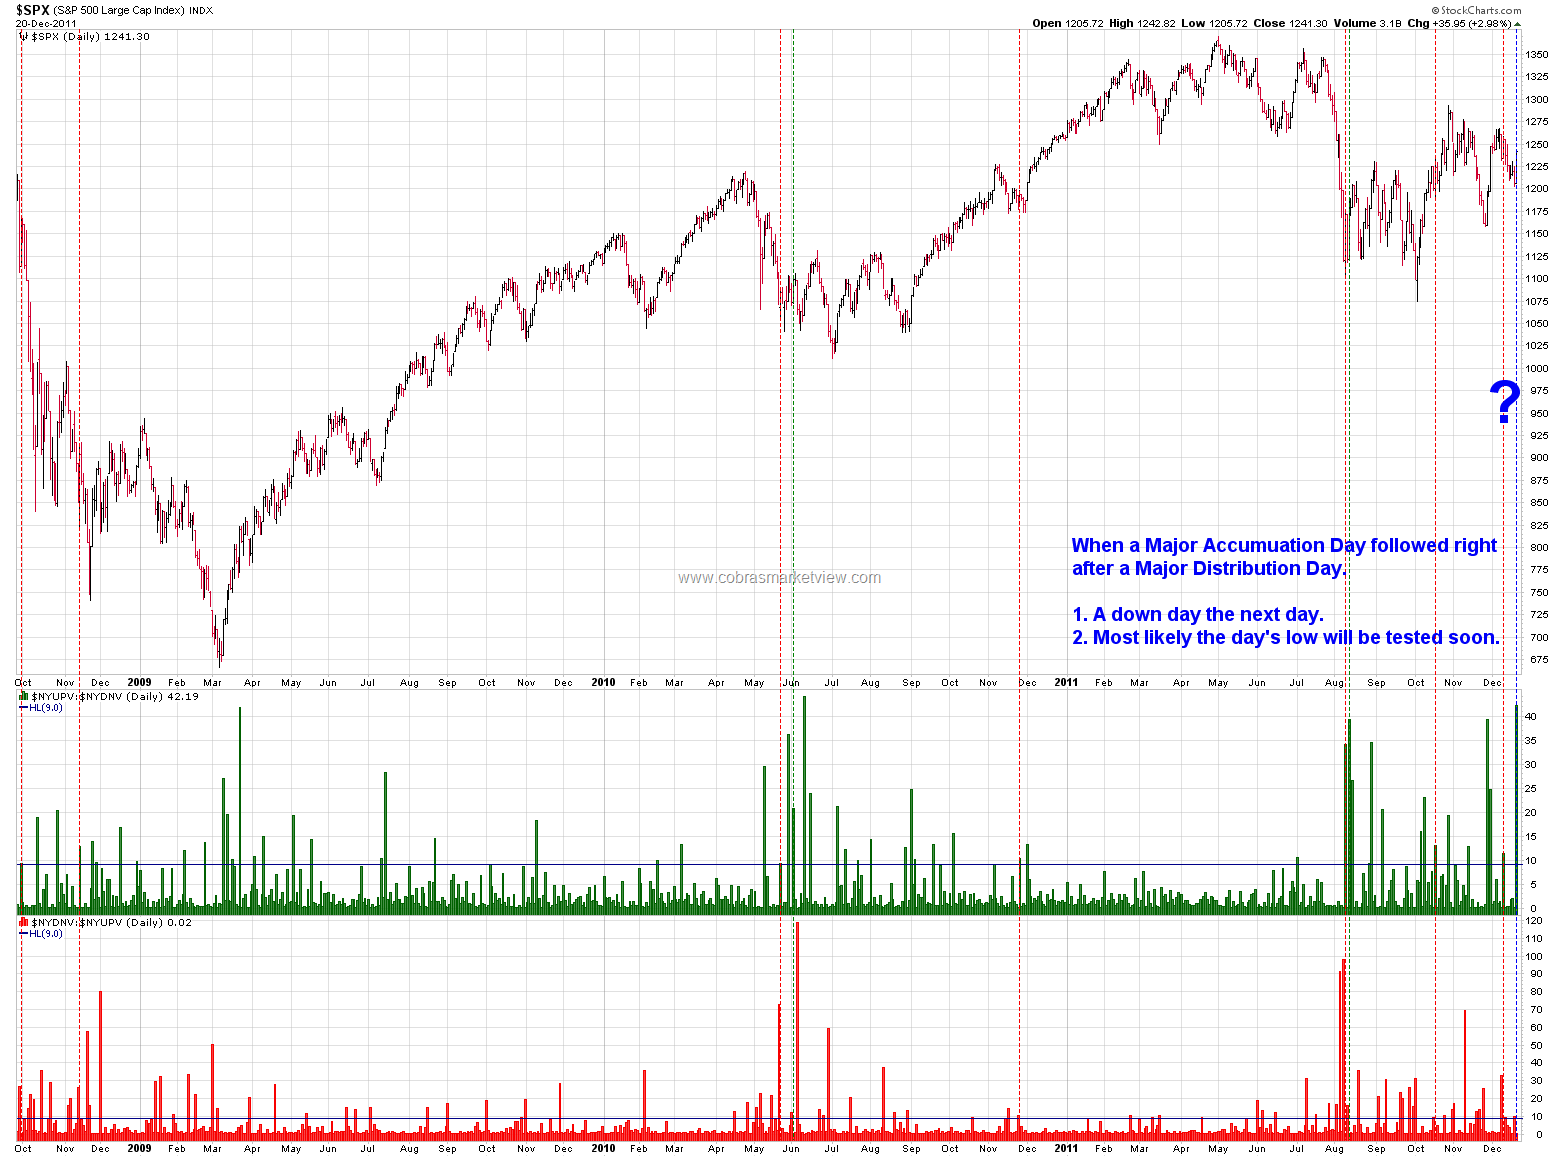
Well that was a face-ripper rally yesterday, and it isn't that often that you see a major distribution day followed by a major accumulation day. We do see that often enough however to compile statistics on performance afterwards, and as my friend
Cobra points out, the chances of a down day today are very high. Here's Cobra's chart on this from last night below, and you can see his full post
here:
There is an obvious target for this move down on ES, and that target is 1225, for a retest of the double-bottom base / neckline that broke yesterday and a hit of rising support from the low. That prediction looked bolder as I capped the chart earlier, but as I write this I see that ES is now at 1230.5, so 1225 isn't far away now. After today I'm expecting ES to make, or at least get close to, the double-bottom target at 1255 ES that I gave yesterday:

I'm qualifying that target slightly because the obvious first big upside resistance here on SPX is slightly lower than that ES target. That upside resistance is the zone between 1257 SPX, which is the break-even level for SPX in 2011, and the 1260 area, which is strong declining resistance from the July high on SPX. If that breaks, which I think it might, then the next resistance area is at main declining resistance from the 2011 high in the 1310-15 area. This chart has a lot of information on it so it's worth having a closer look. I have also mentioned the big sloping IHS that a lot of analysts have been talking about. I've been watching it too, but it would not be a reversal IHS, so the upside target (new highs) isn't high probability:
That SPX trendline is the first big trendline to look at today. The second is rising wedge support on UUP, the dollar bullish ETF, which was tested yesterday and would look very significant on a break down:
If we saw that break down on UUP then a break up through declining resistance on EURUSD shouldn't be far behind. That wasn't quite reached overnight:
Supporting those breaks would be the beautifully classical double-bottom I posted on GBPUSD yesterday. That hasn't broken the pattern base or neckline yet, but would target a big move back to 1.613 if it does:
I post charts on ZB, 30yr Treasury futures very regularly here, but I don't often post charts for ZB's little brother ZN, 10yr Treasury futures. I posted one of those on twitter yesterday after a trading buddy of mine, George Cavaligos of
www.nakedtrader.com suggested I have a look at it. Here is that chart I posted yesterday:
Here is the updated chart, and you can see that the rising wedge has broken, and that main rising support has been pinocchioed overnight. I think that rising support from the October low is going to break in the next few days and I have put the downside targets after that break on the chart. If I'm right then that should support a move on SPX back up into the 1300-20 area over the next two or three weeks:
So far, so bullish, but there is a potential fly in the ointment here for the bulls and that is the Vix chart. I was commenting yesterday that the Vix setup was one that I would associate with an equities high rather than an equities low. That is even more the case today and if we see equities move up much further, then we may see Vix close below the daily bollinger bands. That would be a huge red flag warning of a very significant high then or shortly afterwards:
Overall I'm expecting to see some retracement today followed by a powerful move up for the rest of the week as this belated Santa Rally shows us what it can do.


No comments:
Post a Comment