There's a nice looking reversal setup on ES at the moment, with some positive divergence on the 60min RSI, and a little IHS that has formed overnight. I have the IHS target at 1230 and declining resistance on ES at 1230.75 at the moment. A nice setup that might play out:
That would be a short term reversal I think. On SPY I'm looking at the gap that is trying to fill at the moment and rising support from the October low just under that. That rising support from October is the likely downside target here I think. Any lower and Santa might not deliver a rally this year:
On 30yr treasury futures (ZB) the spike yesterday trashed the potential H&S that has been forming for weeks. Declining resistance from the September highs was also taken out and ZB is close to retesting the November high. I have a small rising wedge on ZB at the moment though it doesn't look particularly tradeable:
On oil futures many shorts will have been stopped out by the spike the other day when Iran closed the Straits of Hormuz. After that CL fell to 95 as expected, and on a conviction break there the double-top target would be in the 86.65 area:
I posted charts on gold and silver on Tuesday morning, and the scenario I outlined then is playing out nicely. It was pointed out to me last night however that I had left out an important support level on gold, so I've charted that today. That level is at rising support from the 2008 low, and I have that in the 1540 area at the moment. I'm expecting that to break, but I might be mistaken, and we may see a bounce there in any case:
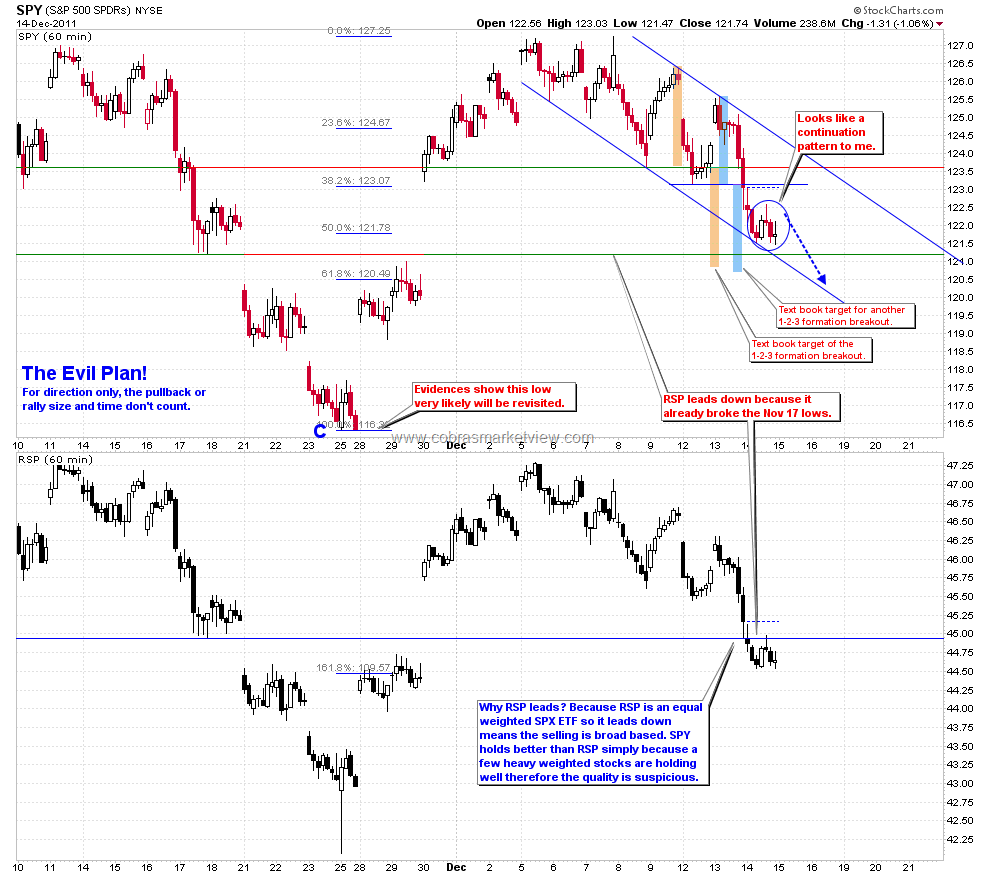
One blog I check every day and mention often is Cobra's excellent blog
here. Something I'd like to mention today is that Cobra is taking his blog subscription only soon, and is currently offering membership at $10 per month to anyone who signs up now. After he converts to sub only that rate will be going up to $30 per month or more so if, like me, you want to continue reading his daily write-ups at an annual price that would be repaid by one small scalp trade, you should consider signing up now. The next chart is the great chart he posted last night comparing SPY with RSP (equal weight SPX ETF). Cobra's making the case that more downside looks likely, and that looks likely to me as well unless ES can break declining resistance in the 1230 area here:

I'm leaning towards seeing a test of that declining resistance on ES to start with today, but unless that breaks with conviction I'd expect new lows shortly tomorrow or Monday while SPY fills that gap above rising support from the October low. I wouldn't put too much faith in the declining support trendline on my ES chart. It's the third three-touch trendline I've used on ES so far this week, and the pinocchio through it at the overnight low suggests that this one might not hold either.


No comments:
Post a Comment