
There were four big setups, each covering multiple tickers, that I was looking in my bi-weekly The Bigger Picture webinars last year and at the start of this year that looked very strong, but I was struggling to come up with any decent fundamental reasons why they might play out.
That changed when the US attacked Iran on 28th February, and since then I have been looking at these four big setups as follows:
War - I looked at the oil setups in my posts on 3rd and 13th March. Those setups have made the first targets but haven’t yet made the extension targets at retests of the 2022 highs on $BRENT, $WTIC and $GASO.
Pestilence - In my last The Four Horsemen post on Friday 27th March I was looking at the US Dollar, and that hasn’t changed much since as we are currently waiting to see if attempts to end the Iran War might be successful.
Famine - Today I am looking at the third series of setups, on $COTTON, $WHEAT, $CORN, and $SOYB.
Death - This will be the next and last in this series looking at bonds, and will give a preview of what might happen if the current US experiment in ever rising deficits and debt ends really really badly.
In term of the current ceasefire and the Strait of Hormuz almost everything about the ceasefire is obscured by a fog of confusion, but what does seem clear is that the Strait of Hormuz remains under Iranian control, that when it is open at all they are charging a stiff toll on all vessels passing through the Strait, and are insisting on payment in either Yuan or Cryptocurrency. In case you were wondering, they are welcoming payment in Trump Coins:

The main focus on the trade disruptions from the Iran War has been on oil, but there are other important goods which have been severely disrupted including Liquefied Natural Gas (LNG), Helium (vital for semiconductor manufacturing), and fertiliser, as the Persian Gulf is a very large source of Urea. It is the fertiliser disruption that concerns us today.
That disruption has been serious, prices are well up and there are serious shortages and price spikes that have already had a serious impact on the Spring planting season for both Wheat and Corn. Enough disruption may already have been caused to deliver the squeeze in supply that I am looking at in the charts below, and all four of the crops I am looking at below use a lot of these disrupted fertilisers.
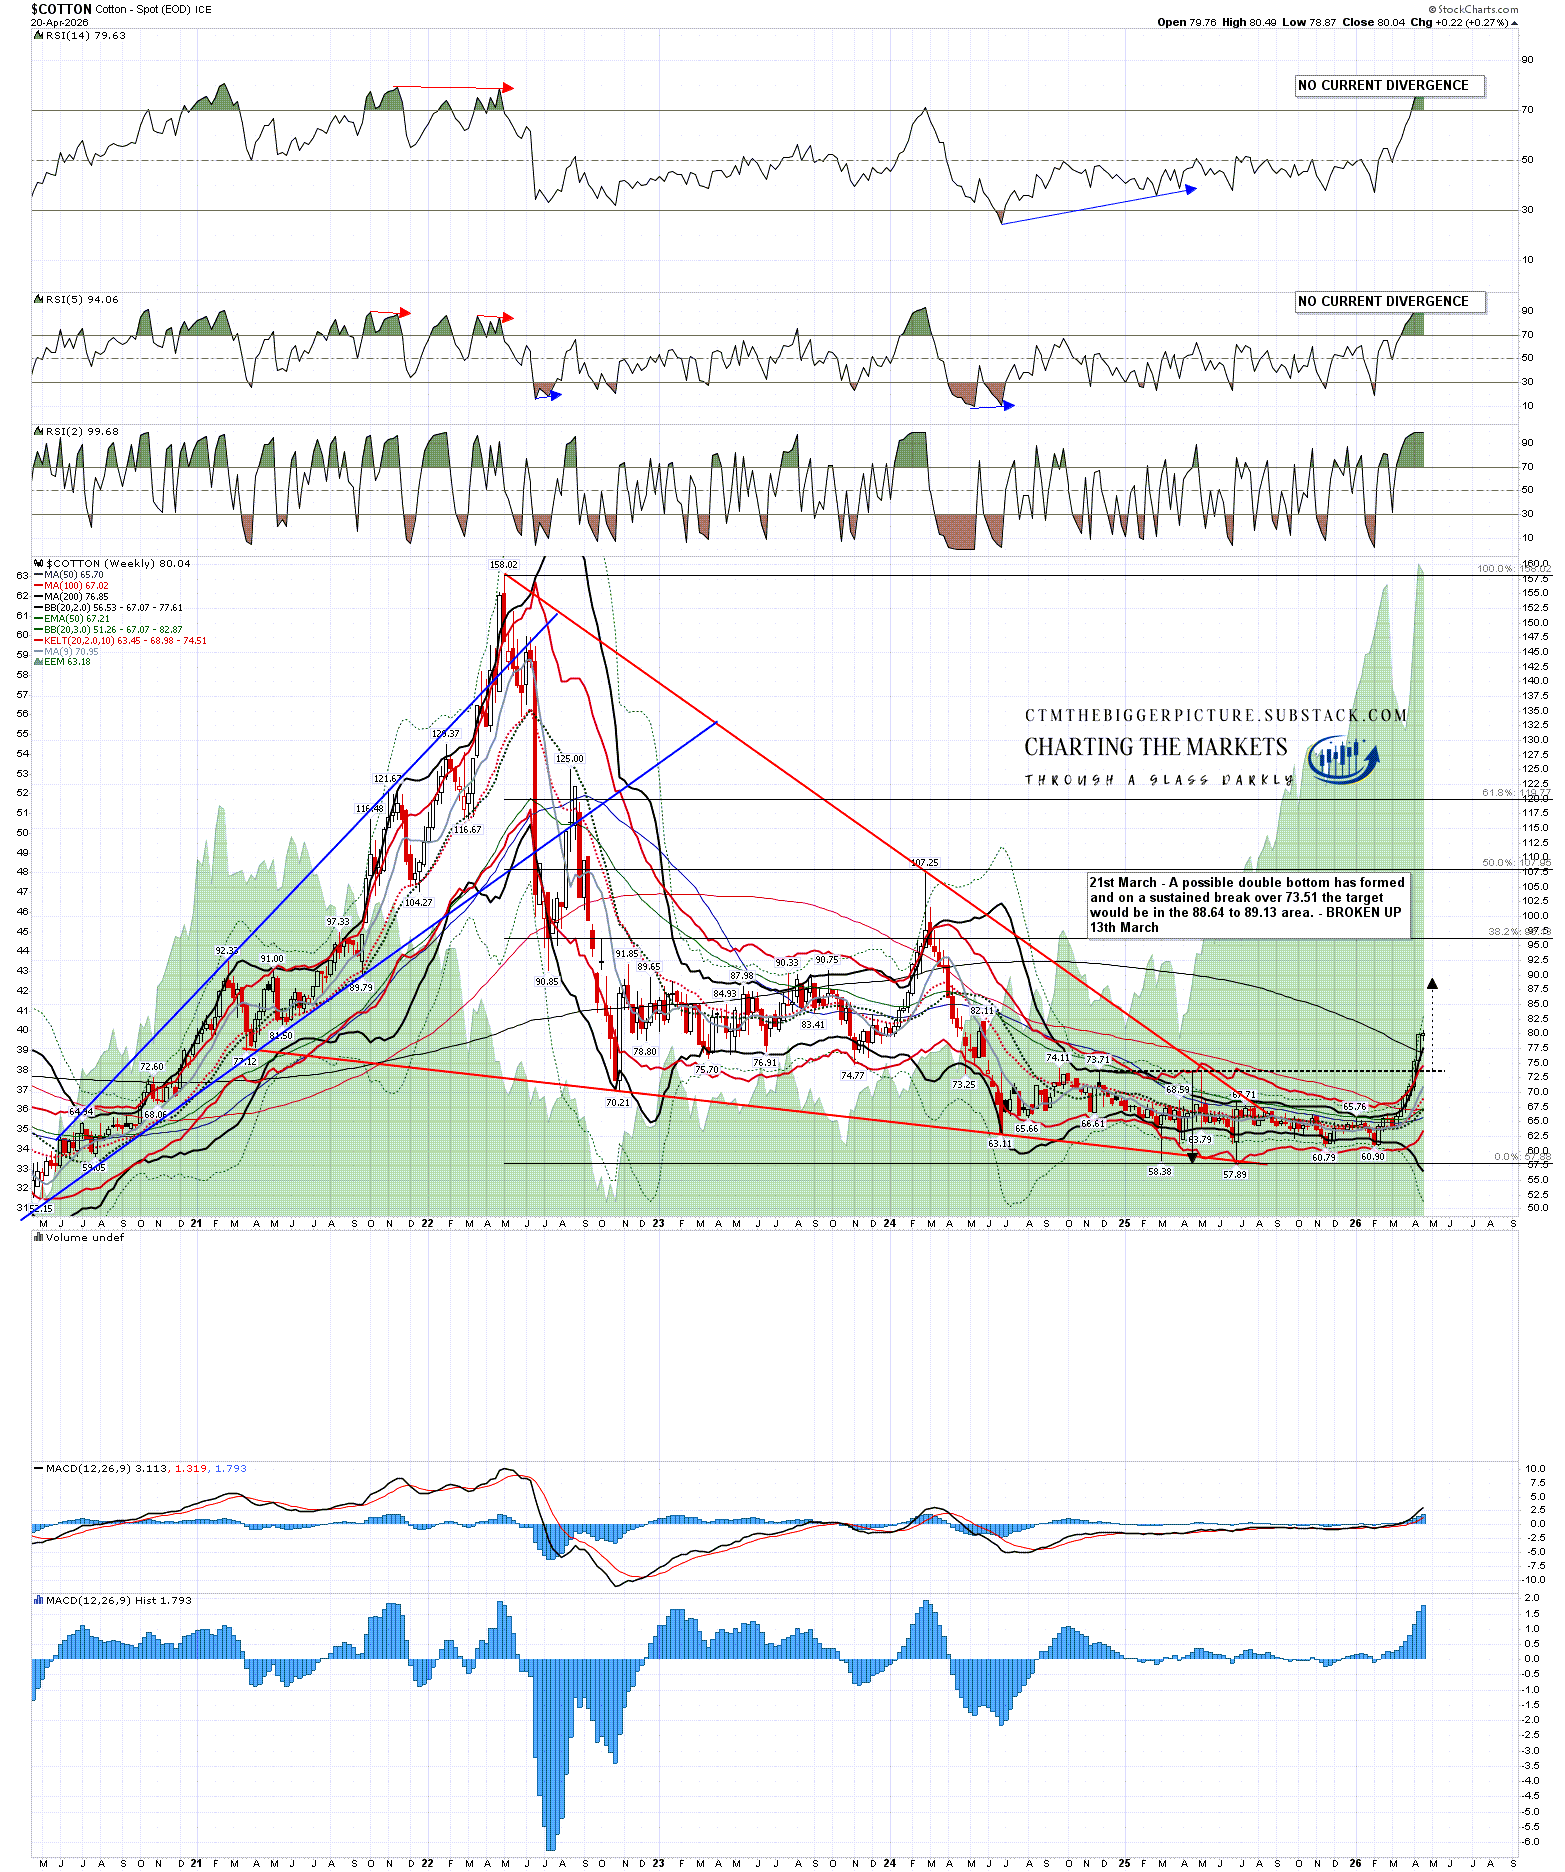
The first on the list is Cotton, which broke up on 13th March from a double bottom looking for a target in the 88.64 to 89.13 range. This is a big move but looking at Cotton from the high in 2022 after the invasion of Ukraine this is still less than a 38.2% retracement of the falling wedge from that high into the lows made last year. This could potentially further deliver a move higher into a retest of the 2022 high, in which case I’d be watching the possible IHS neckline or asymmetric double bottom resistance at 107.25, close to the 50% retracement of that rising wedge.
COTTON weekly chart:
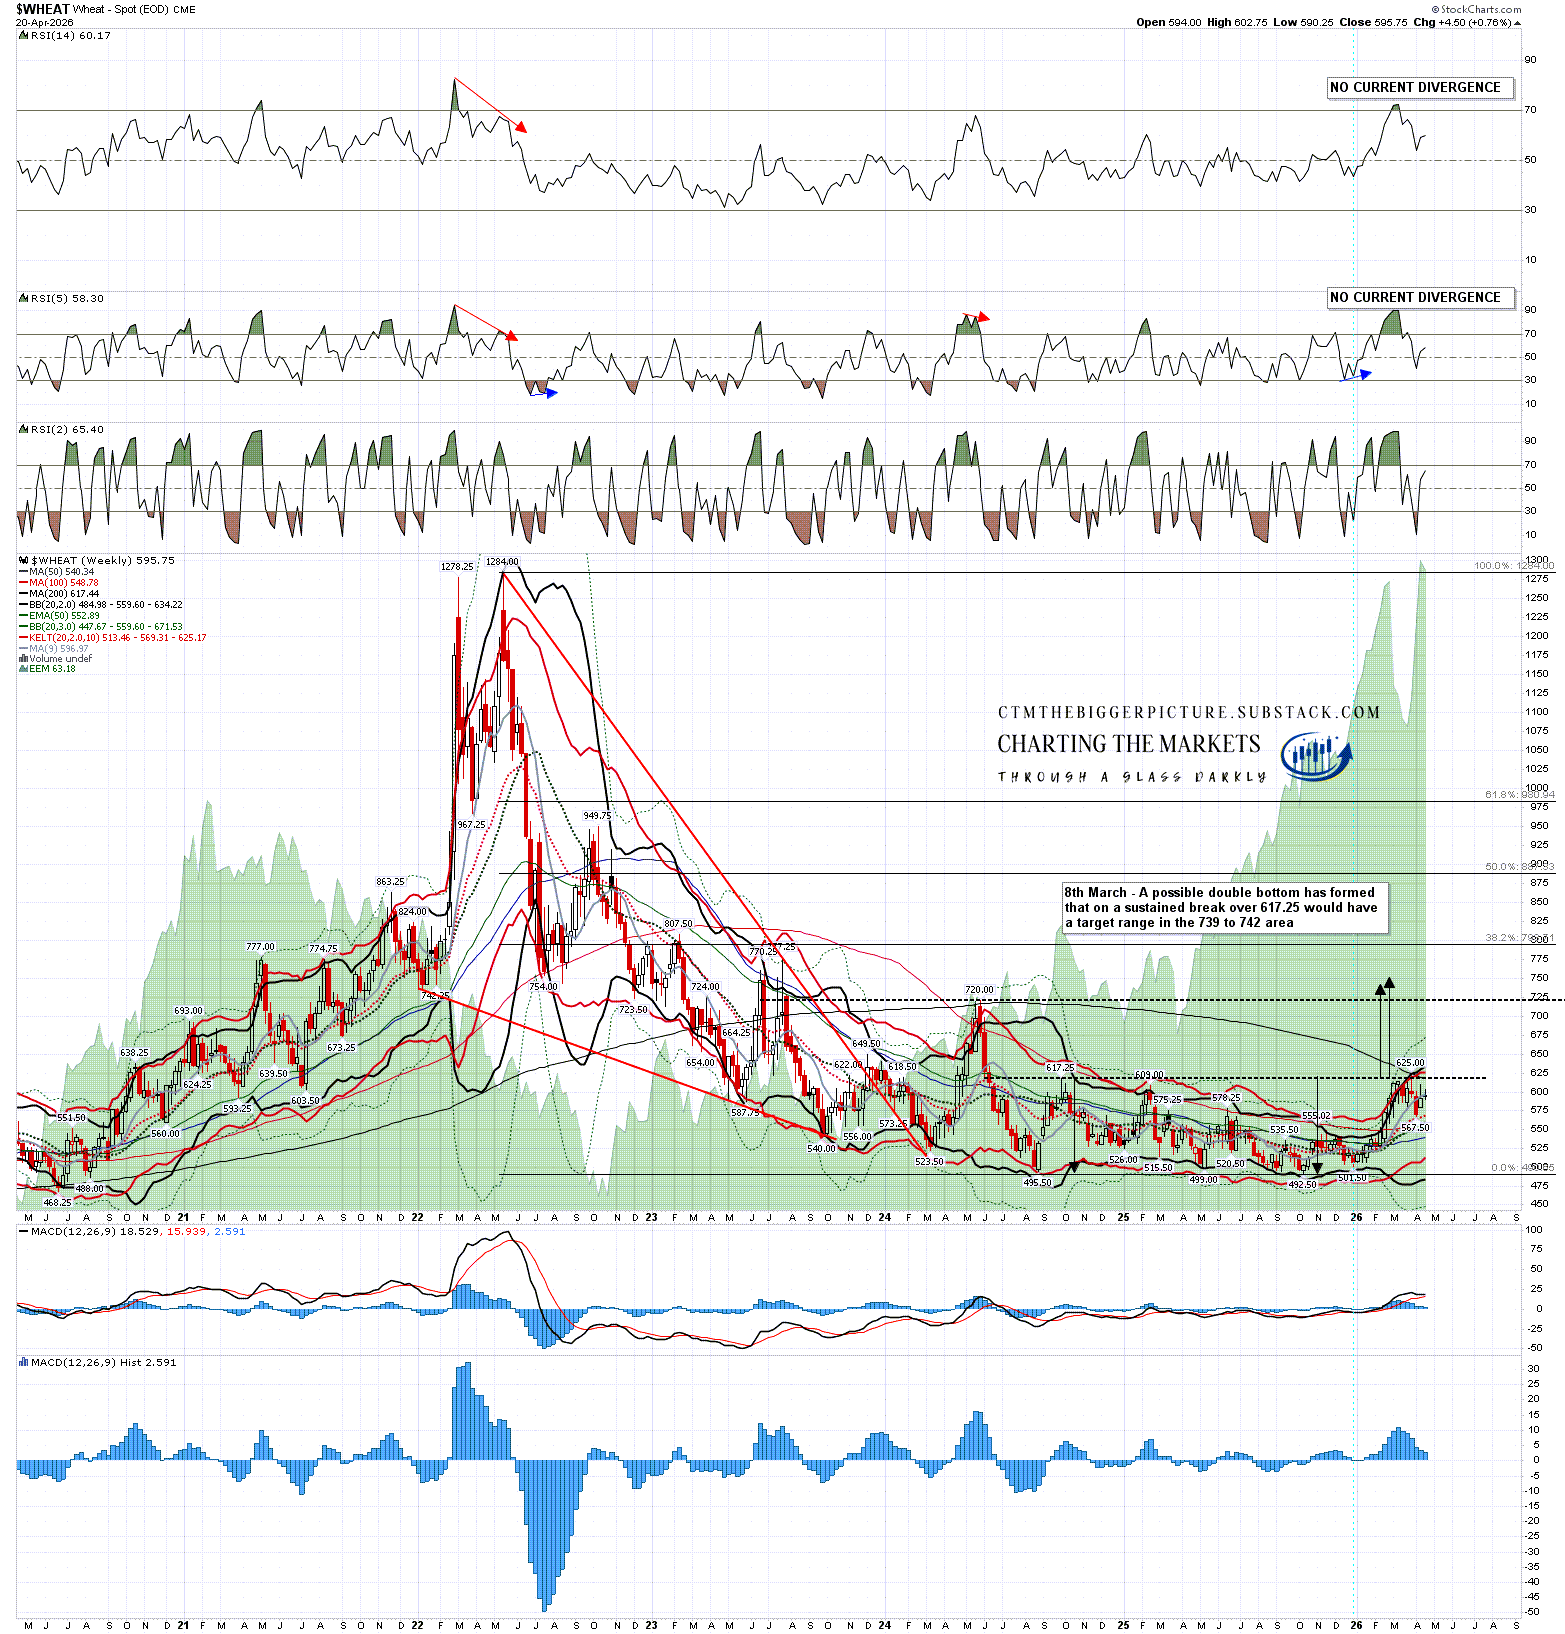
The second on the list is Wheat, which broke up very slightly from a double bottom looking for a target in the 739 to 742 range. This is a big move but looking at Wheat from the high in 2022 after the invasion of Ukraine this is still less than a 38.2% retracement of the falling wedge from that high into the lows made in 2024 and 2025. This could potentially further deliver a move even high, in which case I’d be watching the possible IHS neckline or asymmetric double bottom resistance at 720. There’s nothing here currently to suggest a move that might exceed at 61.8% retracement of that rising wedge.
WHEAT weekly chart:
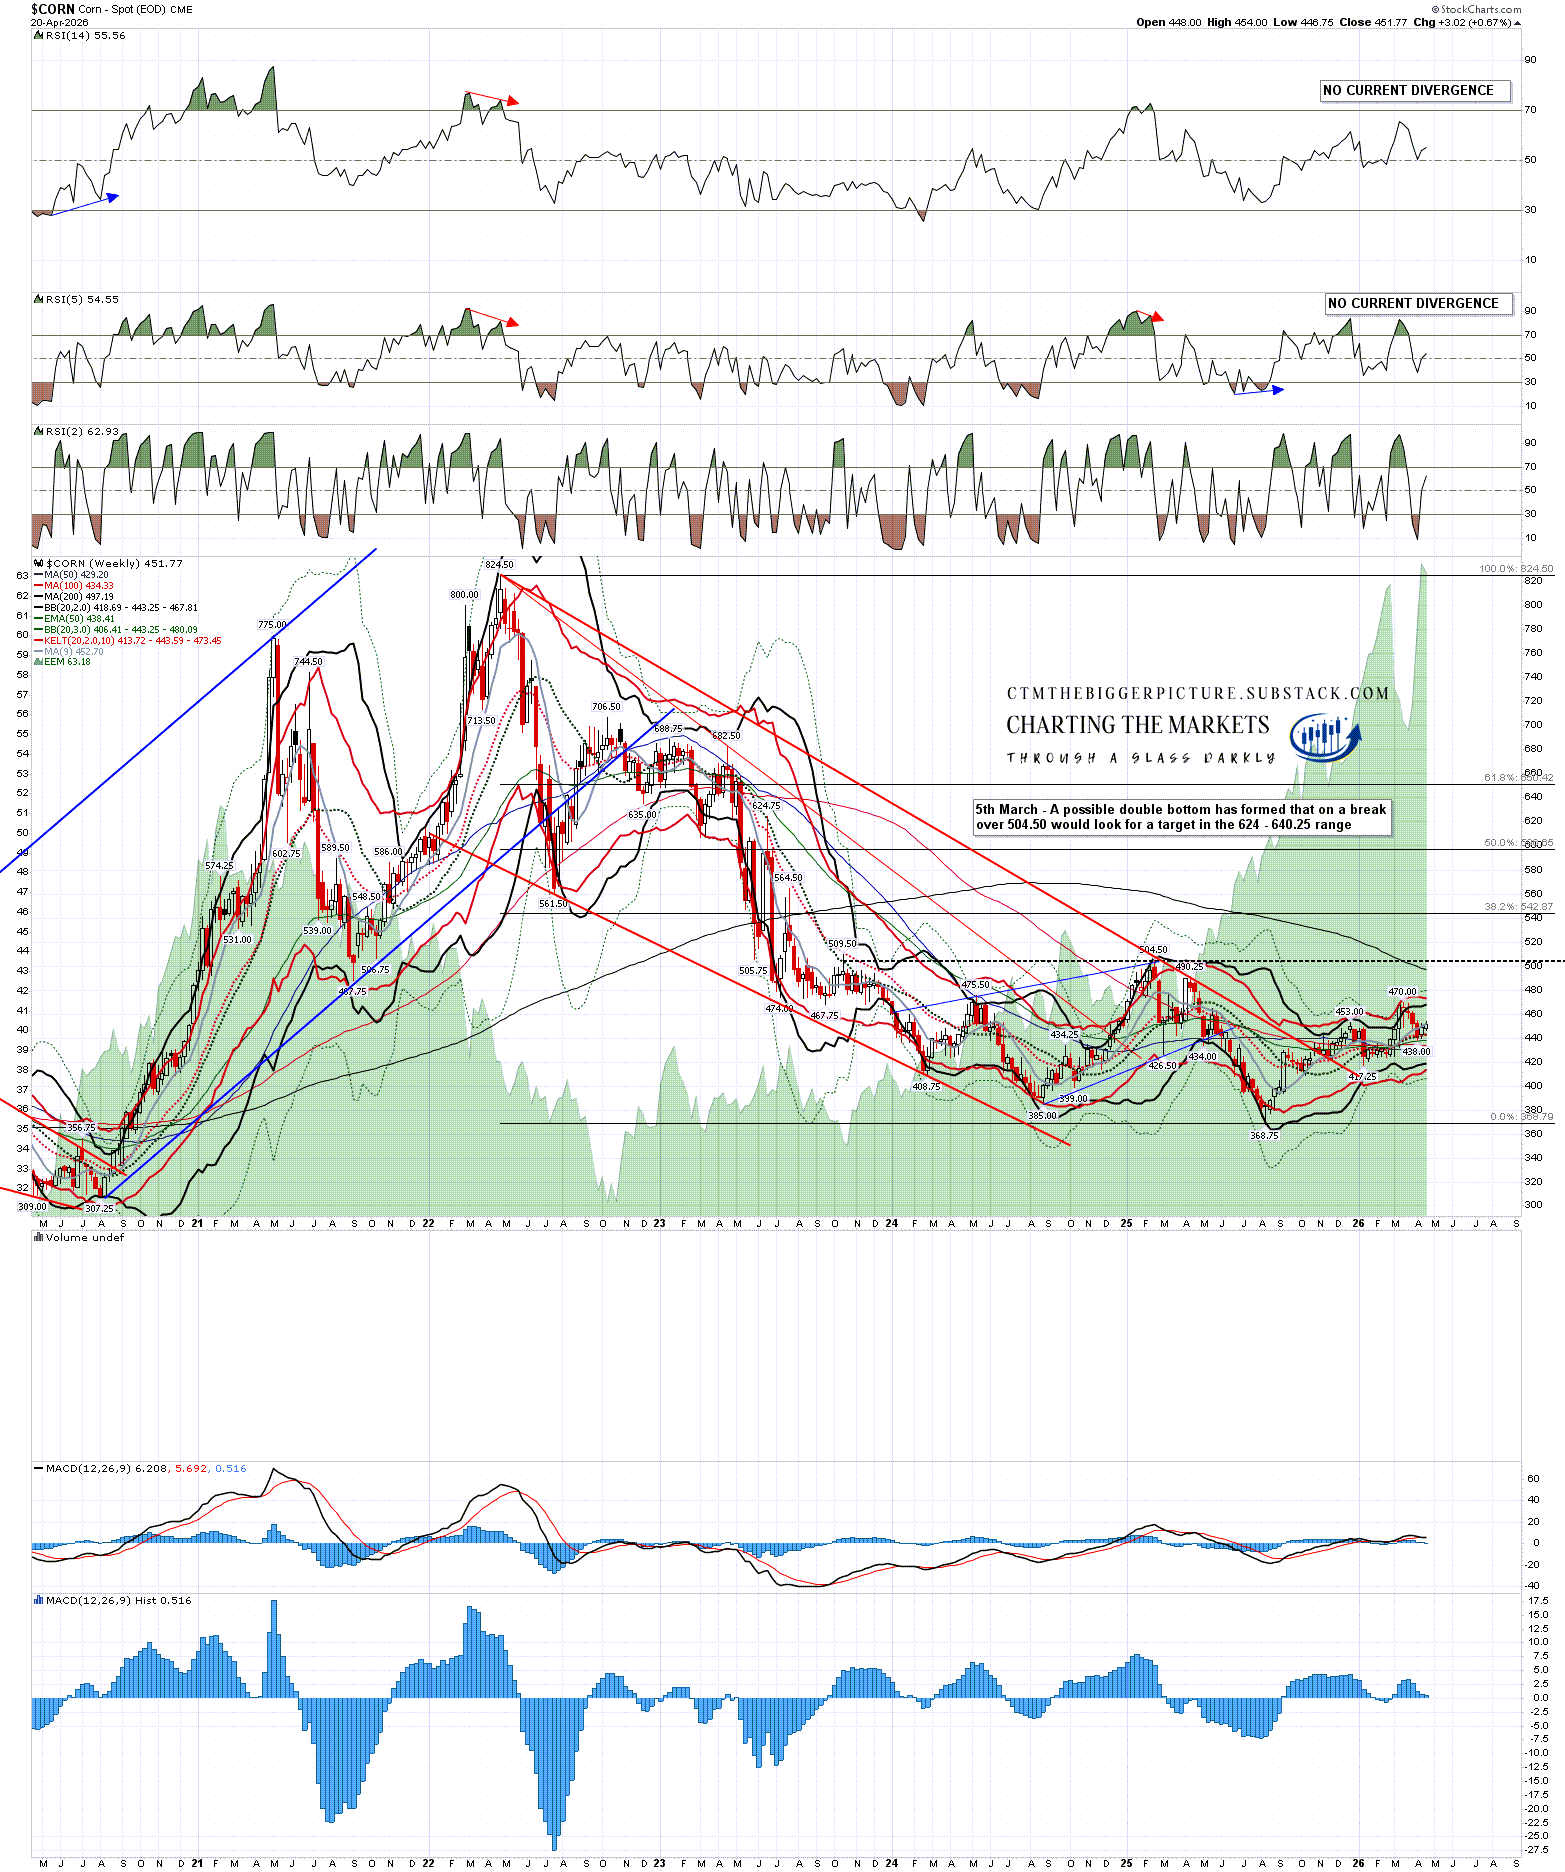
The third on the list is Corn, where a double bottom setup has formed that on a sustained break over 504.50 would look for a target in the 624 to 640.25 range. This would be just under a 61.8% retracement of the falling wedge from the 2022 high to the lows in 2024 and 2025. There’s no obvious path higher at the moment unless a right shoulder forms near the possible IHS neckline in the 564.50 area.
CORN weekly chart:
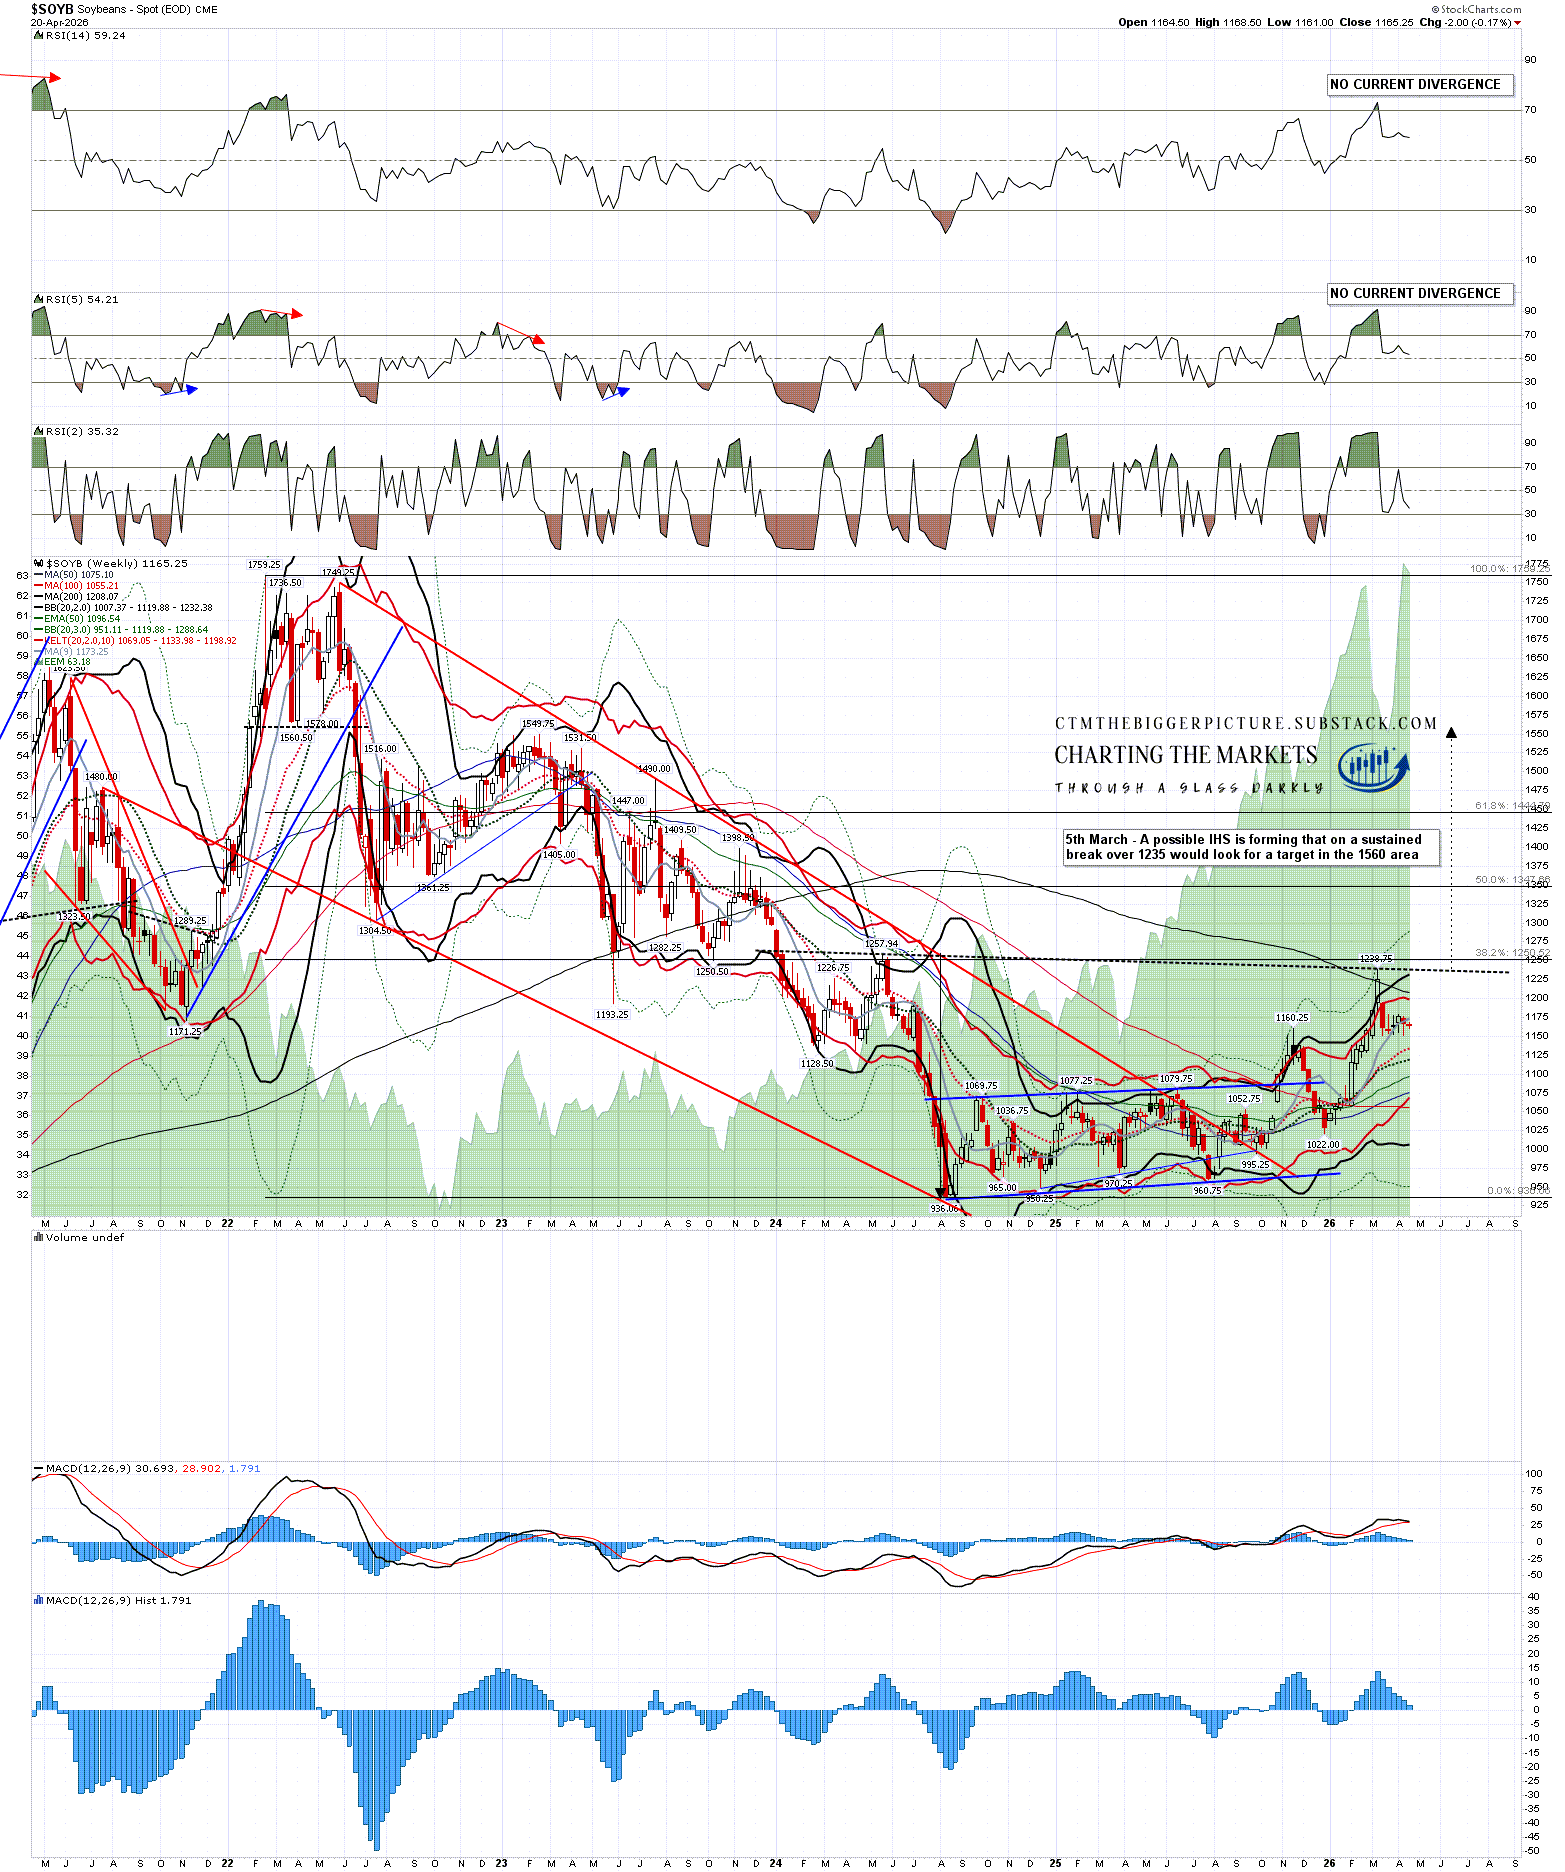
Soybeans are the only one of these crops that had not formed a double bottom by the start of this year. I had been expecting one as a clear bear flag channel was forming for over a year from the low in 2024. That bear flag broke up though, came close to a retest of the possible IHS neckline at 1257.94, and has since been pulling back in what may well be an IHS right shoulder. A sustained break over 1235 would look for a target in the 1560 area, close to a 76.4% retracement of the falling wedge from the 2022 high into the low in 2024. There is no obvious path higher from there.
SOYB weekly chart:
To a large extent these setups are just routine retracements of their big moves down from the major highs made in 2022, and they are very possibly not dependent on a further escalation of the Iran War. These moves may already be baked in from the disruption of the last few weeks affecting the crops to be harvested over the next few months.
I’m planning a post over the next few days looking at possible options trades to take advantage of these moves.
The next post in this series will be looking at the bullish setups on bond yields. These are by far the scariest looking setups here and I’m aiming to get that out by the end of April.
If you like my analysis and would like to see more, please take a free subscription at my thebiggerpicture substack, where I publish these posts first and for members (from next week) also bi-weekly videos looking at equity indices, bonds, currencies and commodities. Those videos are posted on my Youtube channel after a seven day delay. Links to all my posts from my charting substacks are also always posted on my twitter.
No comments:
Post a Comment