
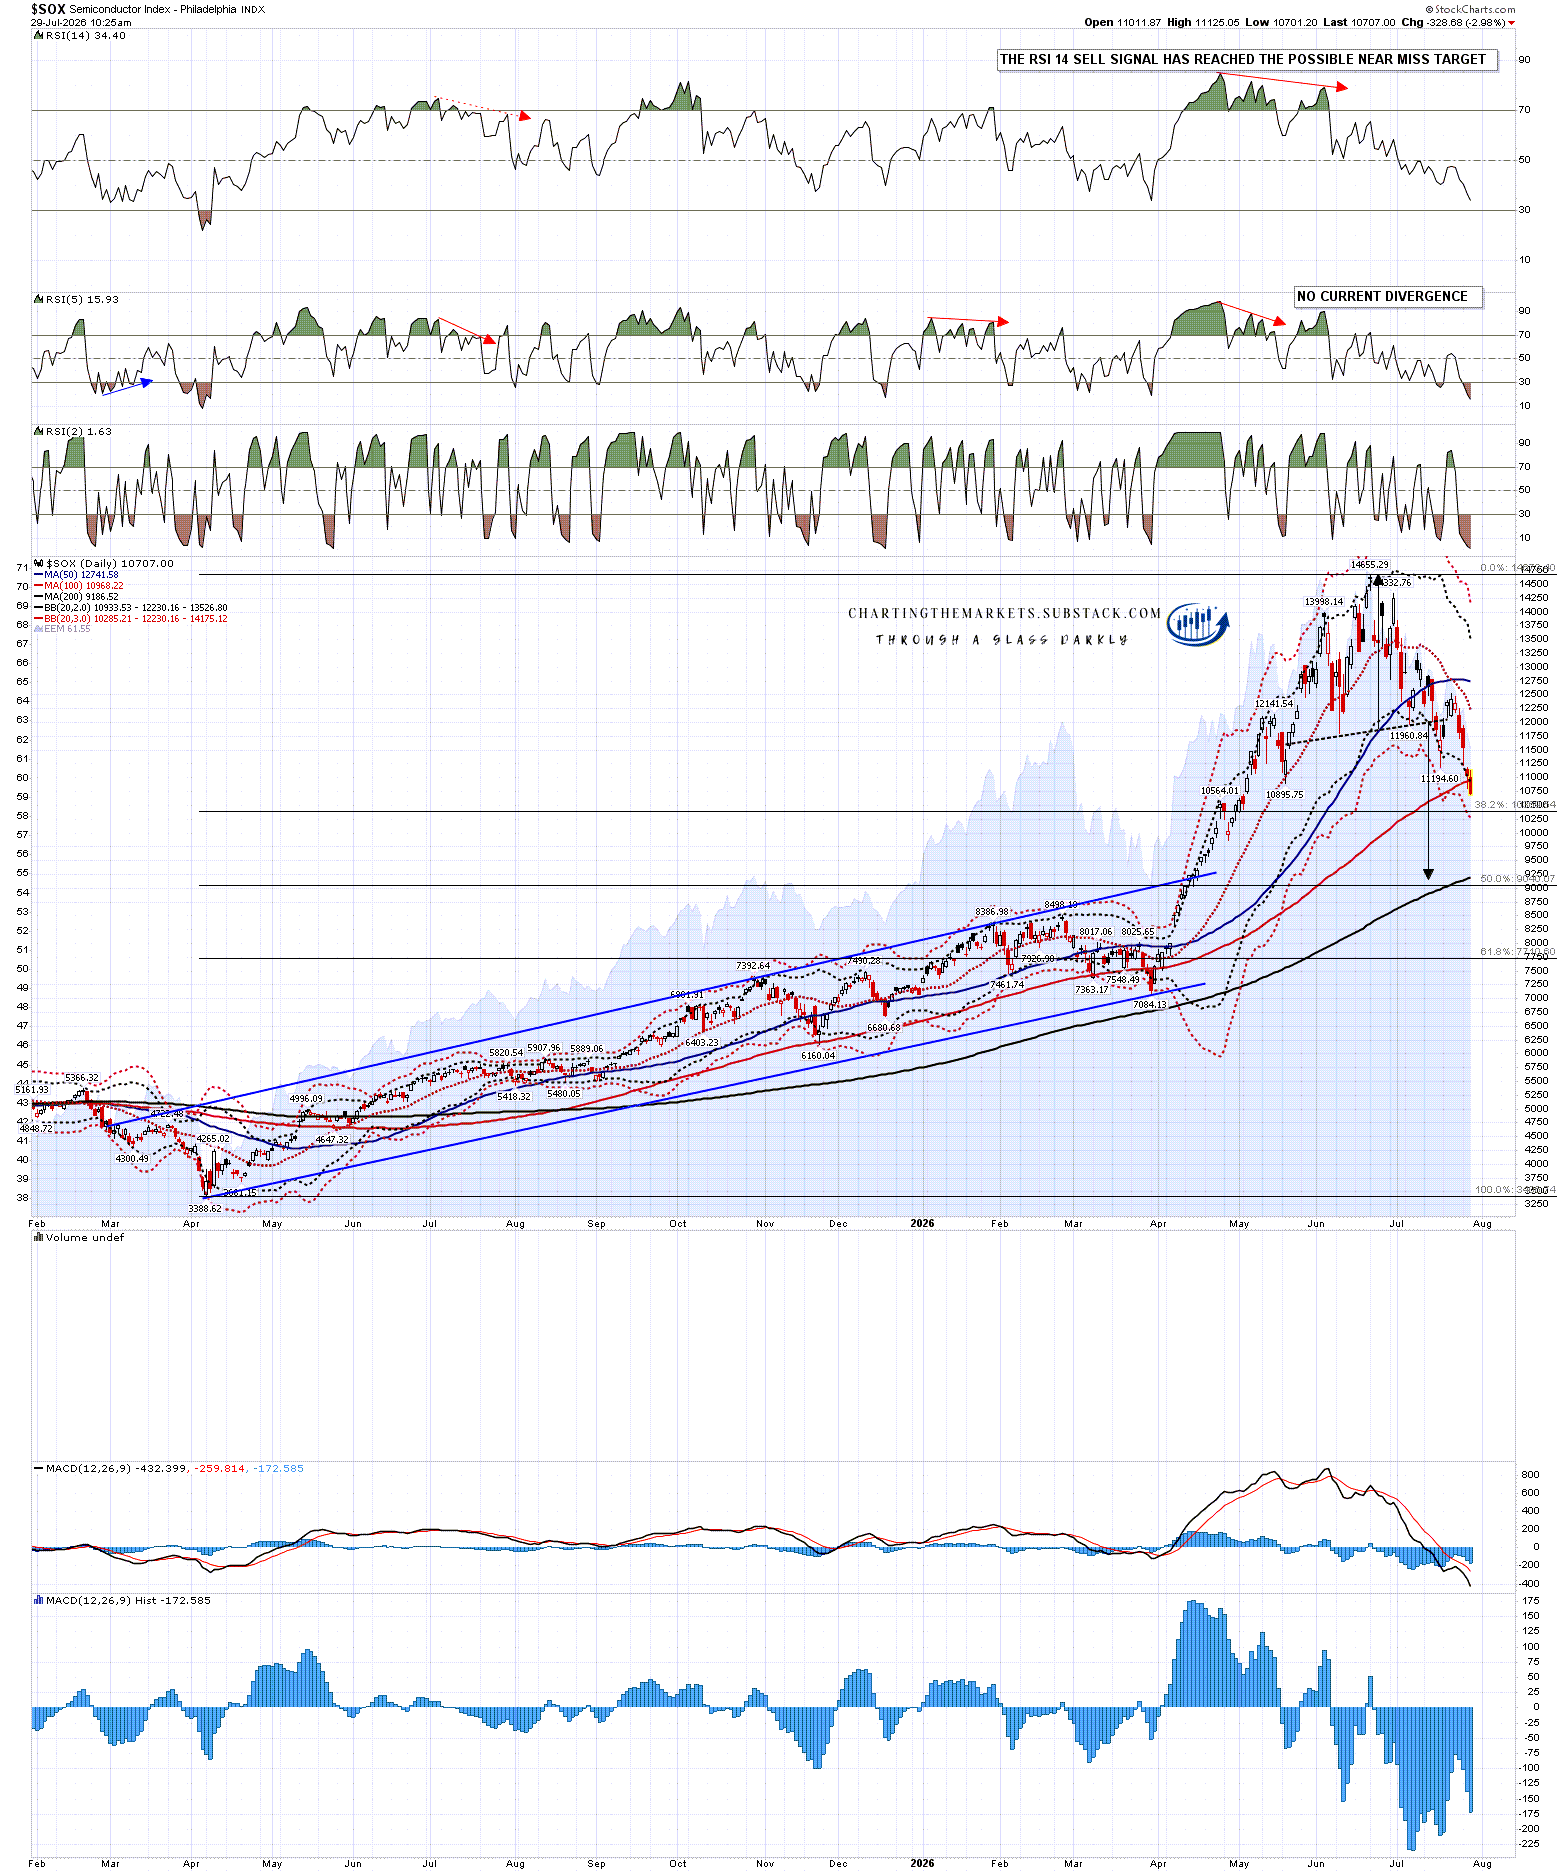
In my post on Thursday last week, among other things, I was looking at the strong rally on the Philadelphia Semiconductor Index (SOX) and looking at the very binary setup there where was (and is) likely either to head down to the fixed H&S target in the 9,150 area or, on a break back over the right shoulder high at 13,249.07, to reject back up to a retest of the all time high.
Since then SOX has given back all of that rally and made lower lows, which is favoring the move to the H&S target in the 9150 area. I would add that this H&S target is also close to the 200dma, currently at 9186.52, a very attractive target area.
SOX daily chart:
In my post yesterday I was looking at various patterns and noting that equity indices might break down from this area. One chart I didn’t post for space reasons mainly, but I have been looking at most days for subscribers, was the possible bullish leaning triangle on my SPX hourly chart. That triangle support trendline is starting to break down this morning.
SPX 60min chart #1:
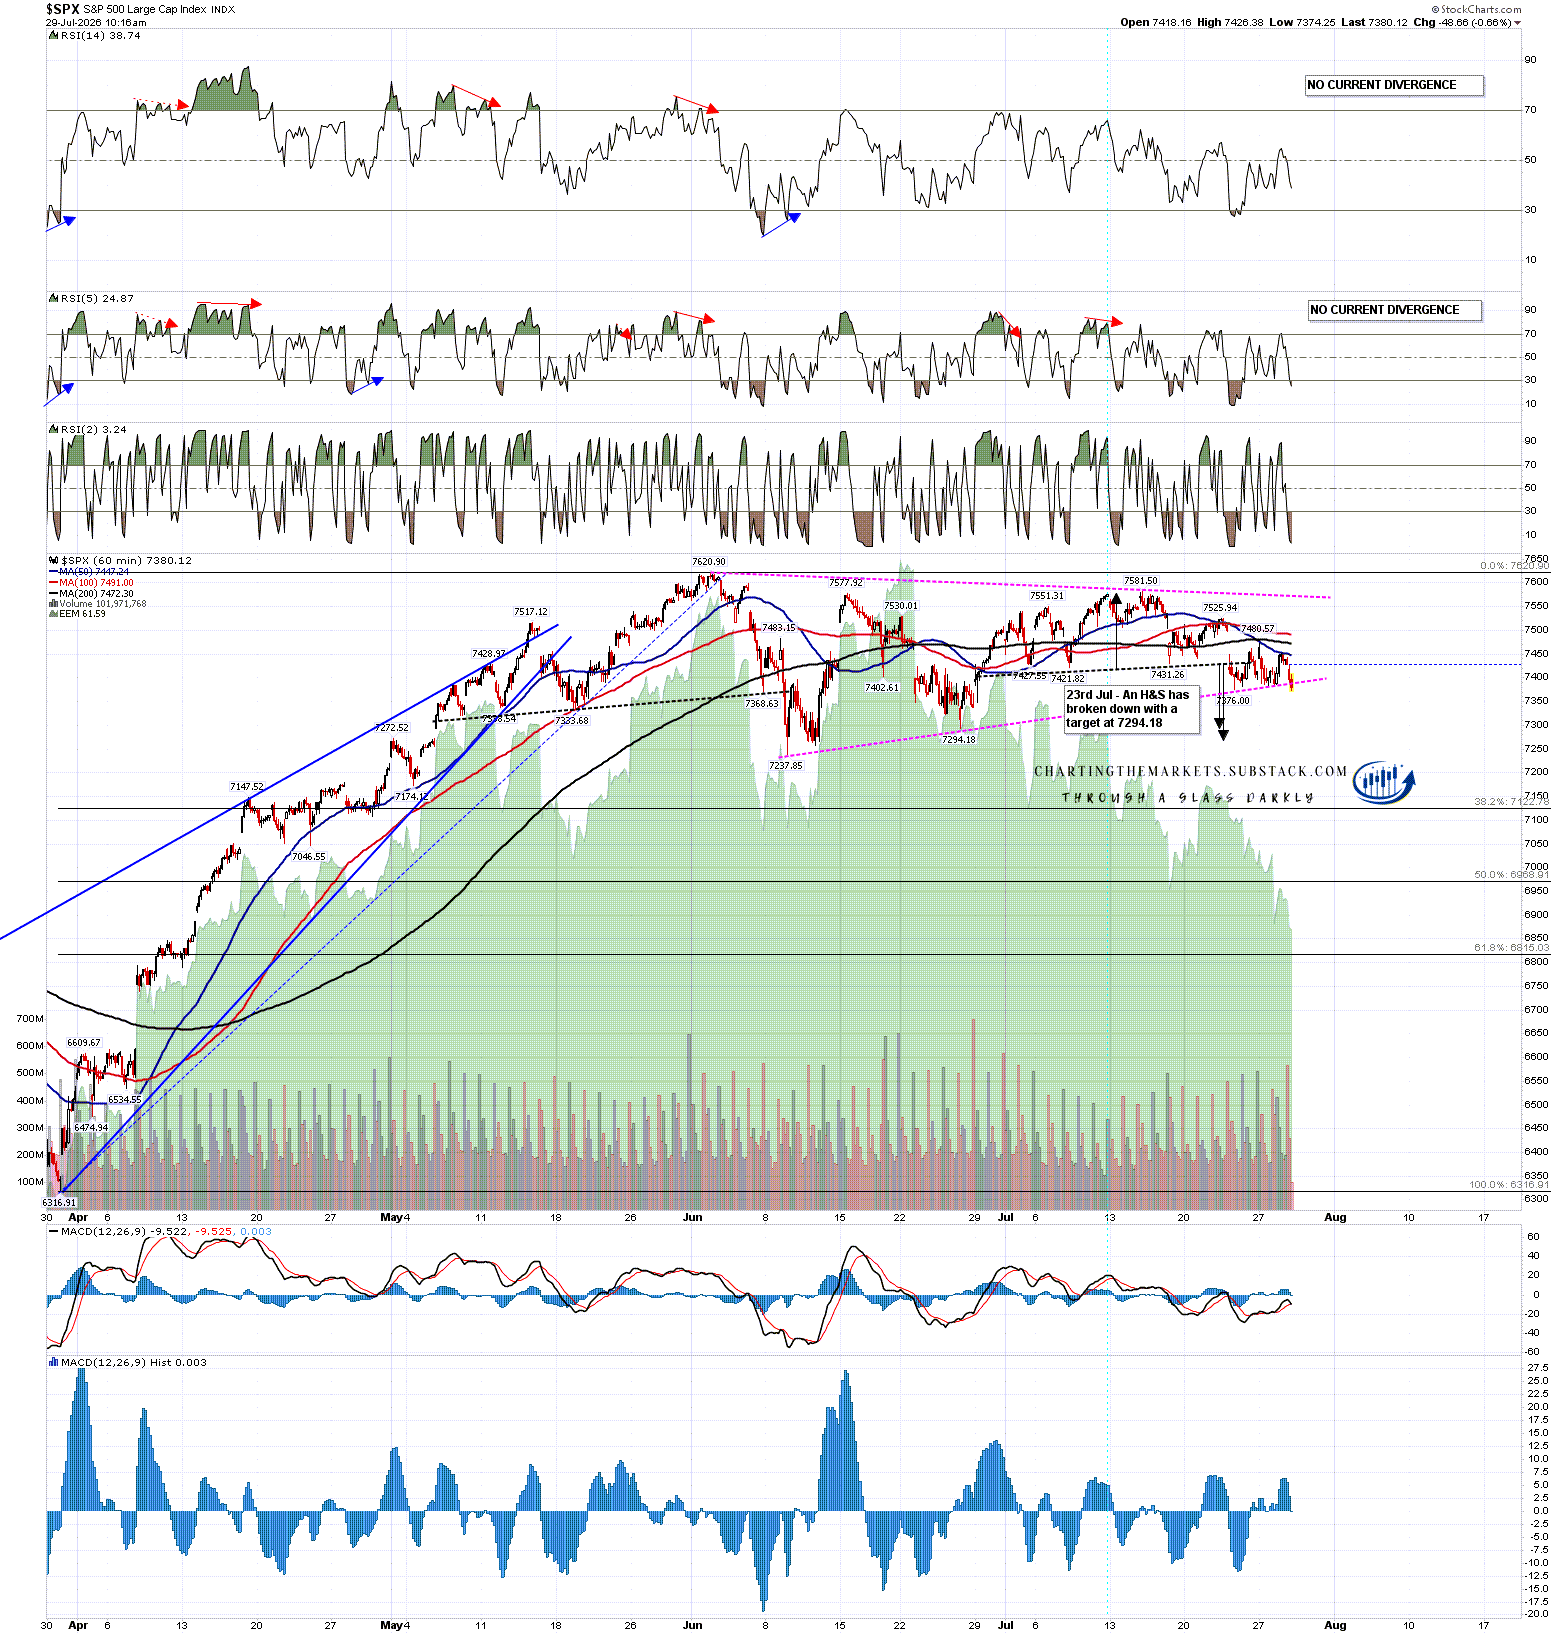
What does this mean? Well it means that it is likely no longer a bullish triangle and after reading a comment yesterday that I saw on the platform formerly known as twitter, I redrew this as a possible diamond top and it looked pretty good.
SPX 60min chart #2:
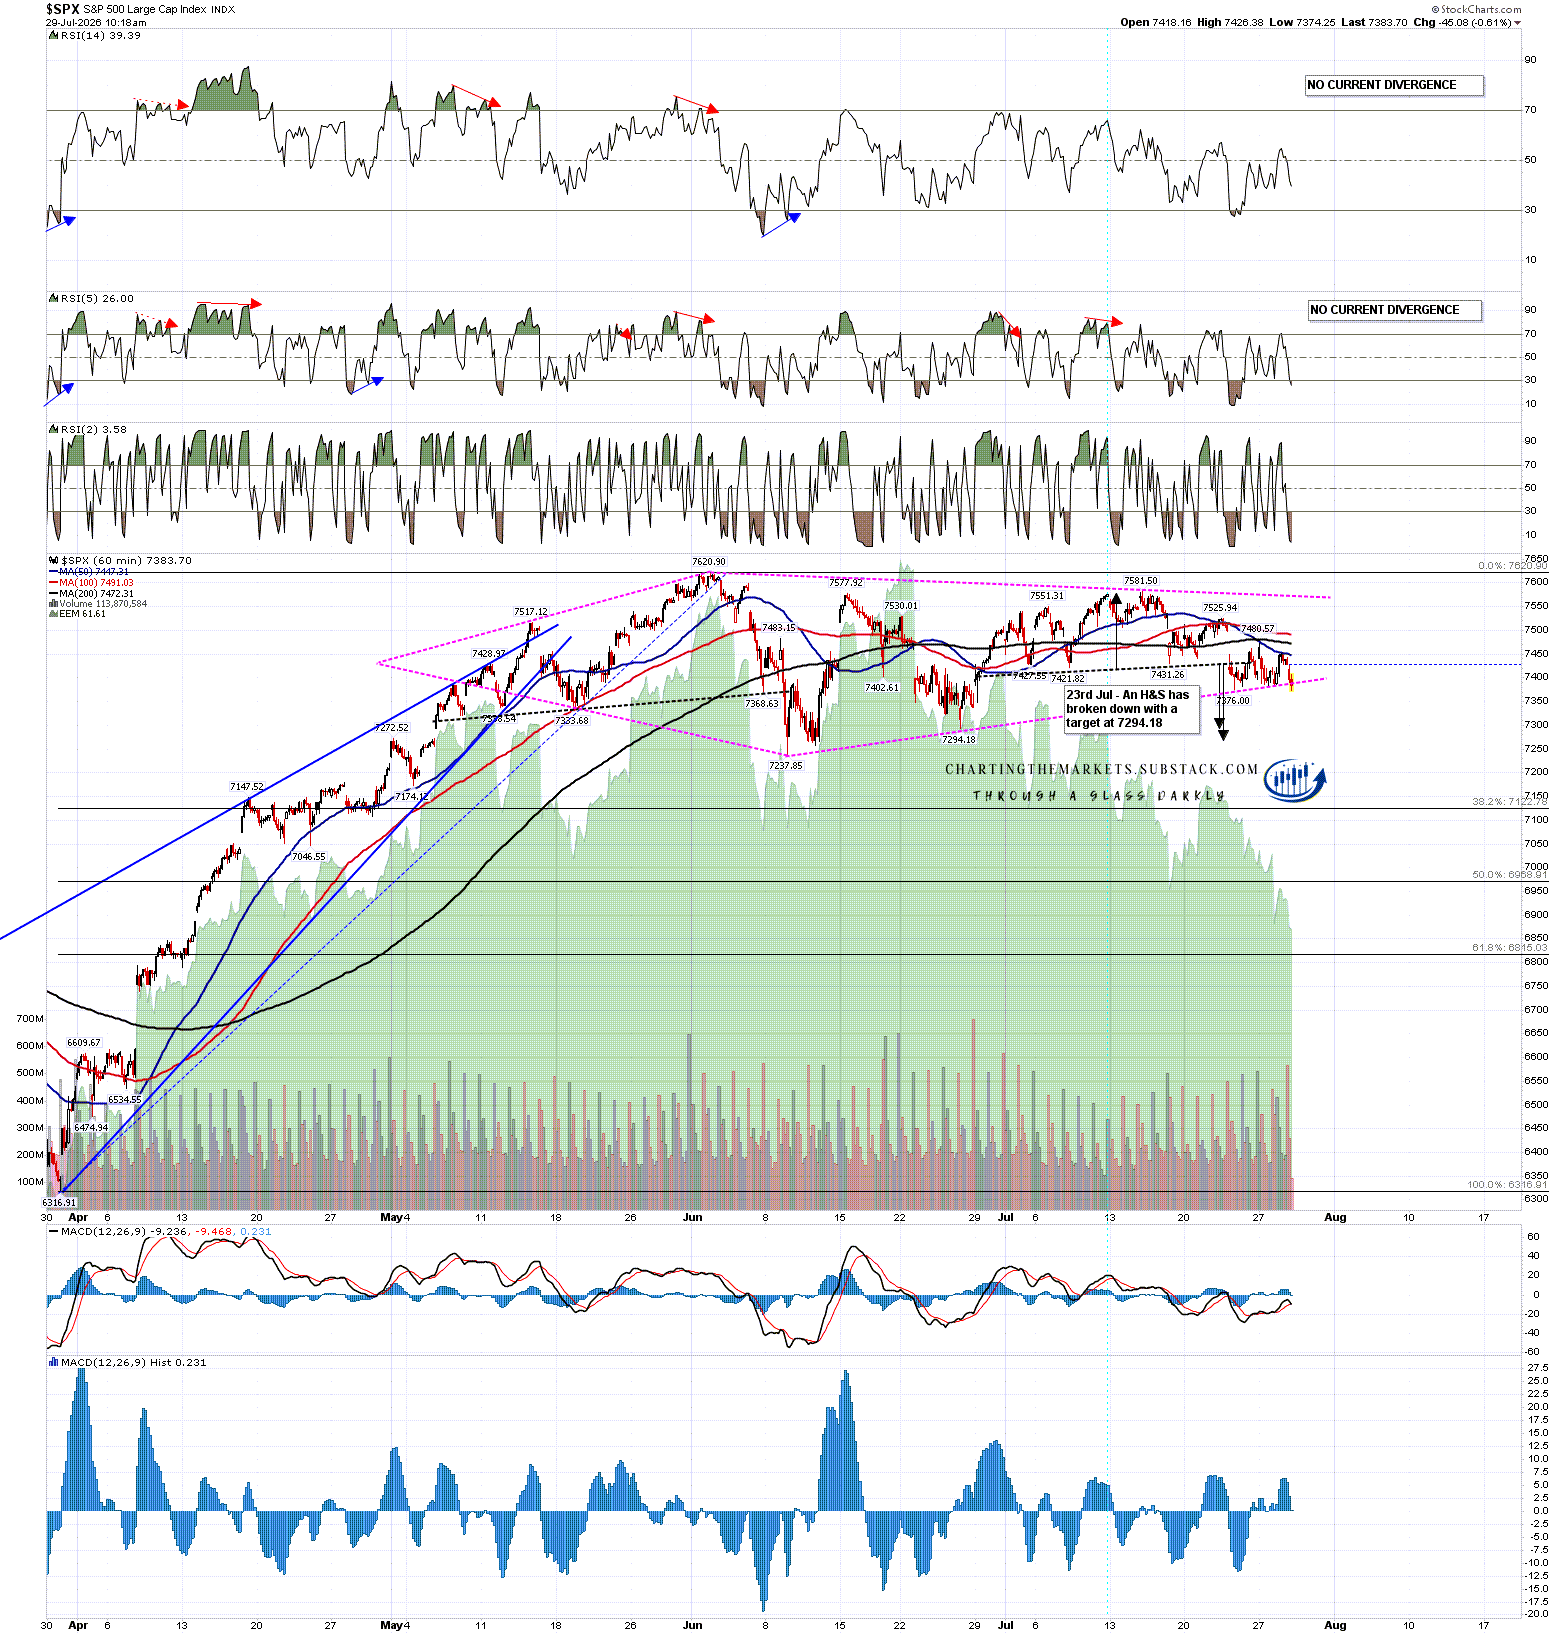
Now on the hourly chart there is already a small H&S that has broken down with a target at a retest of 7294.18, but if this is a diamond top breaking down then that top has a target in the 6980 area, in effect a backtest of the 200dma, currently at 7015.85. That is a pretty obvious target area to backtest even in an ongoing uptrend.
SPX daily chart:
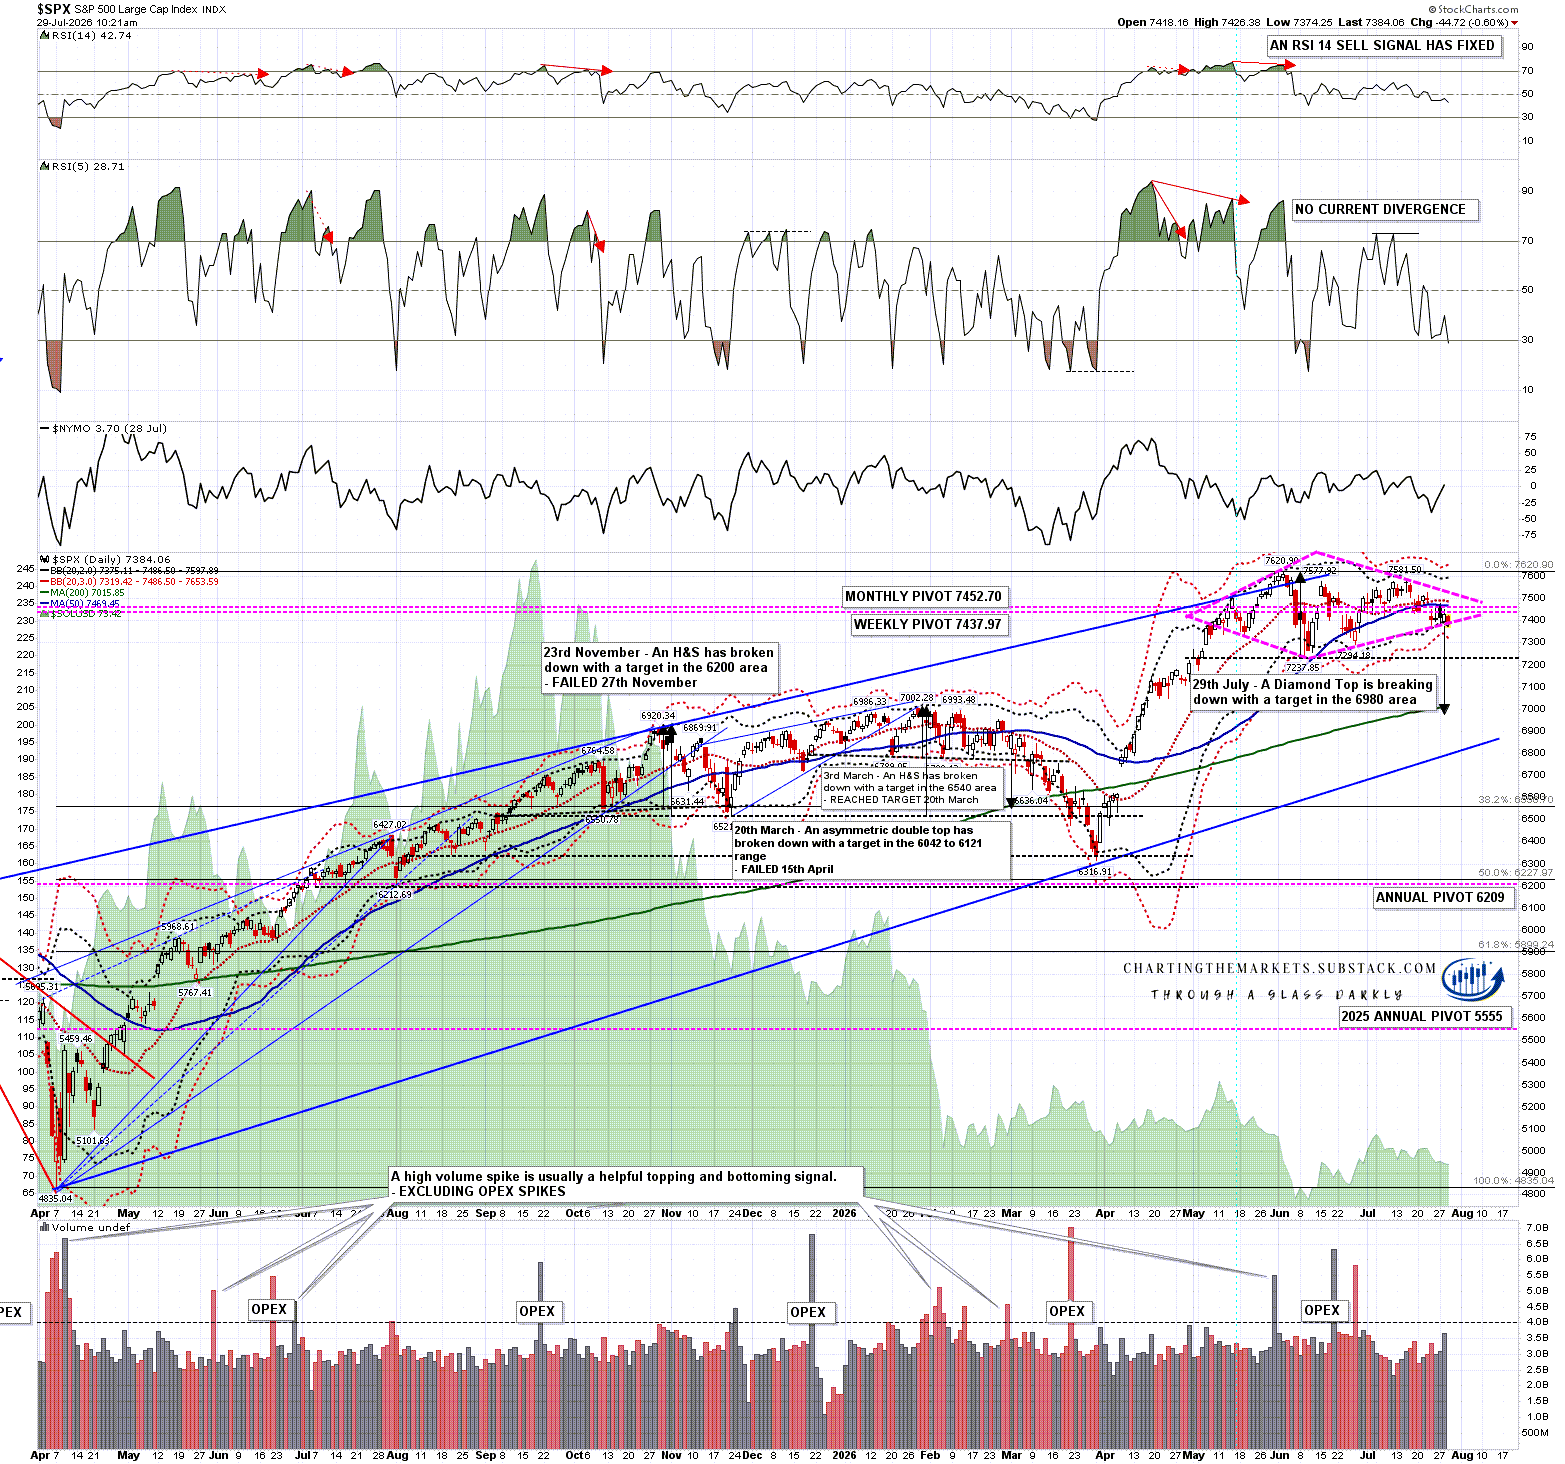
So is there any support for this diamond top thesis? Well the suggestion I saw yesterday was actually talking about NDX, so I had a look on QQQ and there is an even nicer version there, which had already broken down and is well on the way to the target in the 642 area, also close to the 200dma, currently at 642.95. If we see an extension lower from there the obvious target would be rising support from the April 2025 low, currently in the 608 area.
QQQ daily chart:
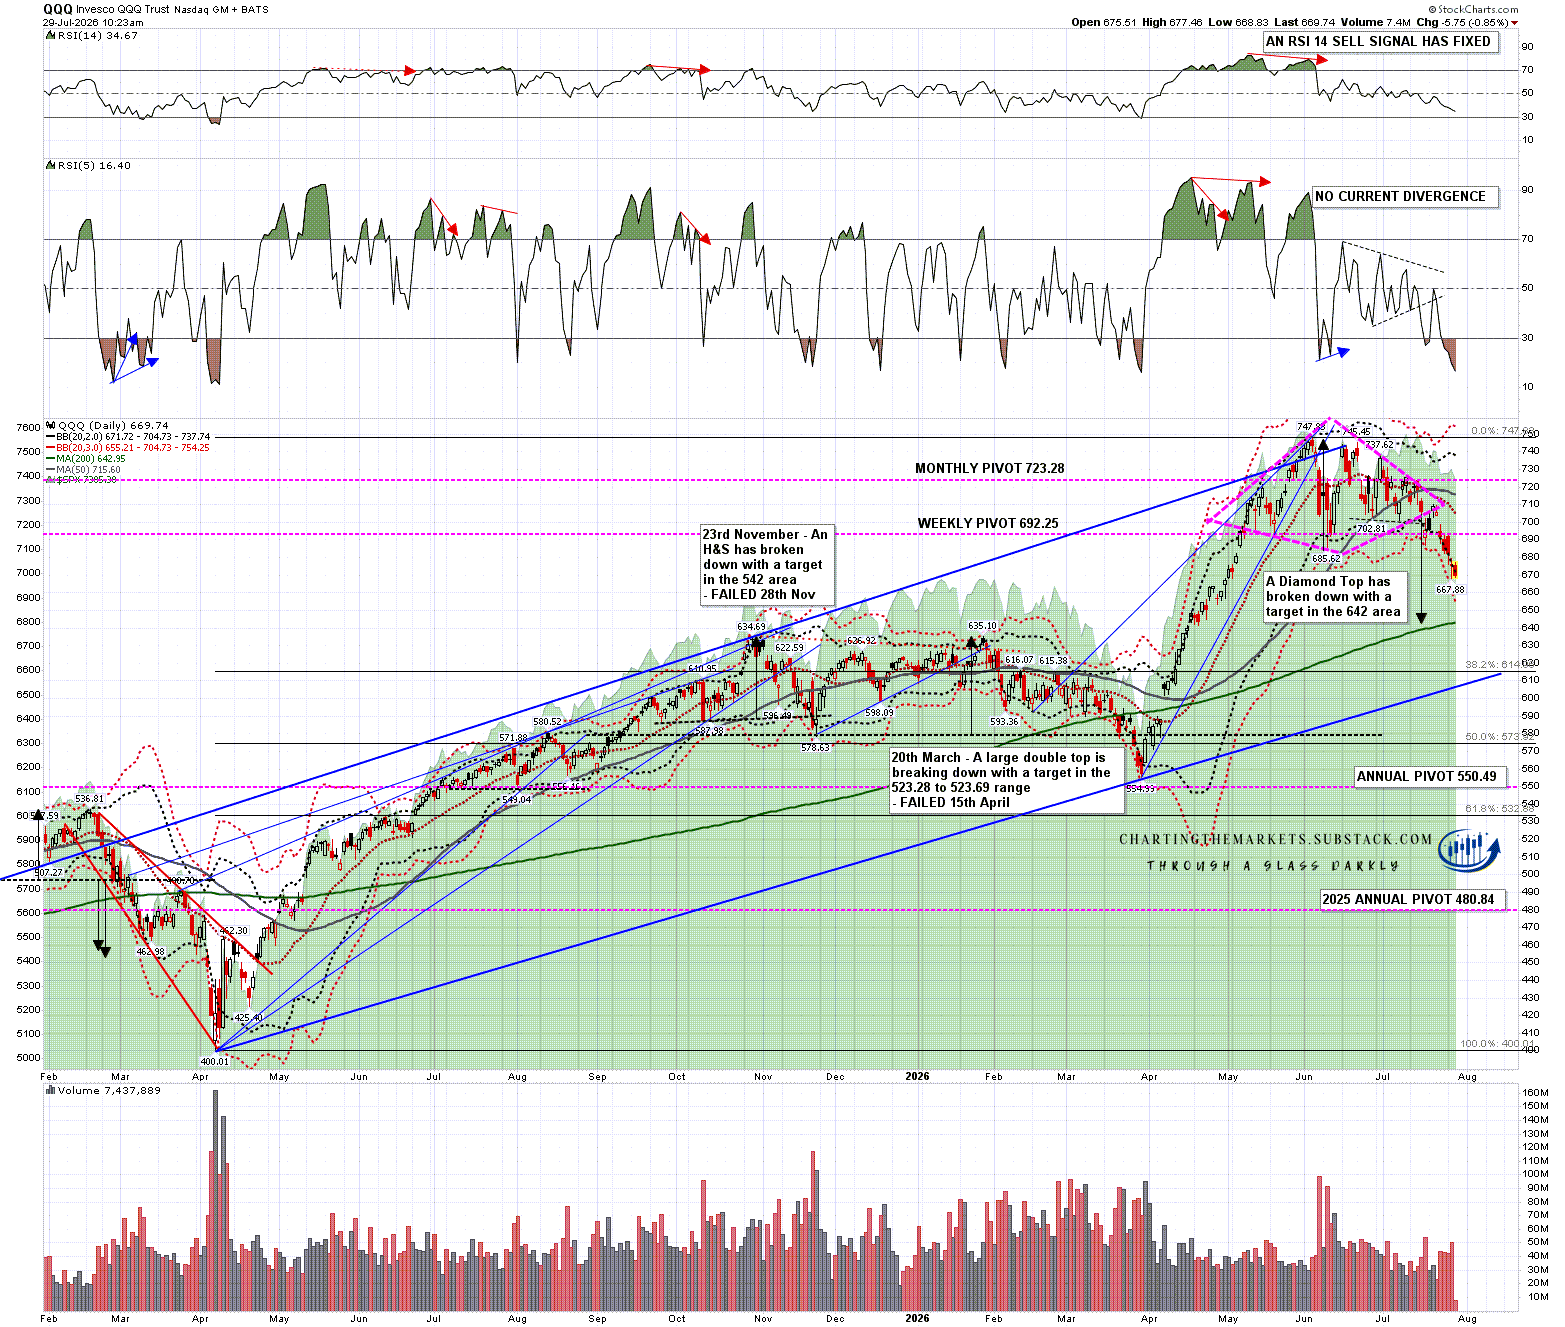
Backtests of the 200dma or key support trendlines are just retracements and if a larger top is forming here I’d be seeing this as part of the topping process, but we may be seeing the start of a break down to really get that ball rolling.
Is there an important support level I’m watching that has not yet broken? Not on an index but I’m watching TSLA closely here.
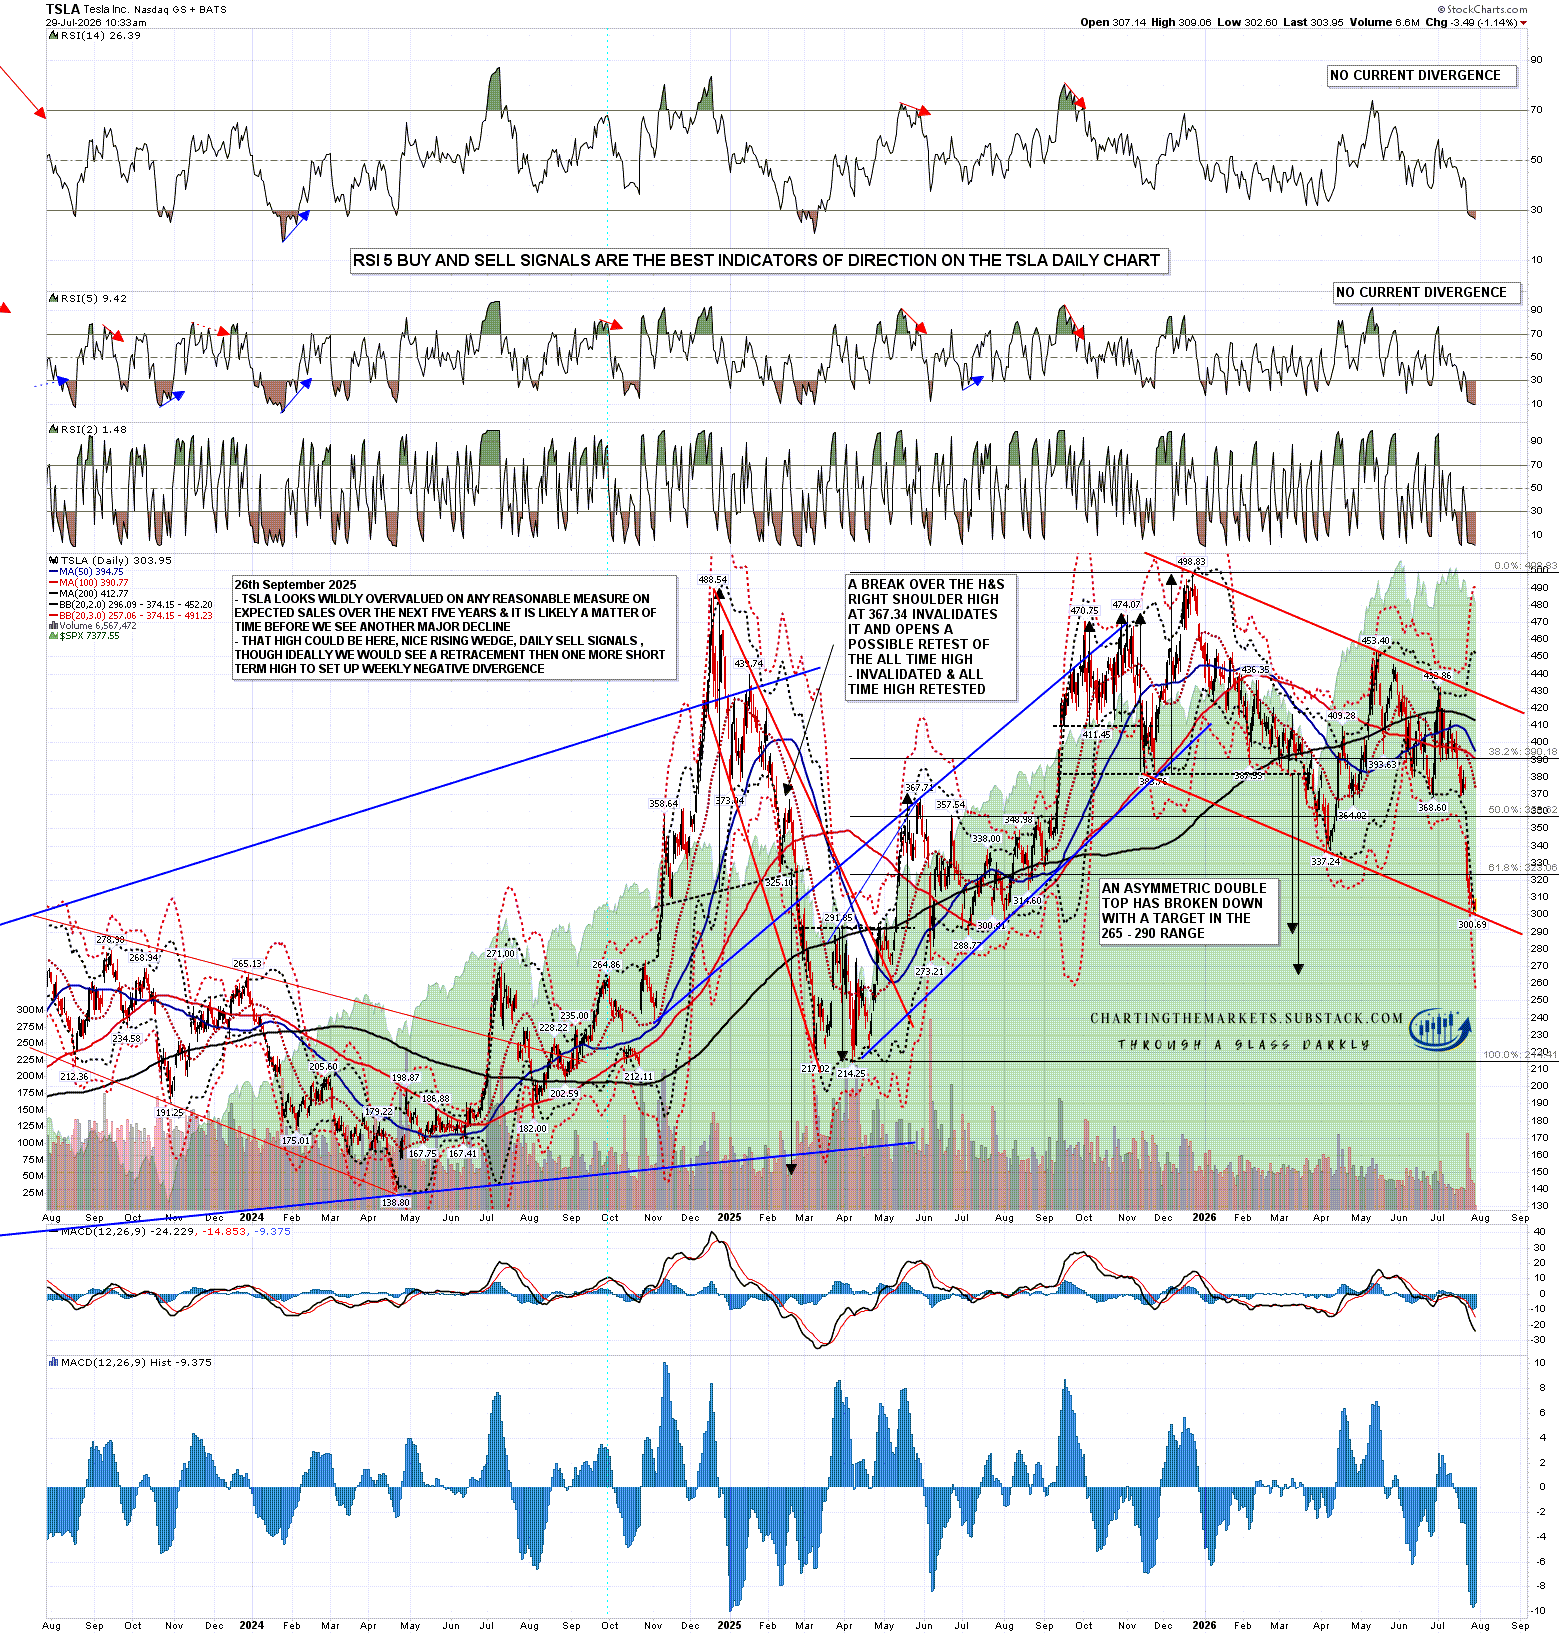
On the TSLA daily chart an asymmetric double top broke down in March with a target in the 265-290 range and TSLA is currently testing 300, but the very interesting thing that happened on the way down is that a perfect falling channel formed that could be a bull flag. That falling channel support is being tested now and as these don’t tend to under or over throw, a clear break below channel support would kill the channel. Until then though TSLA could hold this support and reverse back up towards falling channel resistance, currently in the 428 area.
TSLA daily chart:
There are a lot of issues with equity markets here. The Iran War certainly isn’t improving confidence and is pushing up both inflation and uncertainty. There is serious talk that the Fed might raise interest rates at FOMC today in response to rising inflation, but the biggest issue short term is the weakness in Tech that I was illustrating with the SOX chart last Thursday. SOX has now more than given back all of last week’s rally and that H&S target is looking good. If that delivers then Tech will likely drag SPX down with it, and deliver some weakness on IWM and DIA too.
If you like my analysis and would like to see more, please take a free subscription at my chartingthemarkets substack, where I publish these posts first. I also do a premarket video every day on equity indices, bonds, currencies, energies, precious commodities and other commodities at 8.45am EST, but only for paying subscribers. Other places to find me are my page on the platform previously known as twitter, and my YouTube channel.


No comments:
Post a Comment