
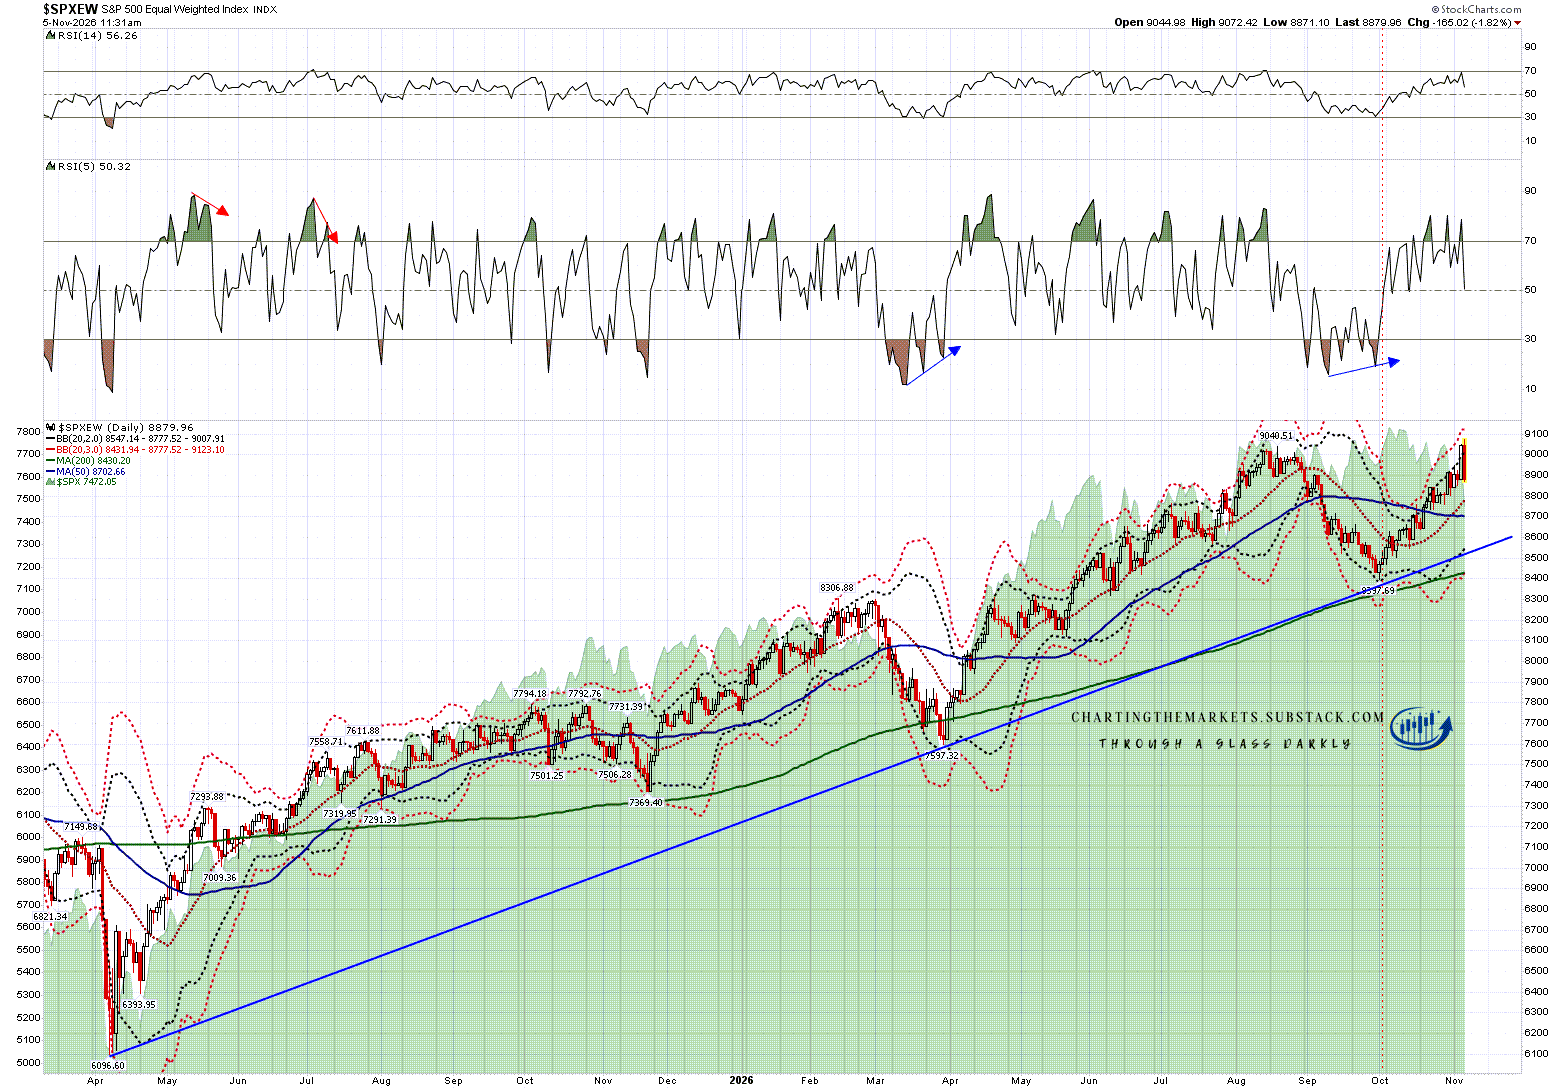
That was a nice rally yesterday, and I was surprised and impressed that $SPXEW, the S&P with all components given equal weight, even made a new all time high, though that bullish candle has been entirely reversed today and I’d note that the high retest has now set up a beautiful possible double top on this chart. That does underline the point I was making yesterday that US shares excluding Tech have been on an impressive uptrend since the start of October and have not obviously turned down yet, though that may now be changing:
SPXEW daily chart:
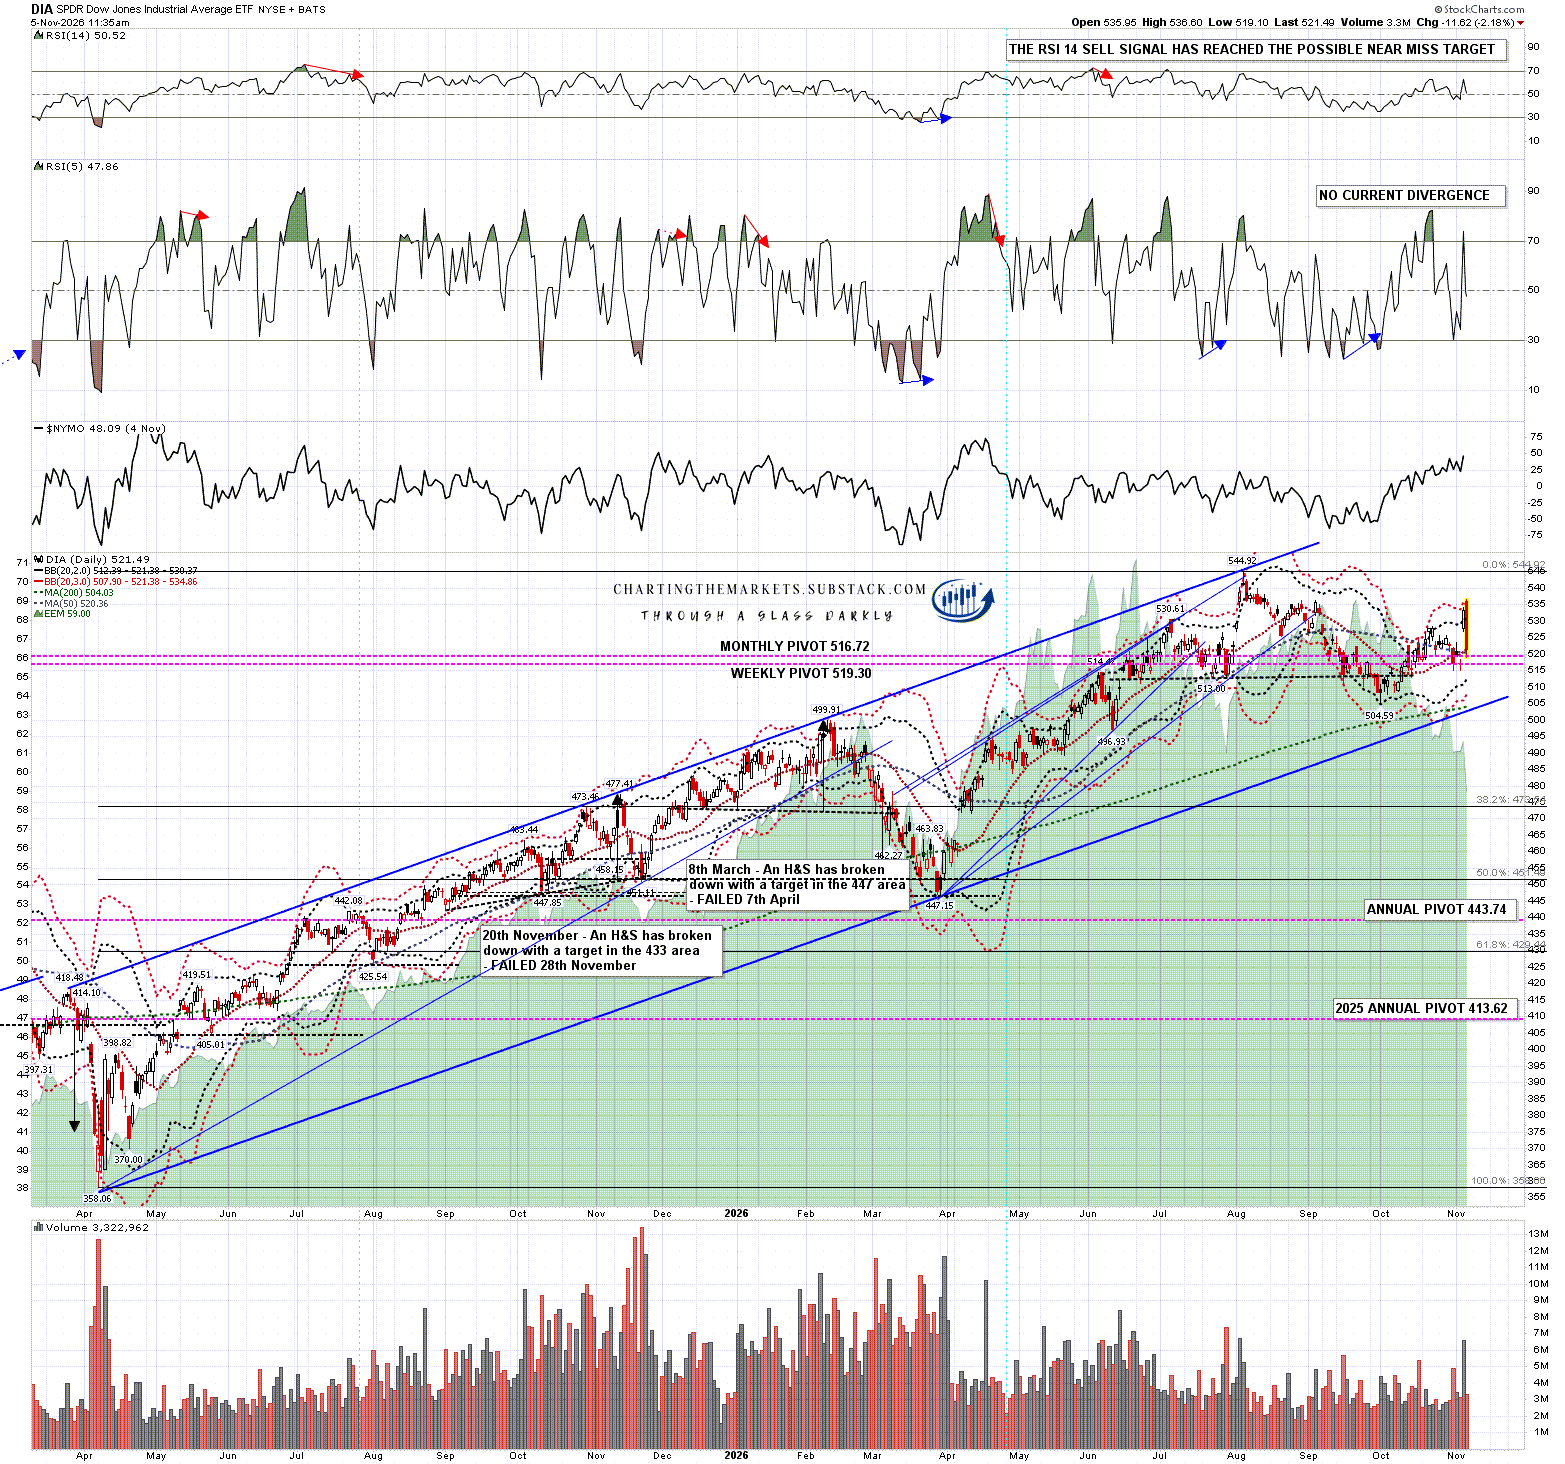
DIA also delivered a big move, and even managed to reached the daily 3sd upper band at the high, though almost the entire move including the large opening gap up was also given back today:
DIA daily chart:
So what happened? Well as I mentioned in my posts on Monday and Wednesday, any sustainable rally would need to be led, or at least joined, by Tech, and the Tech move off the lows was comparatively very modest. I was warning in my premarket video this morning that the lack of Tech participation was a bad sign and well, here we are.
In my post on Monday I was saying that a rally was likely after the full hit of the daily 3sd lower band on Friday for the fourteenth time in the last eighteen months, and gave the following stats on past performance when that happened previously:
9x delivered a rally that broke back over the daily middle band (currently 7723)
of which five delivered new all time highs, including a further two on the way to those new all time highs.
2x delivered a decent rally that peaked on the next trading day
1x delivered a decent rally that peaked on the second trading day
1x delivered two more days of 3sd lower band tests into a big swing low
On this basis, assuming we don’t see serious lower lows today, which currently looks like a safe assumption, there is therefore about a 40% chance that a swing low was made on Friday, leading to a new all time high. There is about a 35% chance that a rally has started that will deliver a break back over the daily middle band, but not a new all time high. There is about a 25% chance that this rally will peak today or tomorrow before making a new low.
Friday’s fourteenth hit delivered a rally that peaked on the third day, possibly delayed by the midterms, before delivering a lower low today.
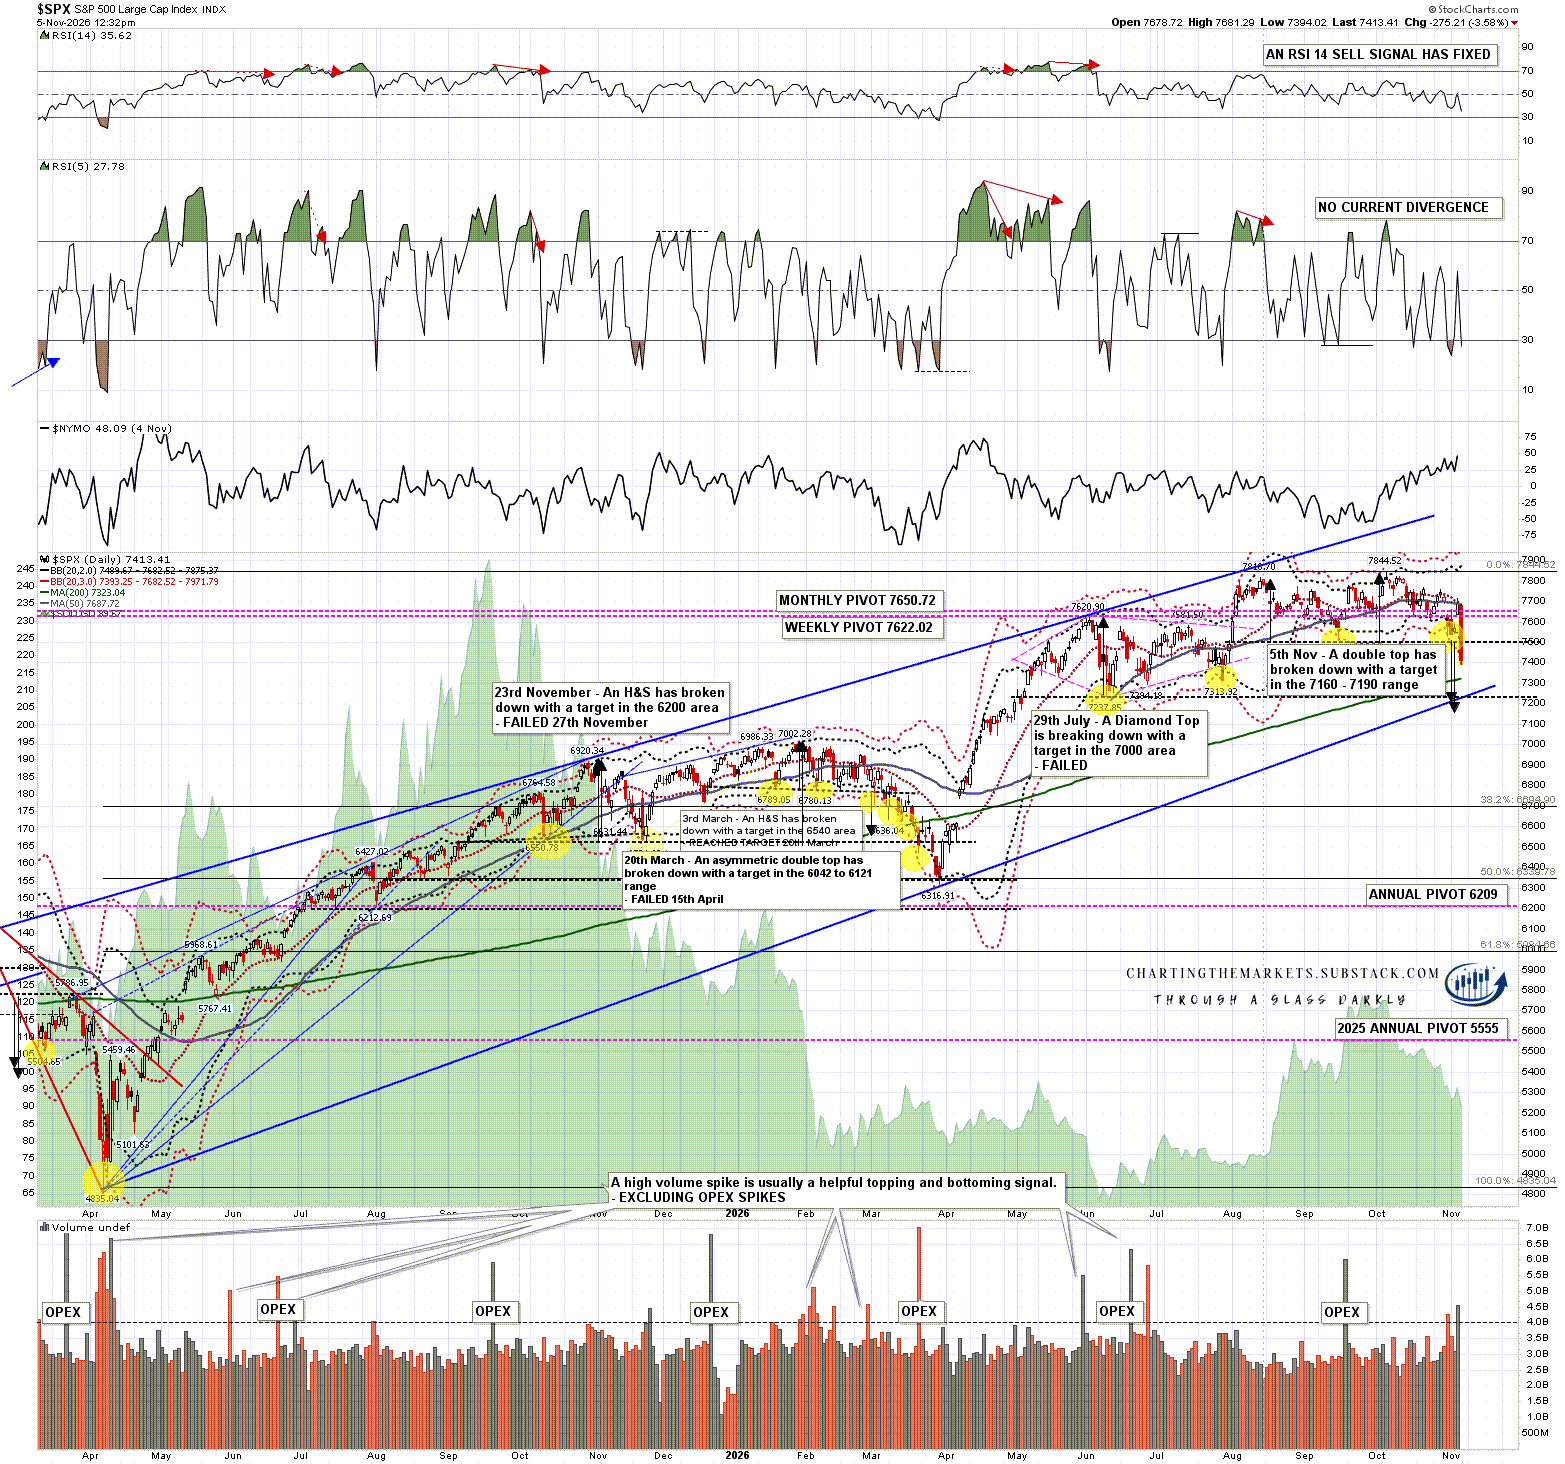
The double top setup on SPX that I was looking at on Monday broke down today with a target in the 7160 to 7190 range.
Now this doesn’t mean that target will be reached, and I’d note that SPX delivered a (fifteenth) test of the daily 3sd lower band at the low today, after a clear test and fail of key resistance at the daily middle band yesterday. That resets the clock, sets up another likely rally from the lows today, and based on the last eighteen months the odds are now as follows:
9x delivered a rally that broke back over the daily middle band (currently 7723)
of which five delivered new all time highs, including a further two on the way to those new all time highs.
1x delivered a decent rally that peaked on the third trading day
2x delivered a decent rally that peaked on the next trading day
1x delivered a decent rally that peaked on the second trading day
1x delivered two more days of 3sd lower band tests into a big swing low
On this basis, with the low probably in or close at the lows today, there is therefore about a 38% chance that a swing low was made today, leading to a new all time high. There is about a 32% chance that a rally has started that will deliver a closing break back over the daily middle band, but not a new all time high. There is about a 30% chance that this rally will peak by the close on Monday before making a new low.
If we continue going down hard today then we may see that double top target made in the next couple of days, but the odds increase that the next significant low will end the move.
SPX daily chart:
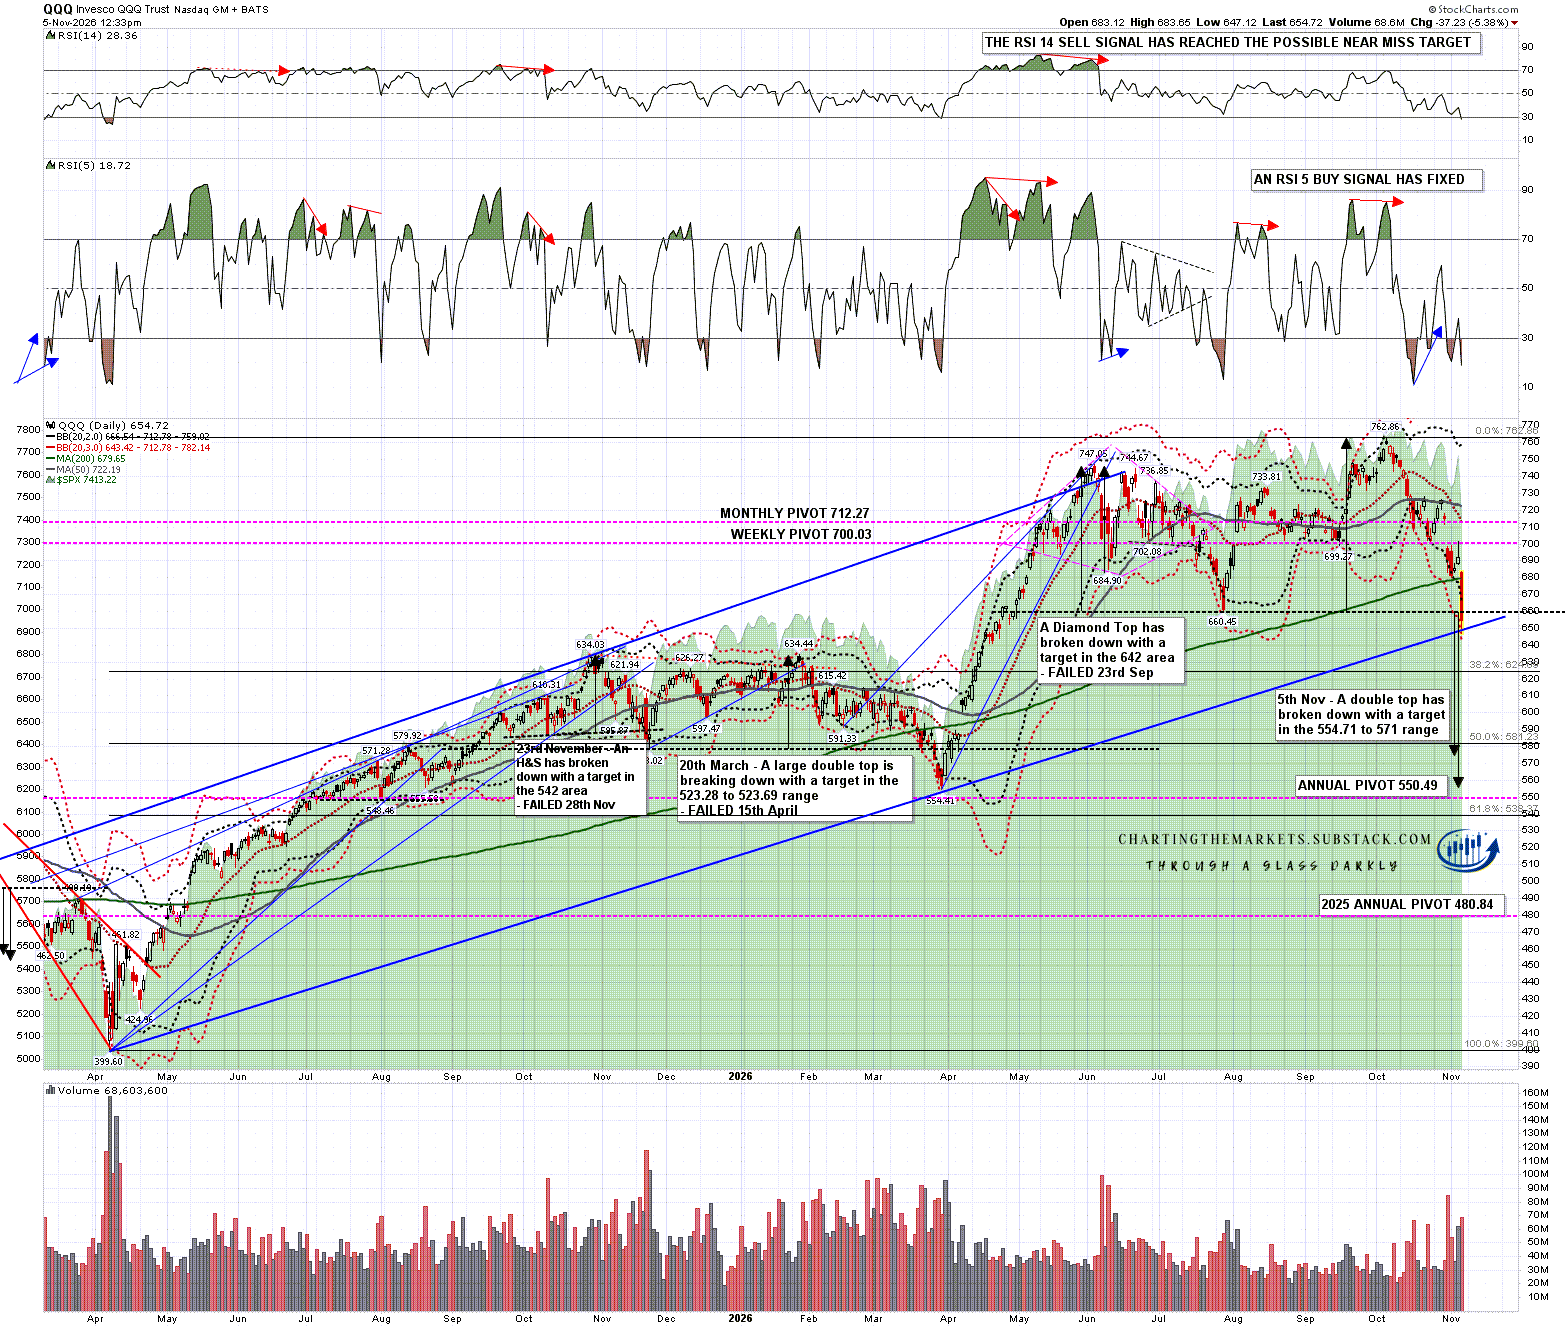
So what about Tech? Well QQQ and SOX (Philadelphia Semiconductor Index) both also hit their daily 3sd lower bands today, so we may see decent rallies there too. I was looking at a large double top setup on QQQ on Monday and that has also now broken down with a target in the 554.71 to 571 range, getting close to the annual pivot at 550.49, and at or a bit past the 50% retracement of the move up from the April 2025 low. Rising support from that April 2025 low was also broken slightly at the low today on QQQ.
QQQ daily chart:
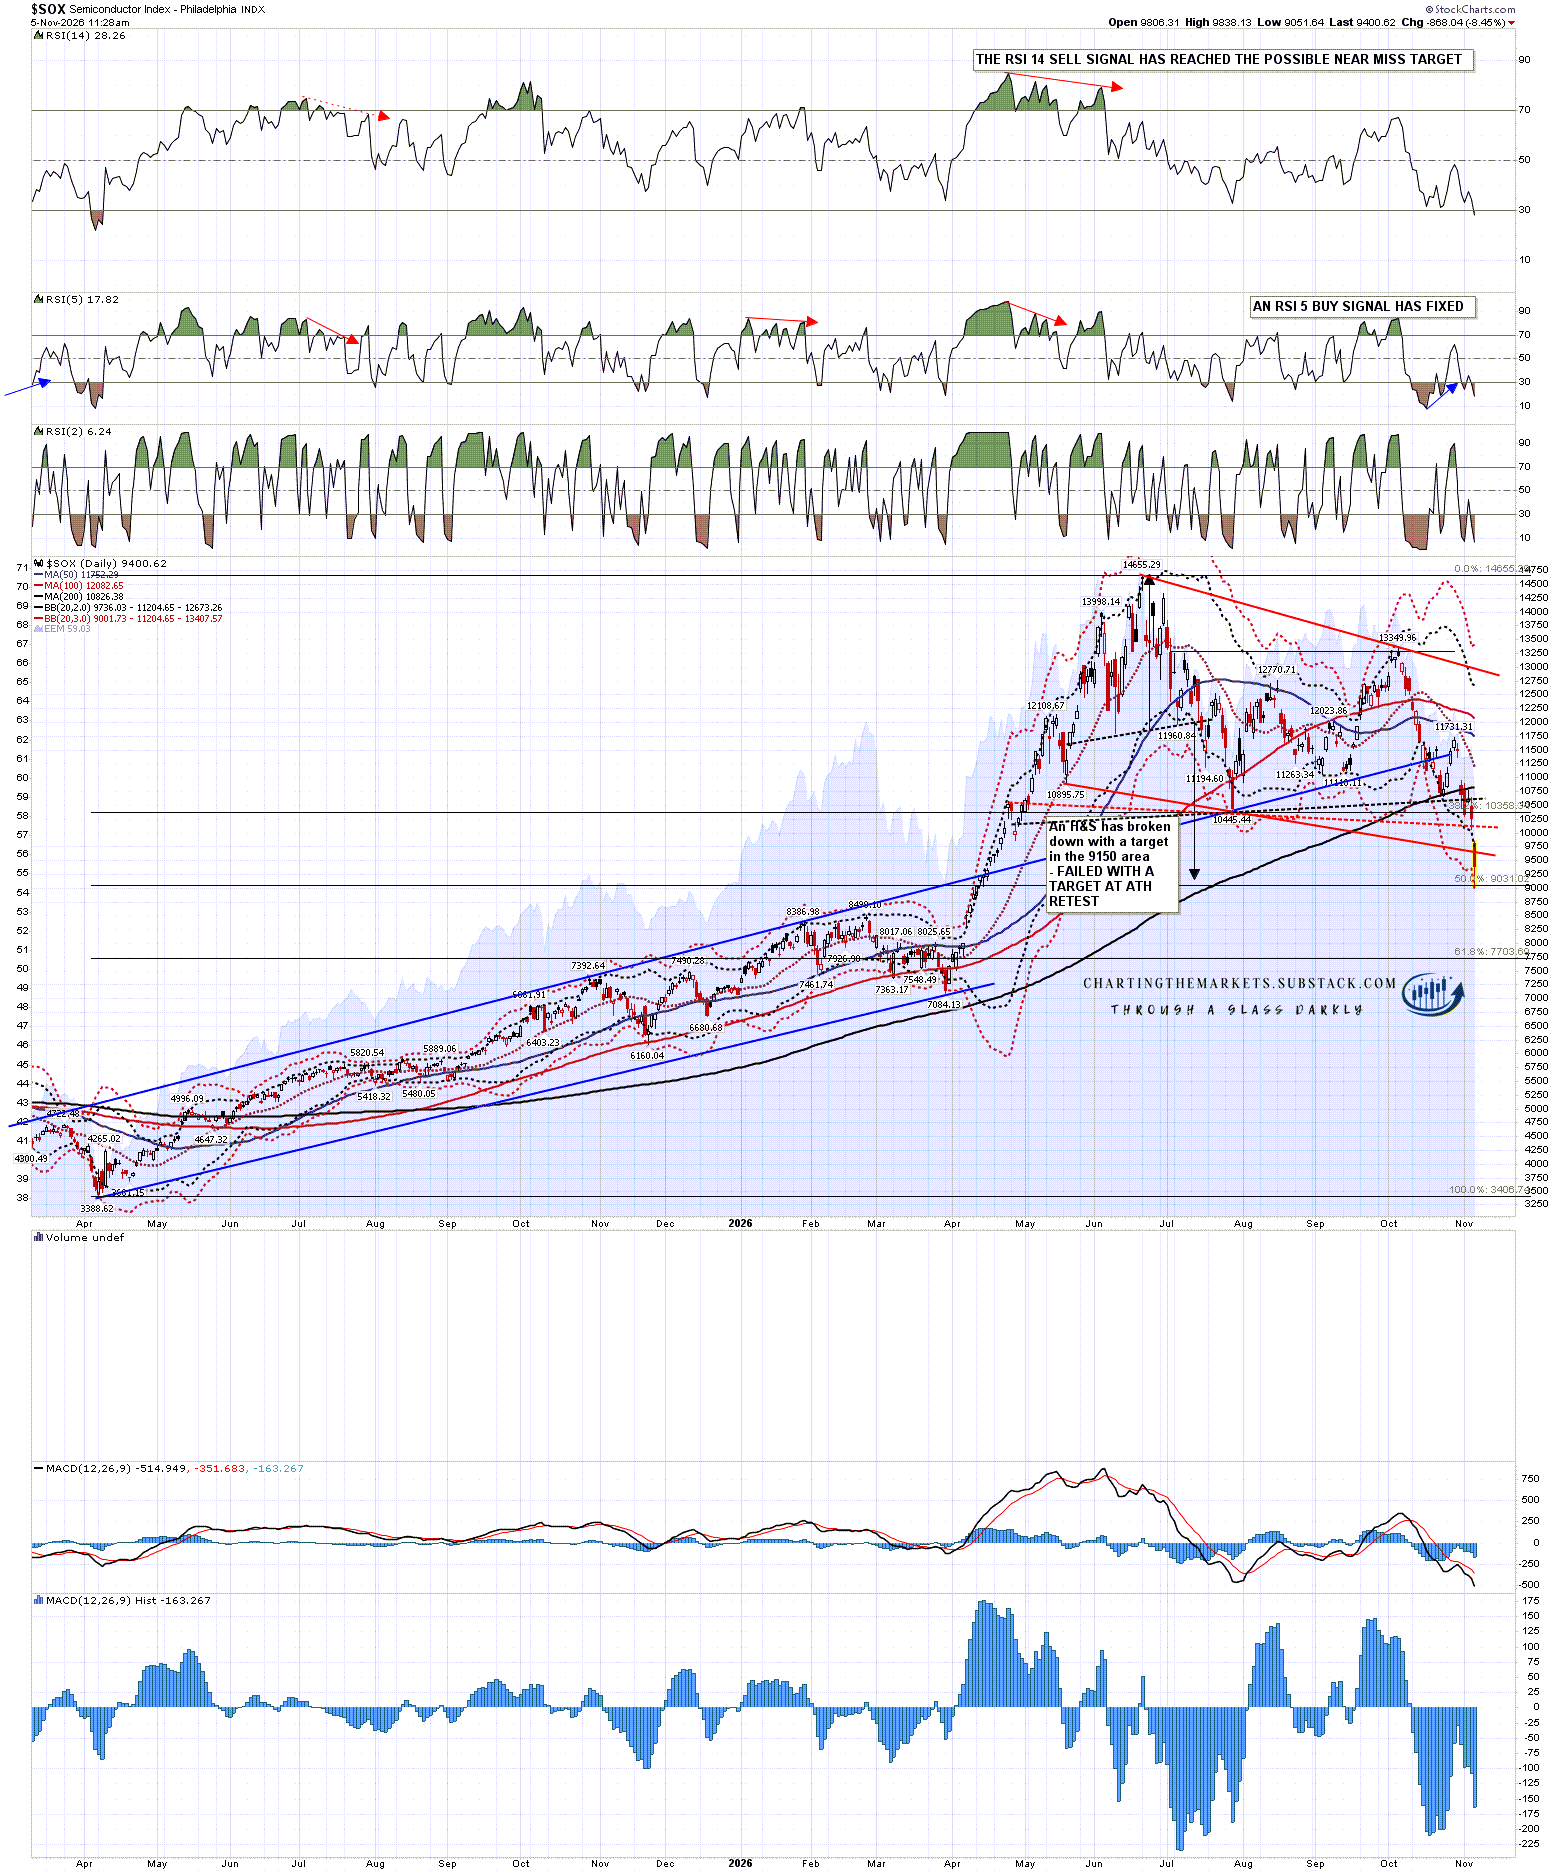
In my post yesterday I was looking at the Philadephia Semiconductor Index (SOX) and mentioned that neither of the ideal overall bull flag support trendlines I had drawn in had been hit and my preferred (lower) option was hit earlier today before breaking.
This is a decent bull flag setup and the break below may be a bullish underthrow to make the flag low. If so SOX would make a big low in this area before starting a move back to retest the all time high.
That‘s a decent option but it’s worth remembering that 30% of decent quality bull flags break down rather than up and, as I also mentioned yesterday, if this break down is sustained then next next obvious support is 6% lower in the 8500 area.
SOX daily chart:
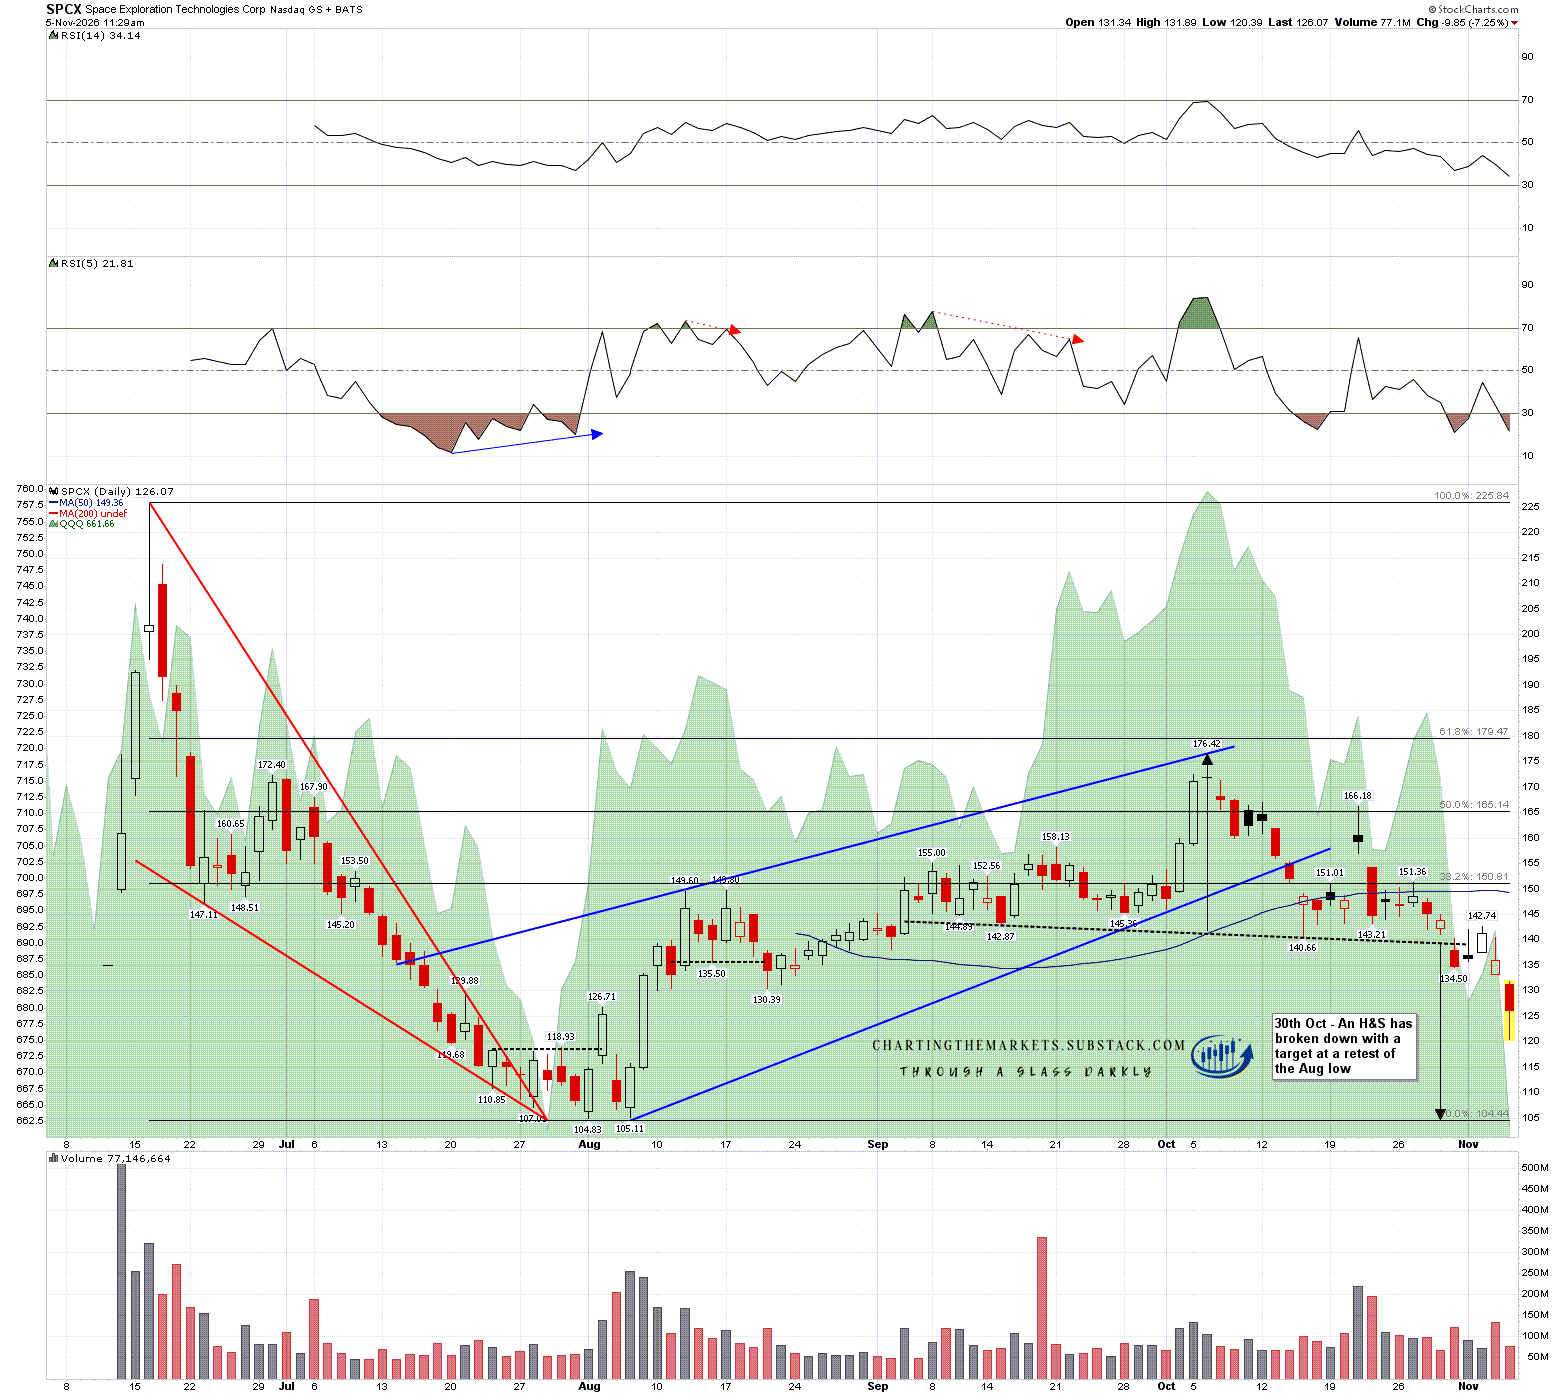
Lastly my half horseman from Monday’s post was the H&S that had broken down on the SPCX daily chart looking for a target at a retest of the August (and lifetime) low at 104.83. That saw a low at 120 earlier today which put that about halfway to target.
I was asked on Monday what a half horseman would look like and in this case I’m thinking that would look like a chubby little Texan on a Burro :-)
SPCX daily chart:
The new lows on SPX, QQQ and DIA today are opening the door to what could be a much larger retracement led by Tech over the rest of November. The other topping patterns I showed on DIA and IWM on Monday haven’t broken down yet but if they do they will open that door wider.
Am I thinking this might be the start of a full bear market? Too early to say but not really seeing the setup for that yet.
If you like my analysis and would like to see more, please take a free subscription at my chartingthemarkets substack, where I publish these posts first. I also do a premarket video every day on equity indices, bonds, currencies, energies, precious commodities and other commodities at 8.45am EST, but only for paying subscribers. Other places to find me are my page on the platform previously known as twitter, and my YouTube channel.


No comments:
Post a Comment