
In my post yesterday I was looking at the diamond top on the SPX daily chart which was starting to break down, and then went on to close the day with a clear break below it. The falling and possible bull flag channel on TSLA also broke down by the end of the day. There are now a lot of fixed downside targets on equity indices so today I’m going to lay out all the main ones that I am watching.
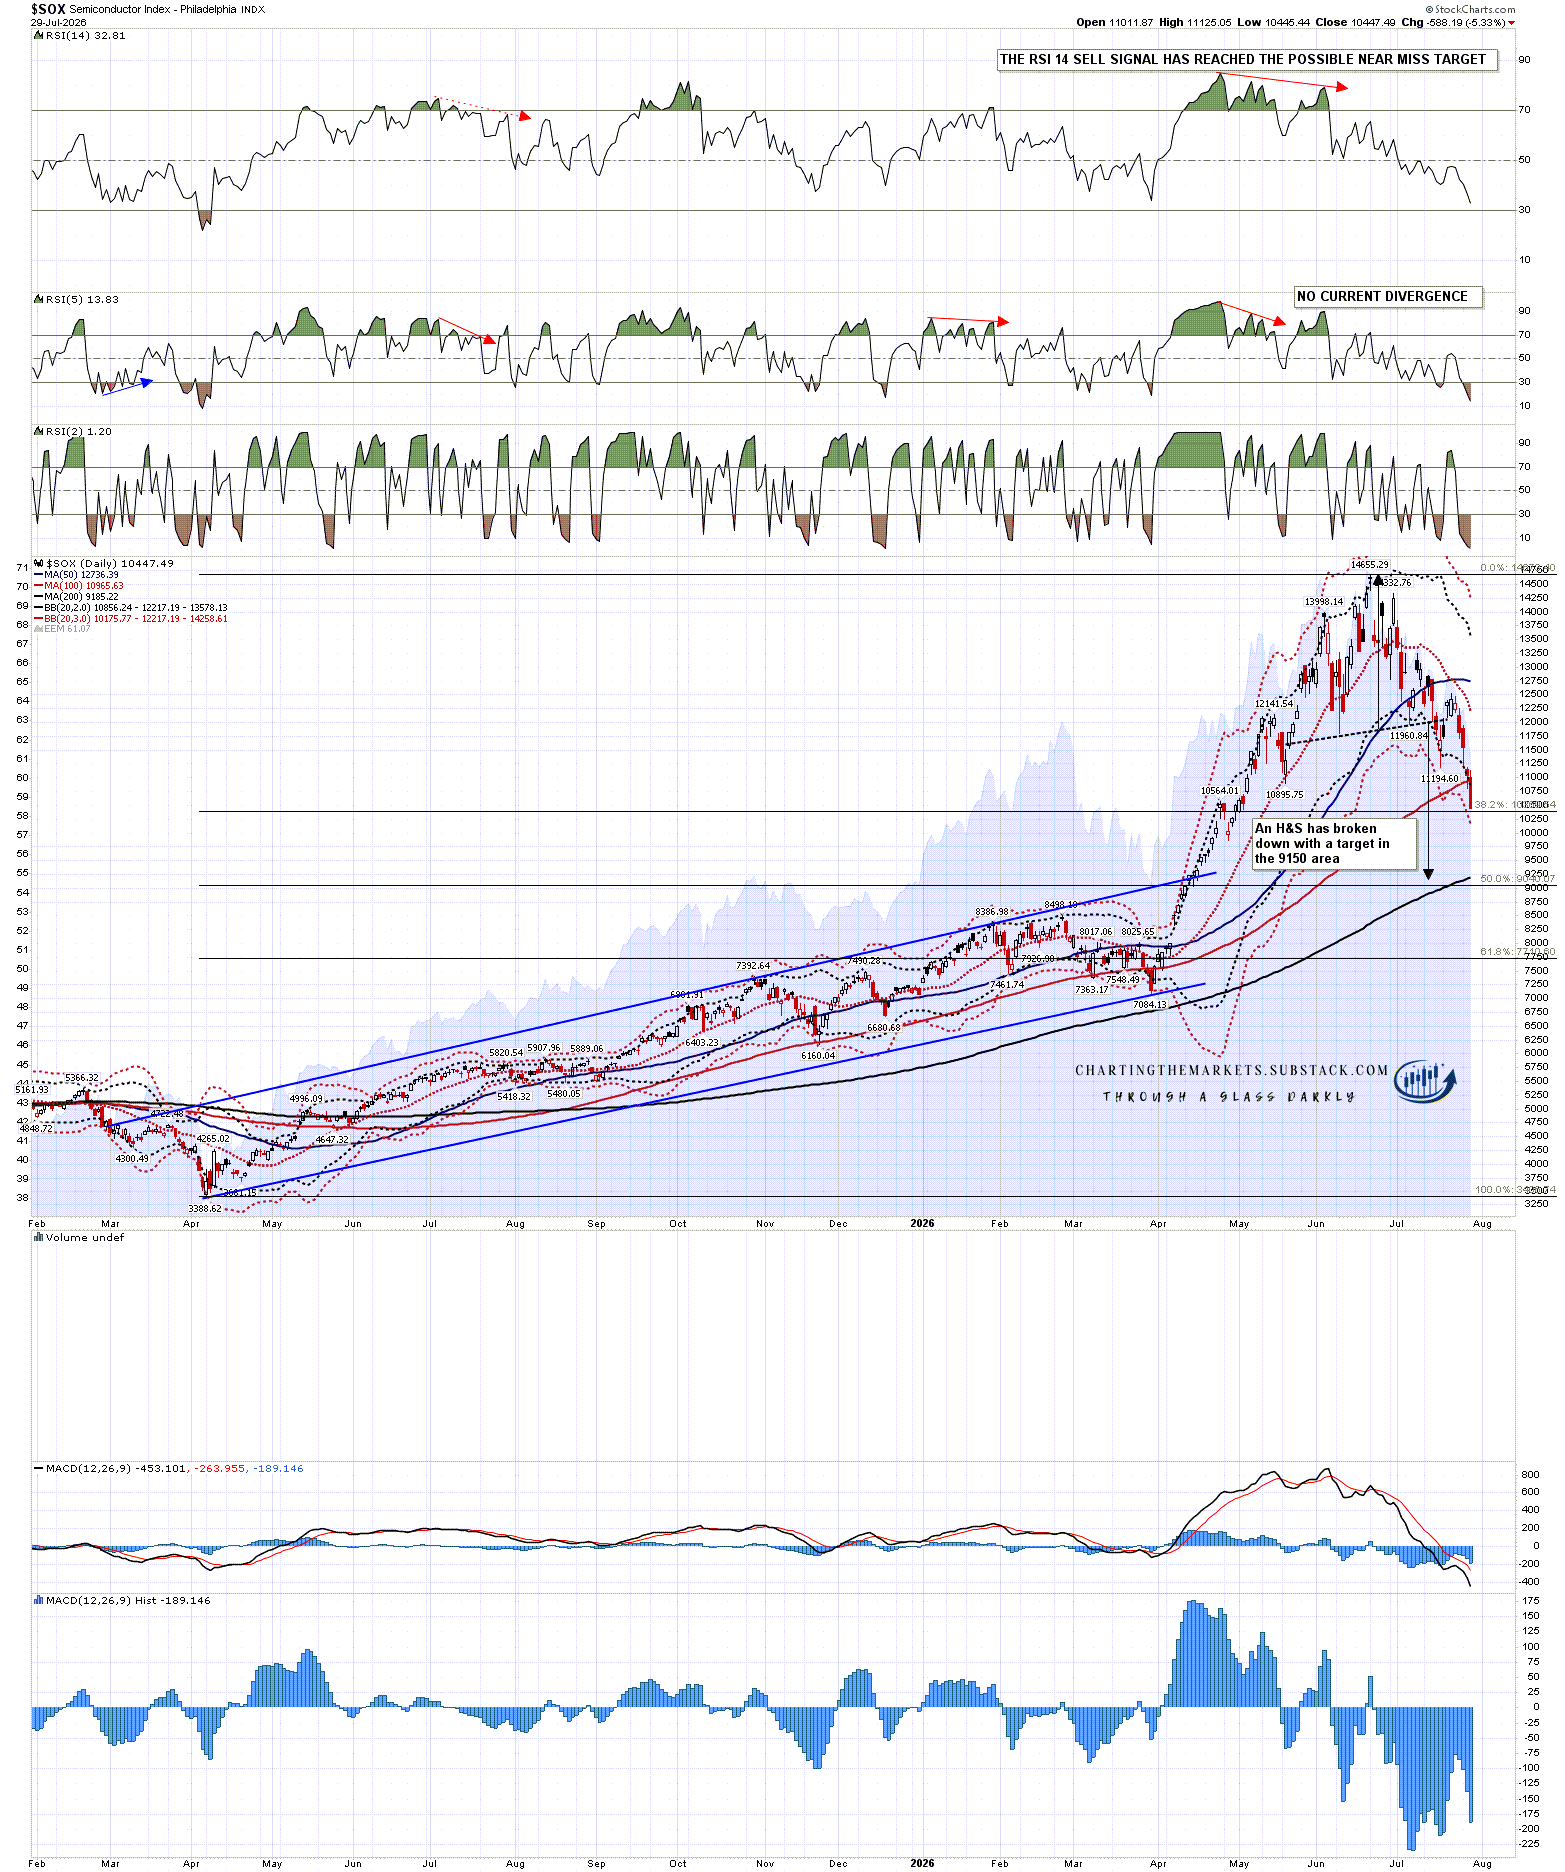
This decline is led by Tech, so the first target is the one the H&S that I have been posting on the Philadelphia Semiconductor Index (SOX). That target is in the 9,150 area, and I can’t see any reason to think that target won’t be reached.
SOX daily chart:
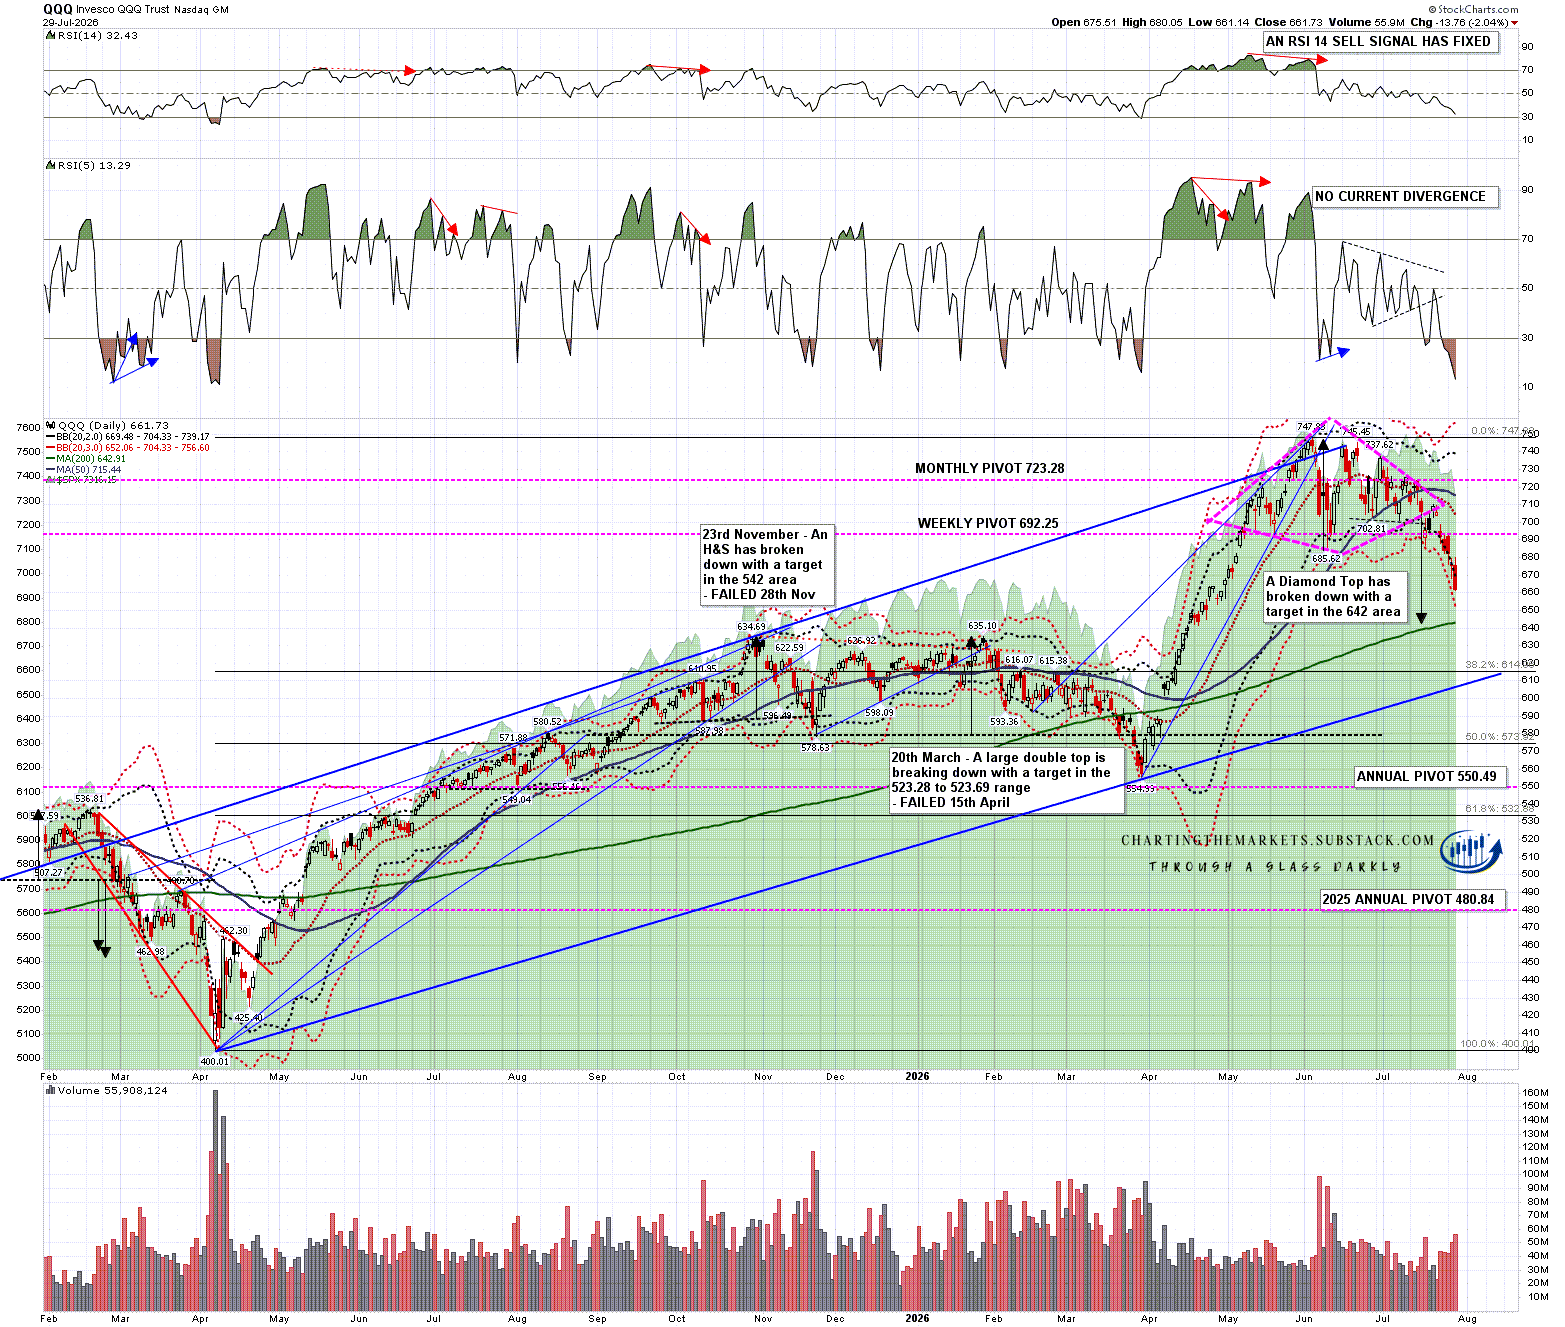
The other main Tech index is NDX if course and on QQQ, the NDX ETF, the diamond top target there is in the 642 area. That’s getting close, and if SOX, SPX and so on are to reach their targets I’d expect QQQ to go lower. The obvious next target would be the rising support trendline from the April 2025 low, currently on the 607 area.
QQQ daily chart:
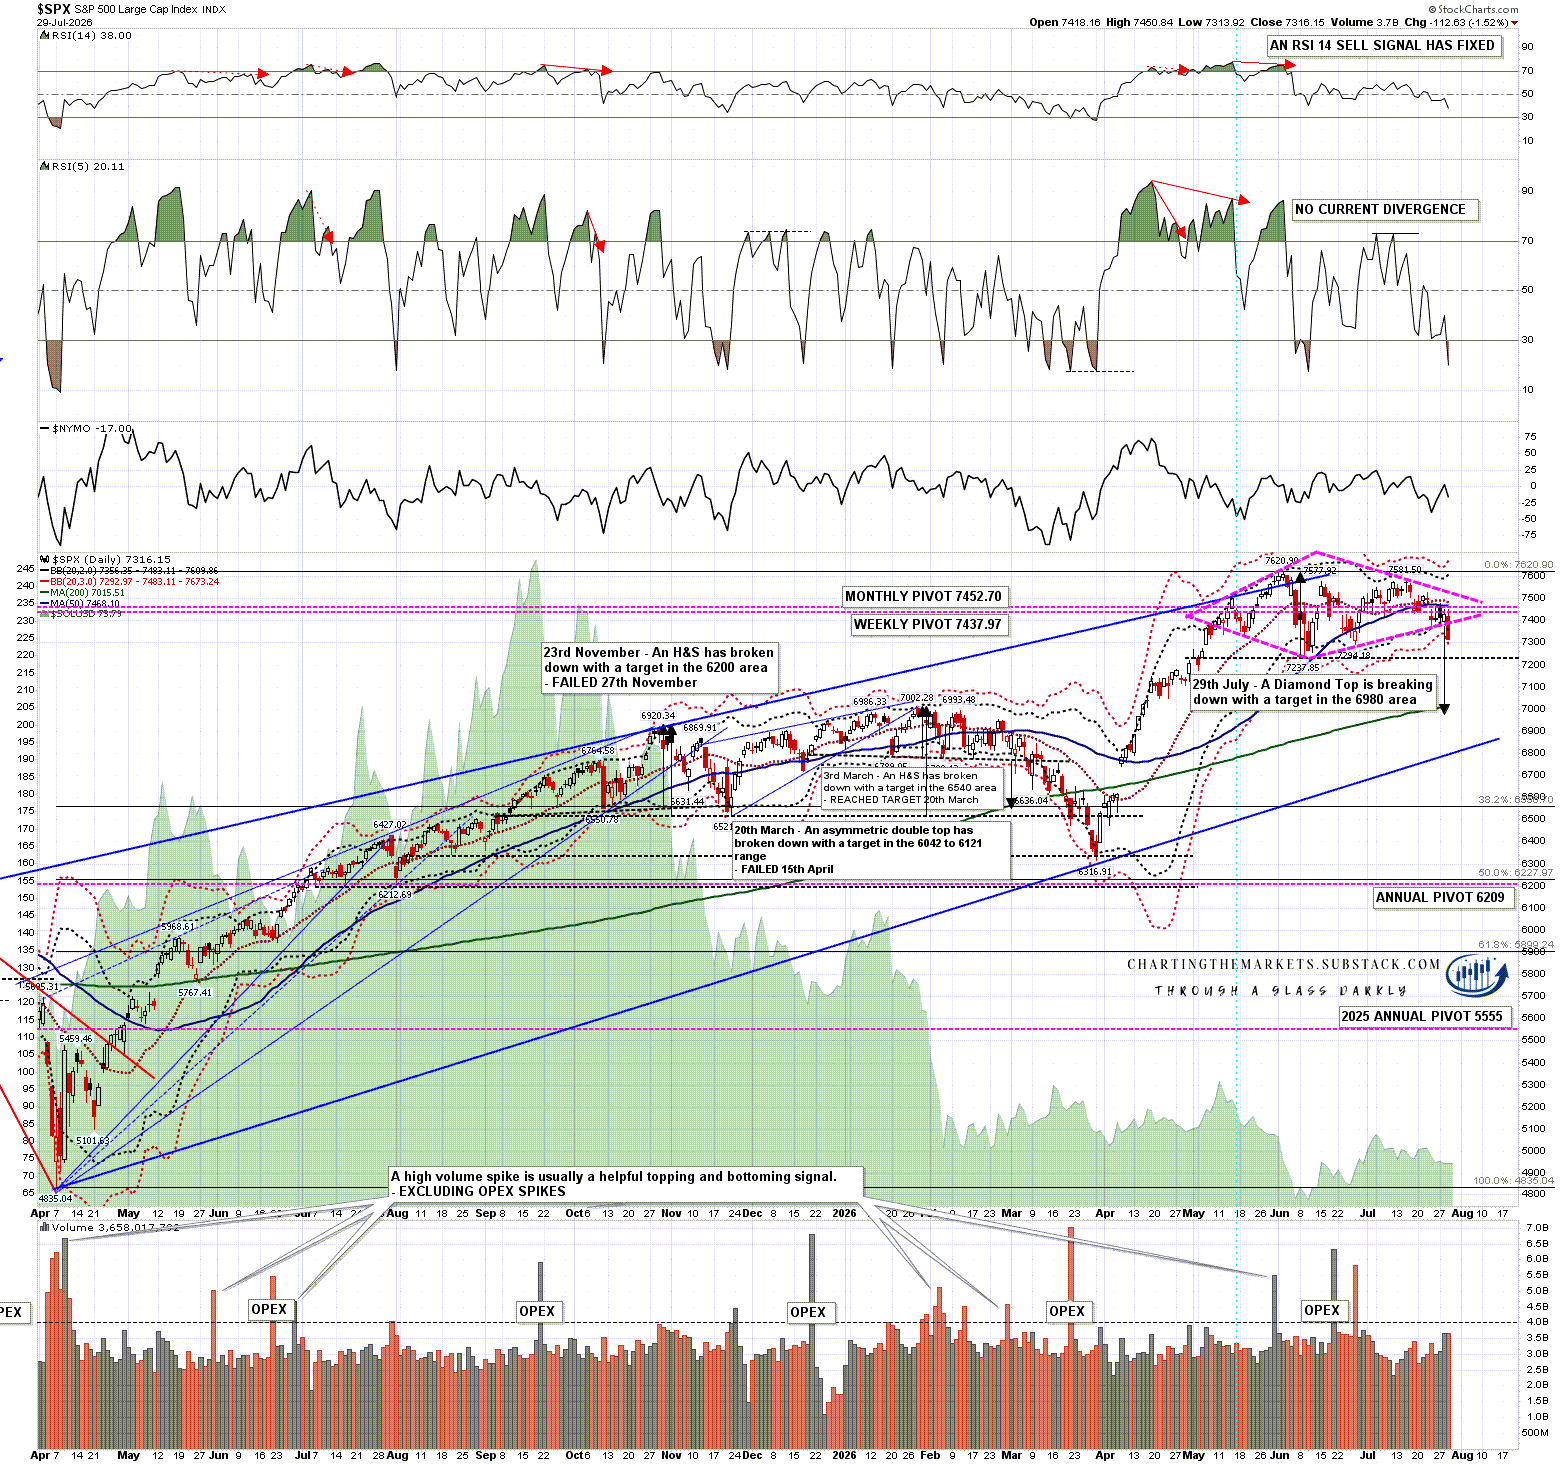
On SPX, with a large Tech component, the diamond top target is in the 6980 area.
SPX daily chart:
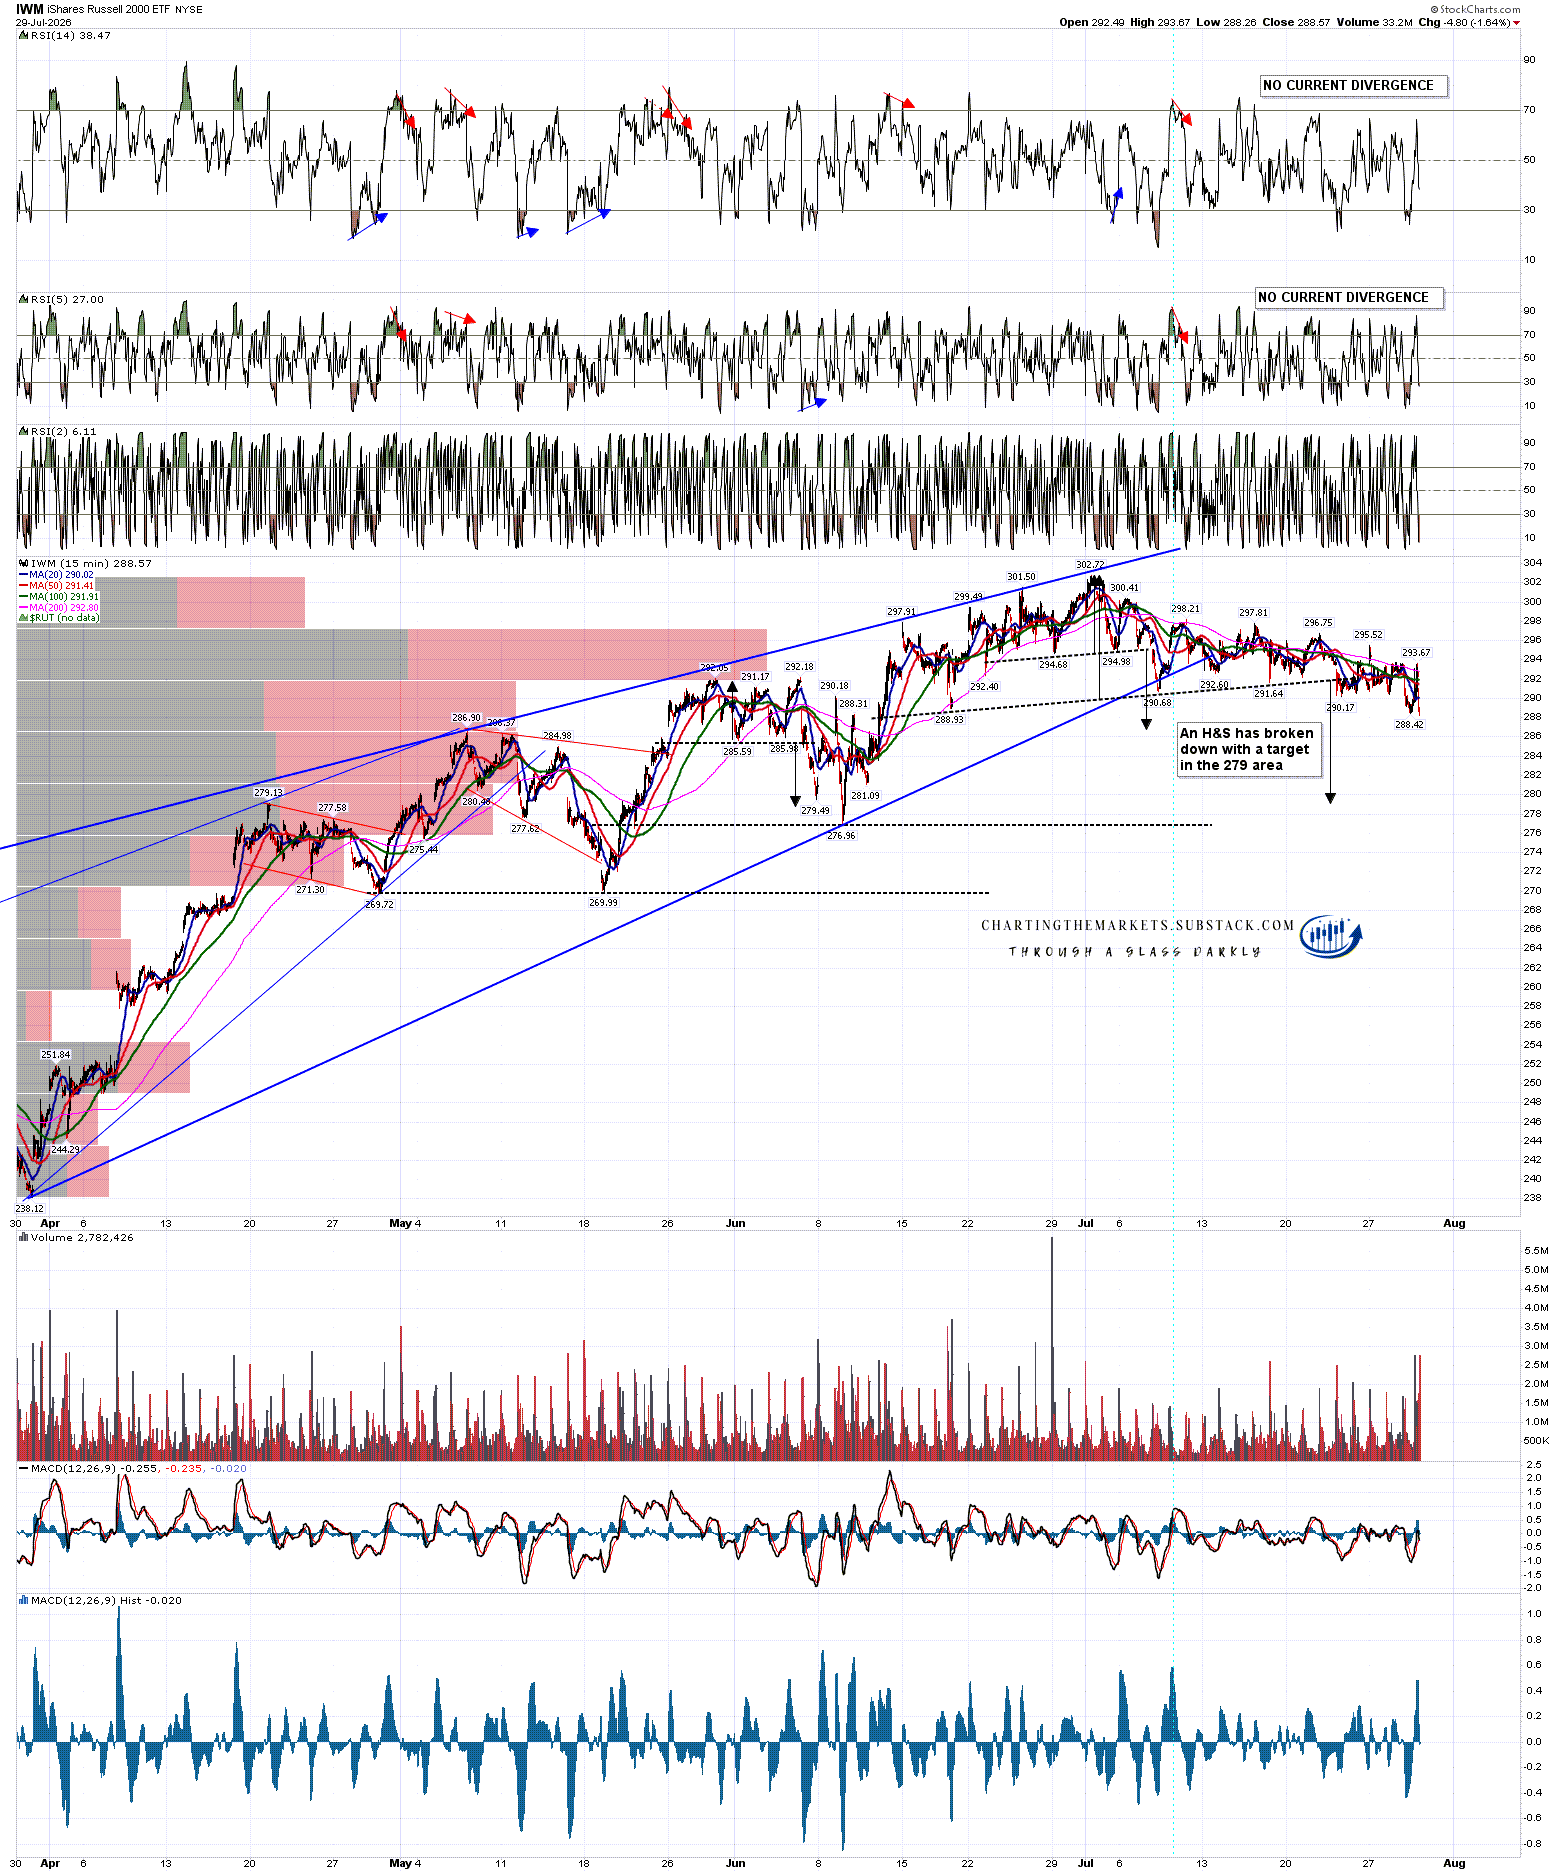
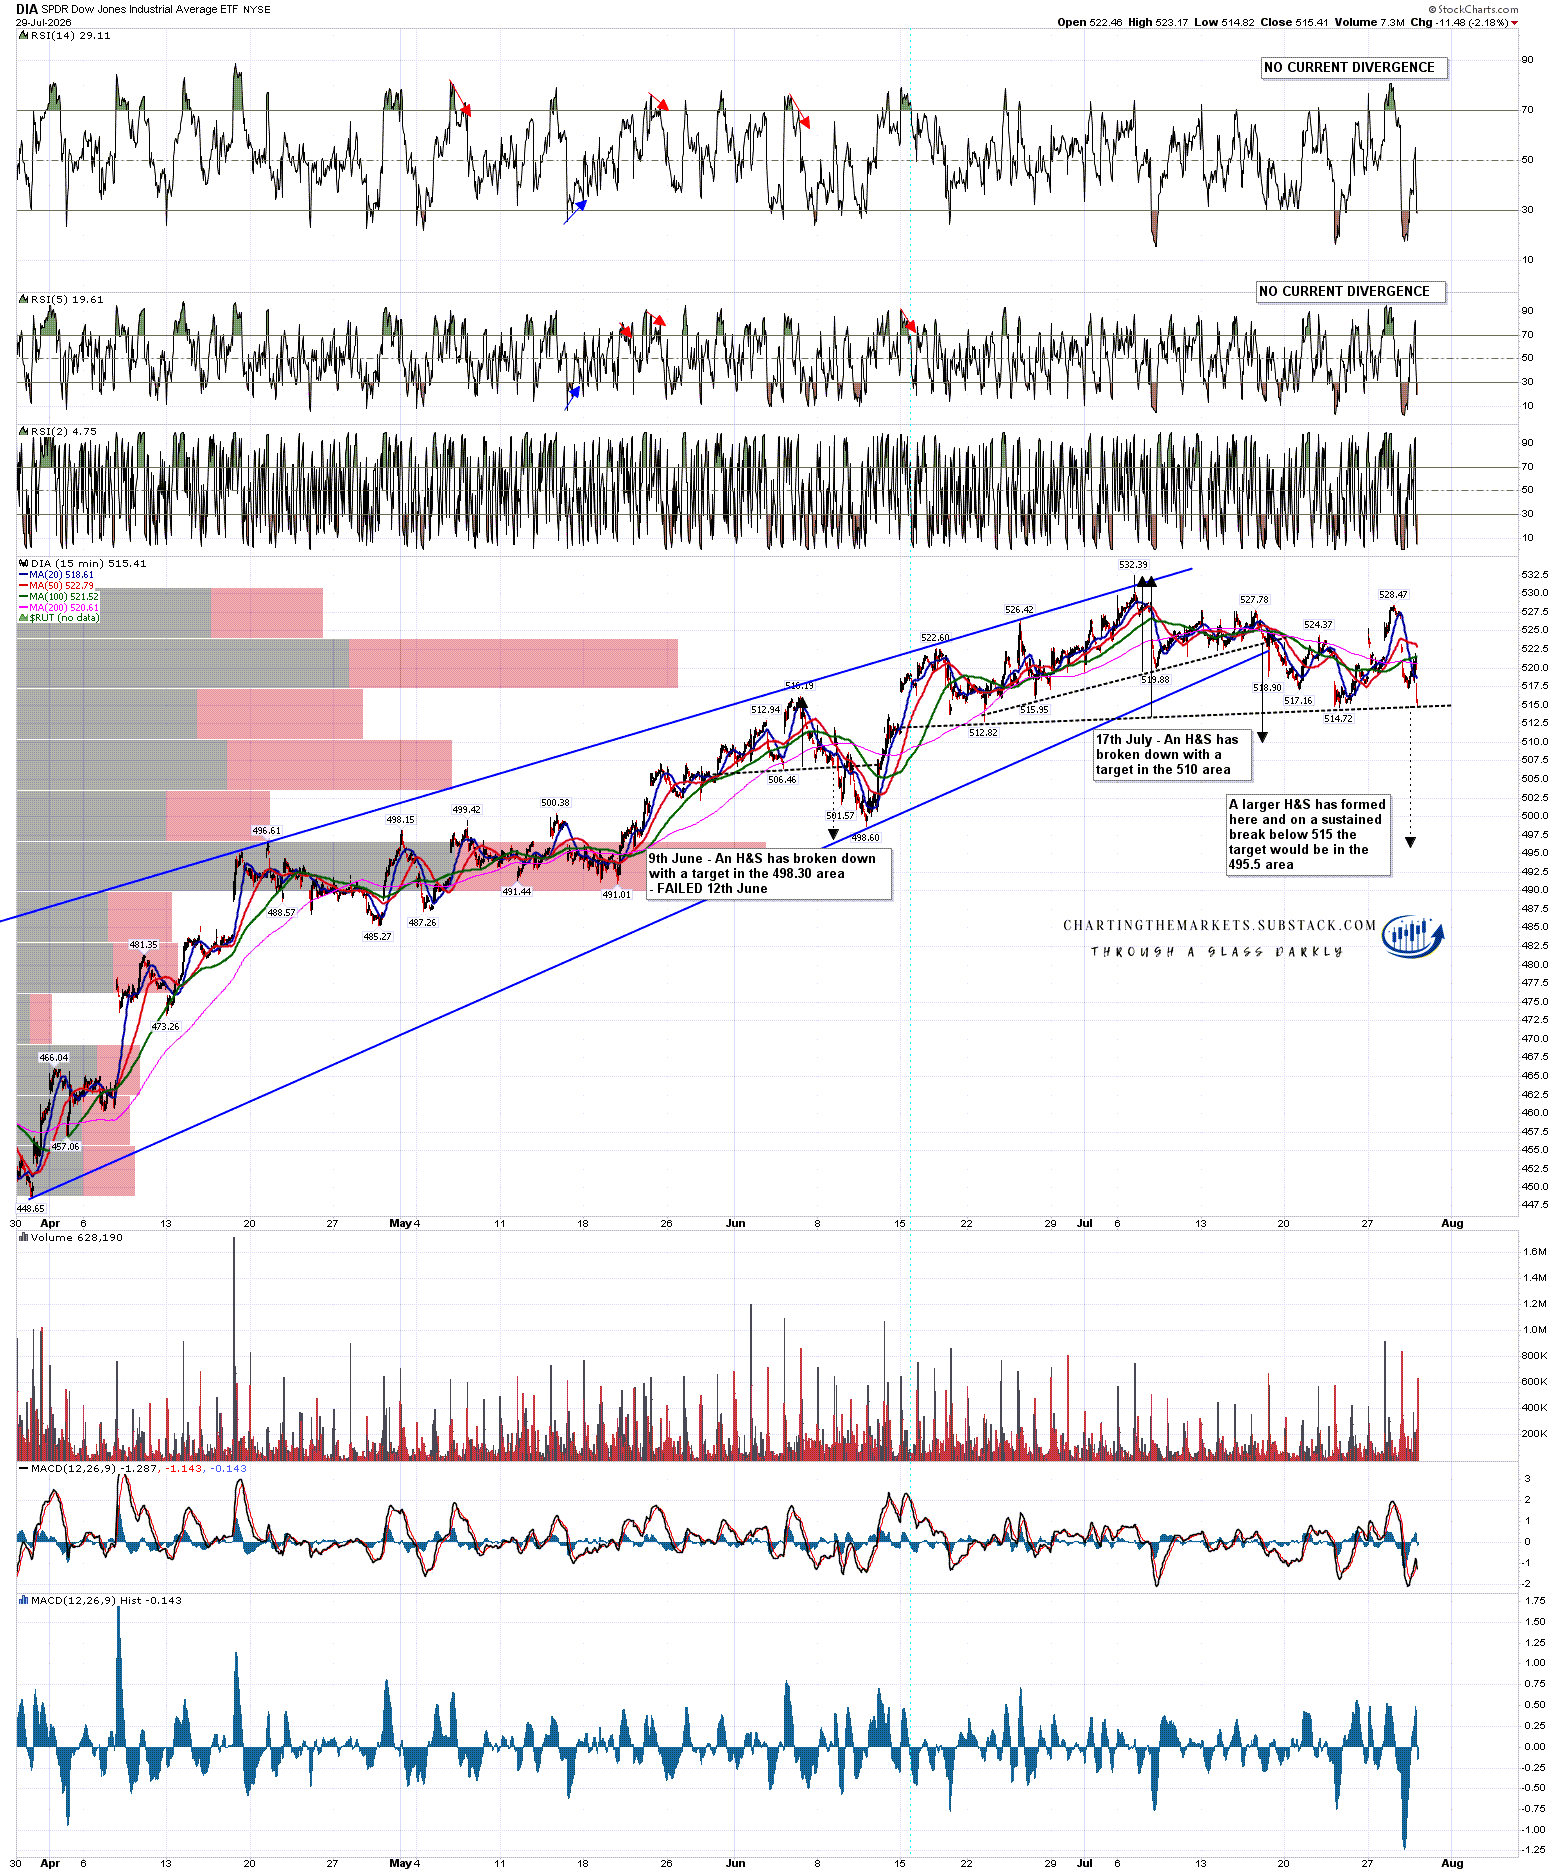
The downside targets on IWM and DIA are more modest, as the Tech component is lower, and I’m showing these on the 15min charts relative to the move up from the late March low.
On IWM an H&S has broken down with a target in the 279 area.
IWM 15min chart:
On DIA a small H&S has already broken down with a target in 510 area. A larger H&S has now also formed and was testing the neckline at the low yesterday. On a sustained break below that neckline the larger H&S target would be in the 495.5 area.
DIA 15min chart:
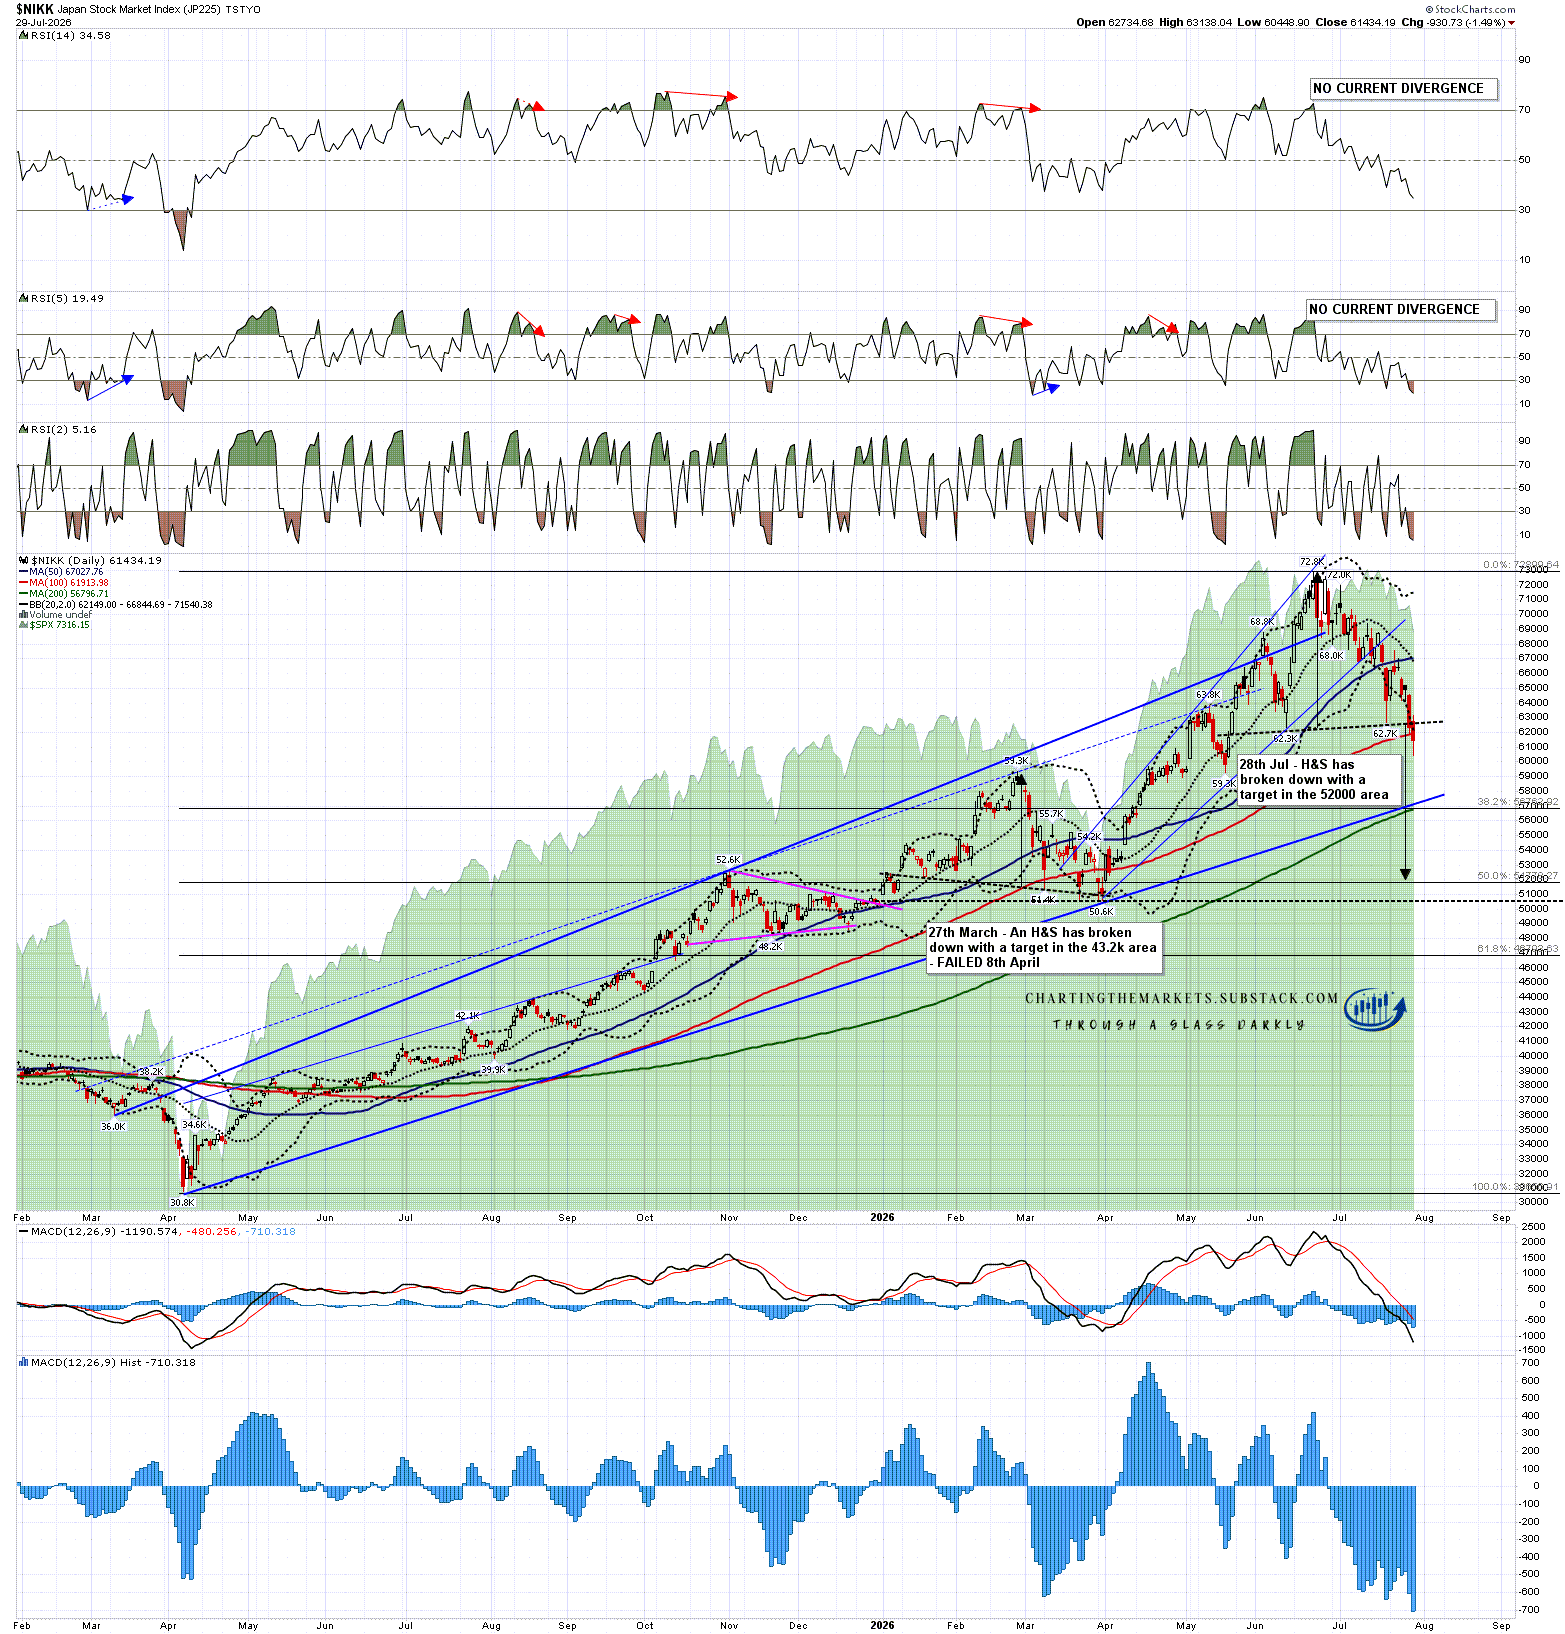
My last chart today is the Nikkei 225, which has broken down this week with a target in the 52,000 area, close to a 50% retracement of the move up from the April 2025 low.
NIKK daily chart:
If you like my analysis and would like to see more, please take a free subscription at my chartingthemarkets substack, where I publish these posts first. I also do a premarket video every day on equity indices, bonds, currencies, energies, precious commodities and other commodities at 8.45am EST, but only for paying subscribers. Other places to find me are my page on the platform previously known as twitter, and my YouTube channel.


No comments:
Post a Comment