
I was promising a post on why the AI bubble is very likely a speculative bubble last week and I’ve been giving that some thought. The subject is too large really to fit into one post really so I have decided to split this into three posts as follows:
Why is there likely a speculative bubble in equities here, and why is it a bubble in AI?
Why is the AI bubble likely within a year or two of bursting, and which Tech companies are most likely to survive the bursting of the bubble?
How have speculative bubbles in equities topped out in the past?
The first thing to say here is an important caveat that I avoid words like certain or definite when talking about markets. There is little certainty in the world and even less in the markets. There is always a chance that even if something walks like a duck, looks like a duck and quacks like a duck, that it might turn out nonetheless not to be a duck. There is a equally always a chance that things might actually be different this time, even when that will generally turn out not to be the case.
Why is there likely a speculative bubble in equities here?
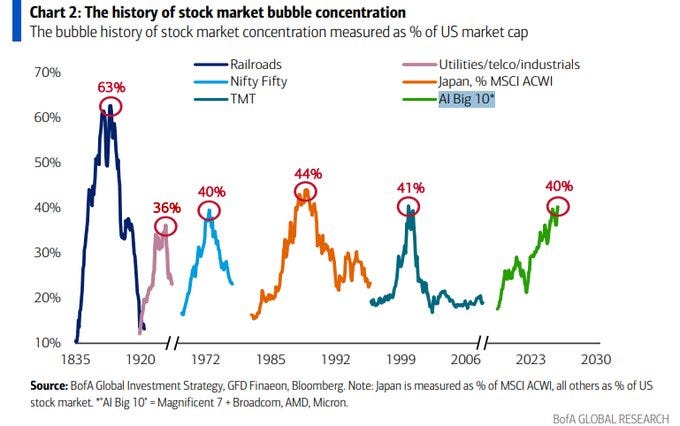
The chart below shows the the six times in the past two centuries when a small number of big companies has grown to a very large percentage of overall US market capitalisation. The previous five and the current spikes were and are:
Railways - Panic of 1857
Utilities/Telco/Industrials - 1929 Crash
Nifty Fifty - 1973/4 Crash
Japan as % MSCI ACWI - 1987 Crash
Tech/Media/Telecom - 2000 Crash
AI Big 10 (Mag 7 + Broadcom, AMD & Micron) - 2027-8 Crash?
This is a very strong indicator of a speculative bubble in stock markets here.
The history of stock market bubble concentration 1835 - 2026:
The Shiller PE Ratio is a Cyclically Adjusted Price to Earnings Ratio (CAPE) developed by Yale Economist Robert J. Shiller. It divides a market index’s price (usually the S&P 500) by the average of the past ten years of earnings, adjusted for inflation. It can also be used for individual stocks and is principally used to assess likely future returns from equities on timescales over 10 to 20 years, with higher than average CAPE values implying lower than average long-term average returns.
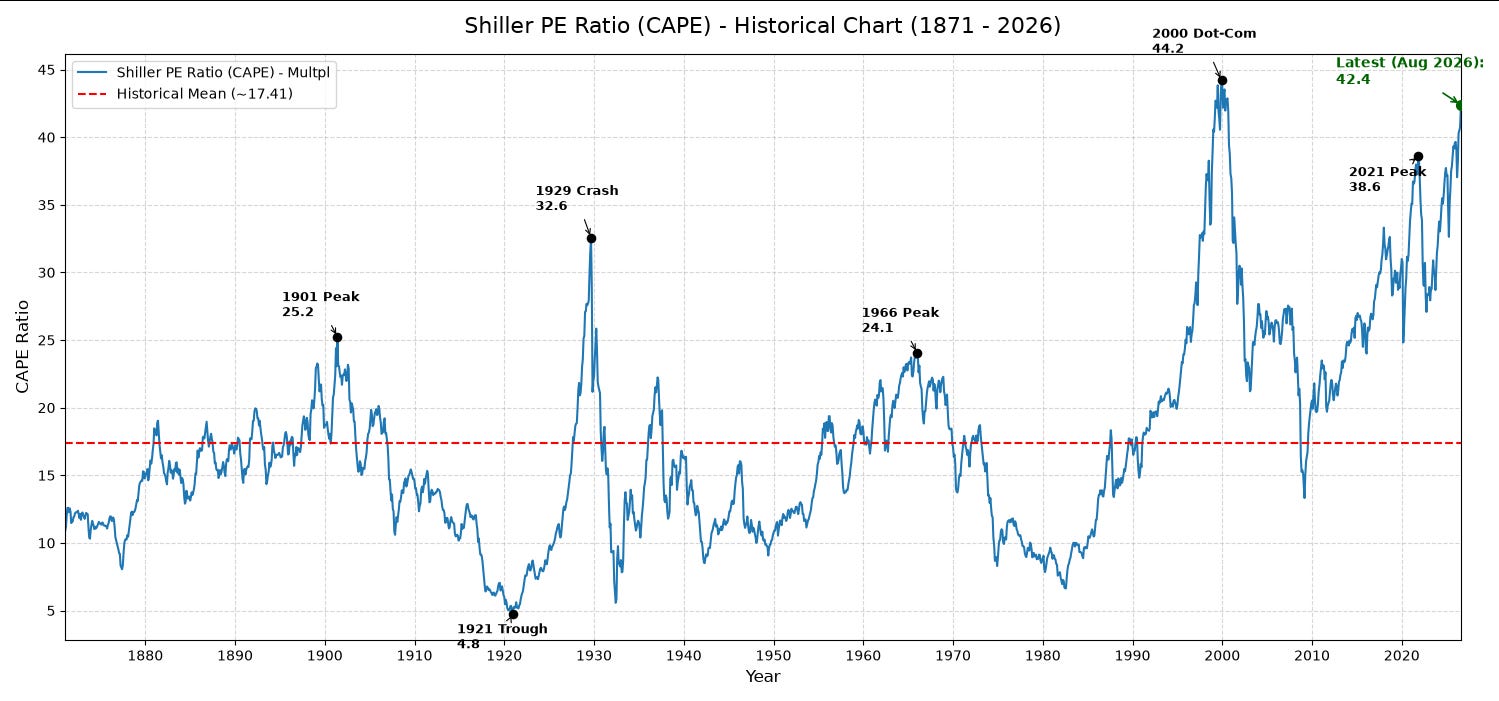
This is a very well respected and widely used valuation measure and there have been four big previous highs since the start in 1872 on the chart below. The Schiller PE after those highs performed as follows:
1901 high at 25.2 to 1921 trough at 4.8 (81% decline)
1929 high at 32.6 to 1933 trough at ~5.5 (83.1% decline)
1966 peak at 24.1 to 1982 trough at ~7 (70% decline)
2000 peak at 44.2 to 2009 trough at ~13.5 (69.5% decline)
The current high on the Schiller P/E reached 42.4 in August 2026 and hasn’t much higher to go to make a new all time high over the 2000 high at 44.2. Does this look like a major speculative bubble is currently in progress? Very much so, and the bubble high may well be close. All four of the last declines after the high made troughs below, and usually well below, the historical mean at 17.41. The smallest subsequent decline in CAPE was 69.5% and the largest was 83.1%. There’s no reason to think the next downcycle will be any different.
Shiller PE Ratio (CAPE 1871-2026:
The Buffett Indicator, also known as Market Cap to GDP was referred to by Warren Buffett in 2001 as ‘probably the best single measure of where valuations stand at any given moment’. The calculation is the total market value of all publicly-traded stocks in a country by the country’s Gross Domestic Product (GDP). The ratio provides an insight into the relative valuation of the market.
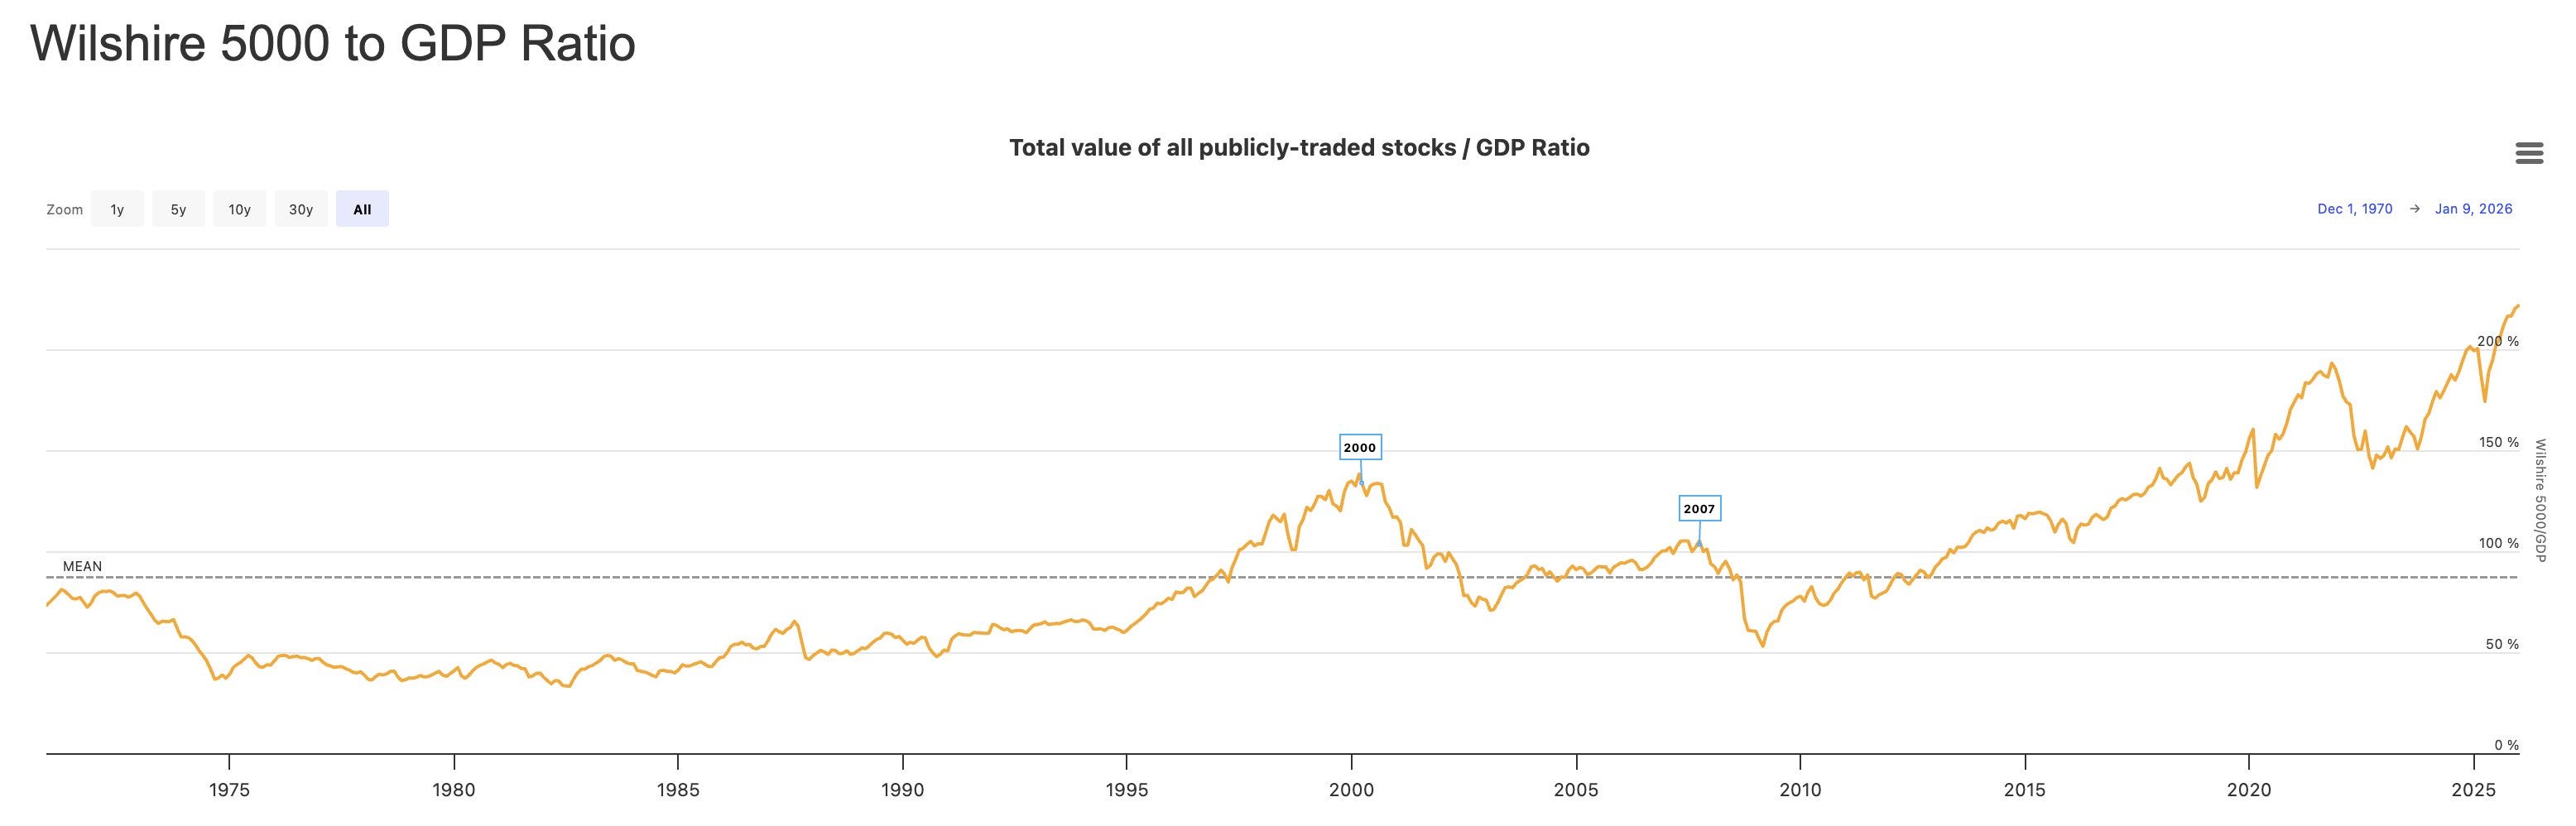
On the Buffett Indicator, with a mean in the 90% area, the first break over the mean since 1970 was in the dotcom bubble, reaching a high in the 140% area in 2000, then falling to a trough in 2009 in the 52% area. As of today this indicator is at 228.4, putting the current market well over 50% higher than the high in 2000. This is far into previously uncharted bubble territory.
Wilshire 5000 to GDP Ratio 1970 - Date:
Market Breadth is a measure of how many individual stocks participate in market moves rather than relying solely on a small group of mega-caps. Near market highs this tends to go down as price gains become more concentrated in a smaller number of stocks, and near market lows this tends to go up as gains become spread over a larger number of stocks.
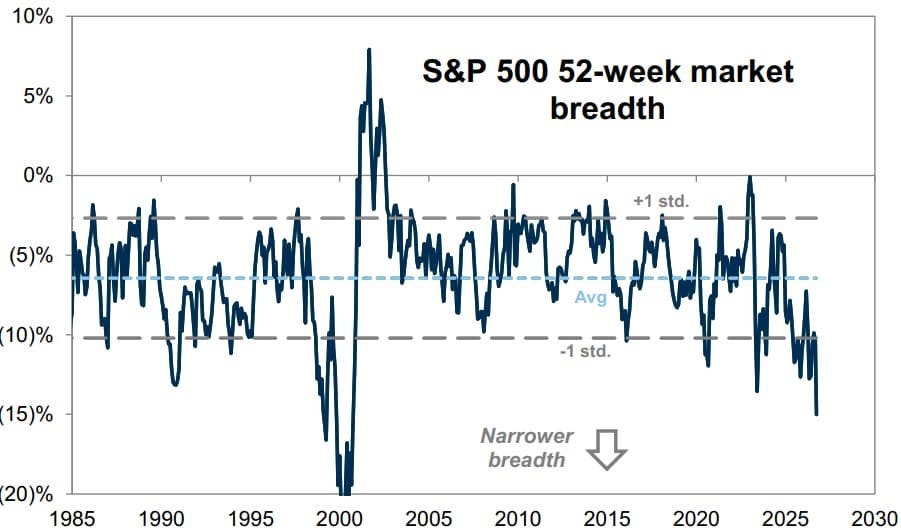
I only have this chart going back to 1985 but you can see significant lows at -11% in 1987 (36% decline in 1987), -16.5% in 1990 (20.5% decline in 1990), then a huge low at -20% in 2000 (49.5% decline into 2002), a low at -9.5% in 2007-8 (57.75% decline into 2009), with further lows at -10.5% in 2017 (20.5% decline 2018), ~12% in 2020 (35.5% in 2020), -14% in 2022 (27.5% decline 2022) and the current low at about -15% the second lowest reading since 1990.
Hard to say whether this is in bubble territory, though it is at the lowest level on this chart other than the big low in 2000. Any level in the -10 area or below though is warning at minimum of a likely significant high forming.
S&P 500 52-Week Market Breadth 1985 - Date
Why is this a bubble in AI particularly?
This one is very simple. You follow the money. In a bubble the market concentrates into particular sectors and in recent years, that concentration has been into the Tech & AI majors.
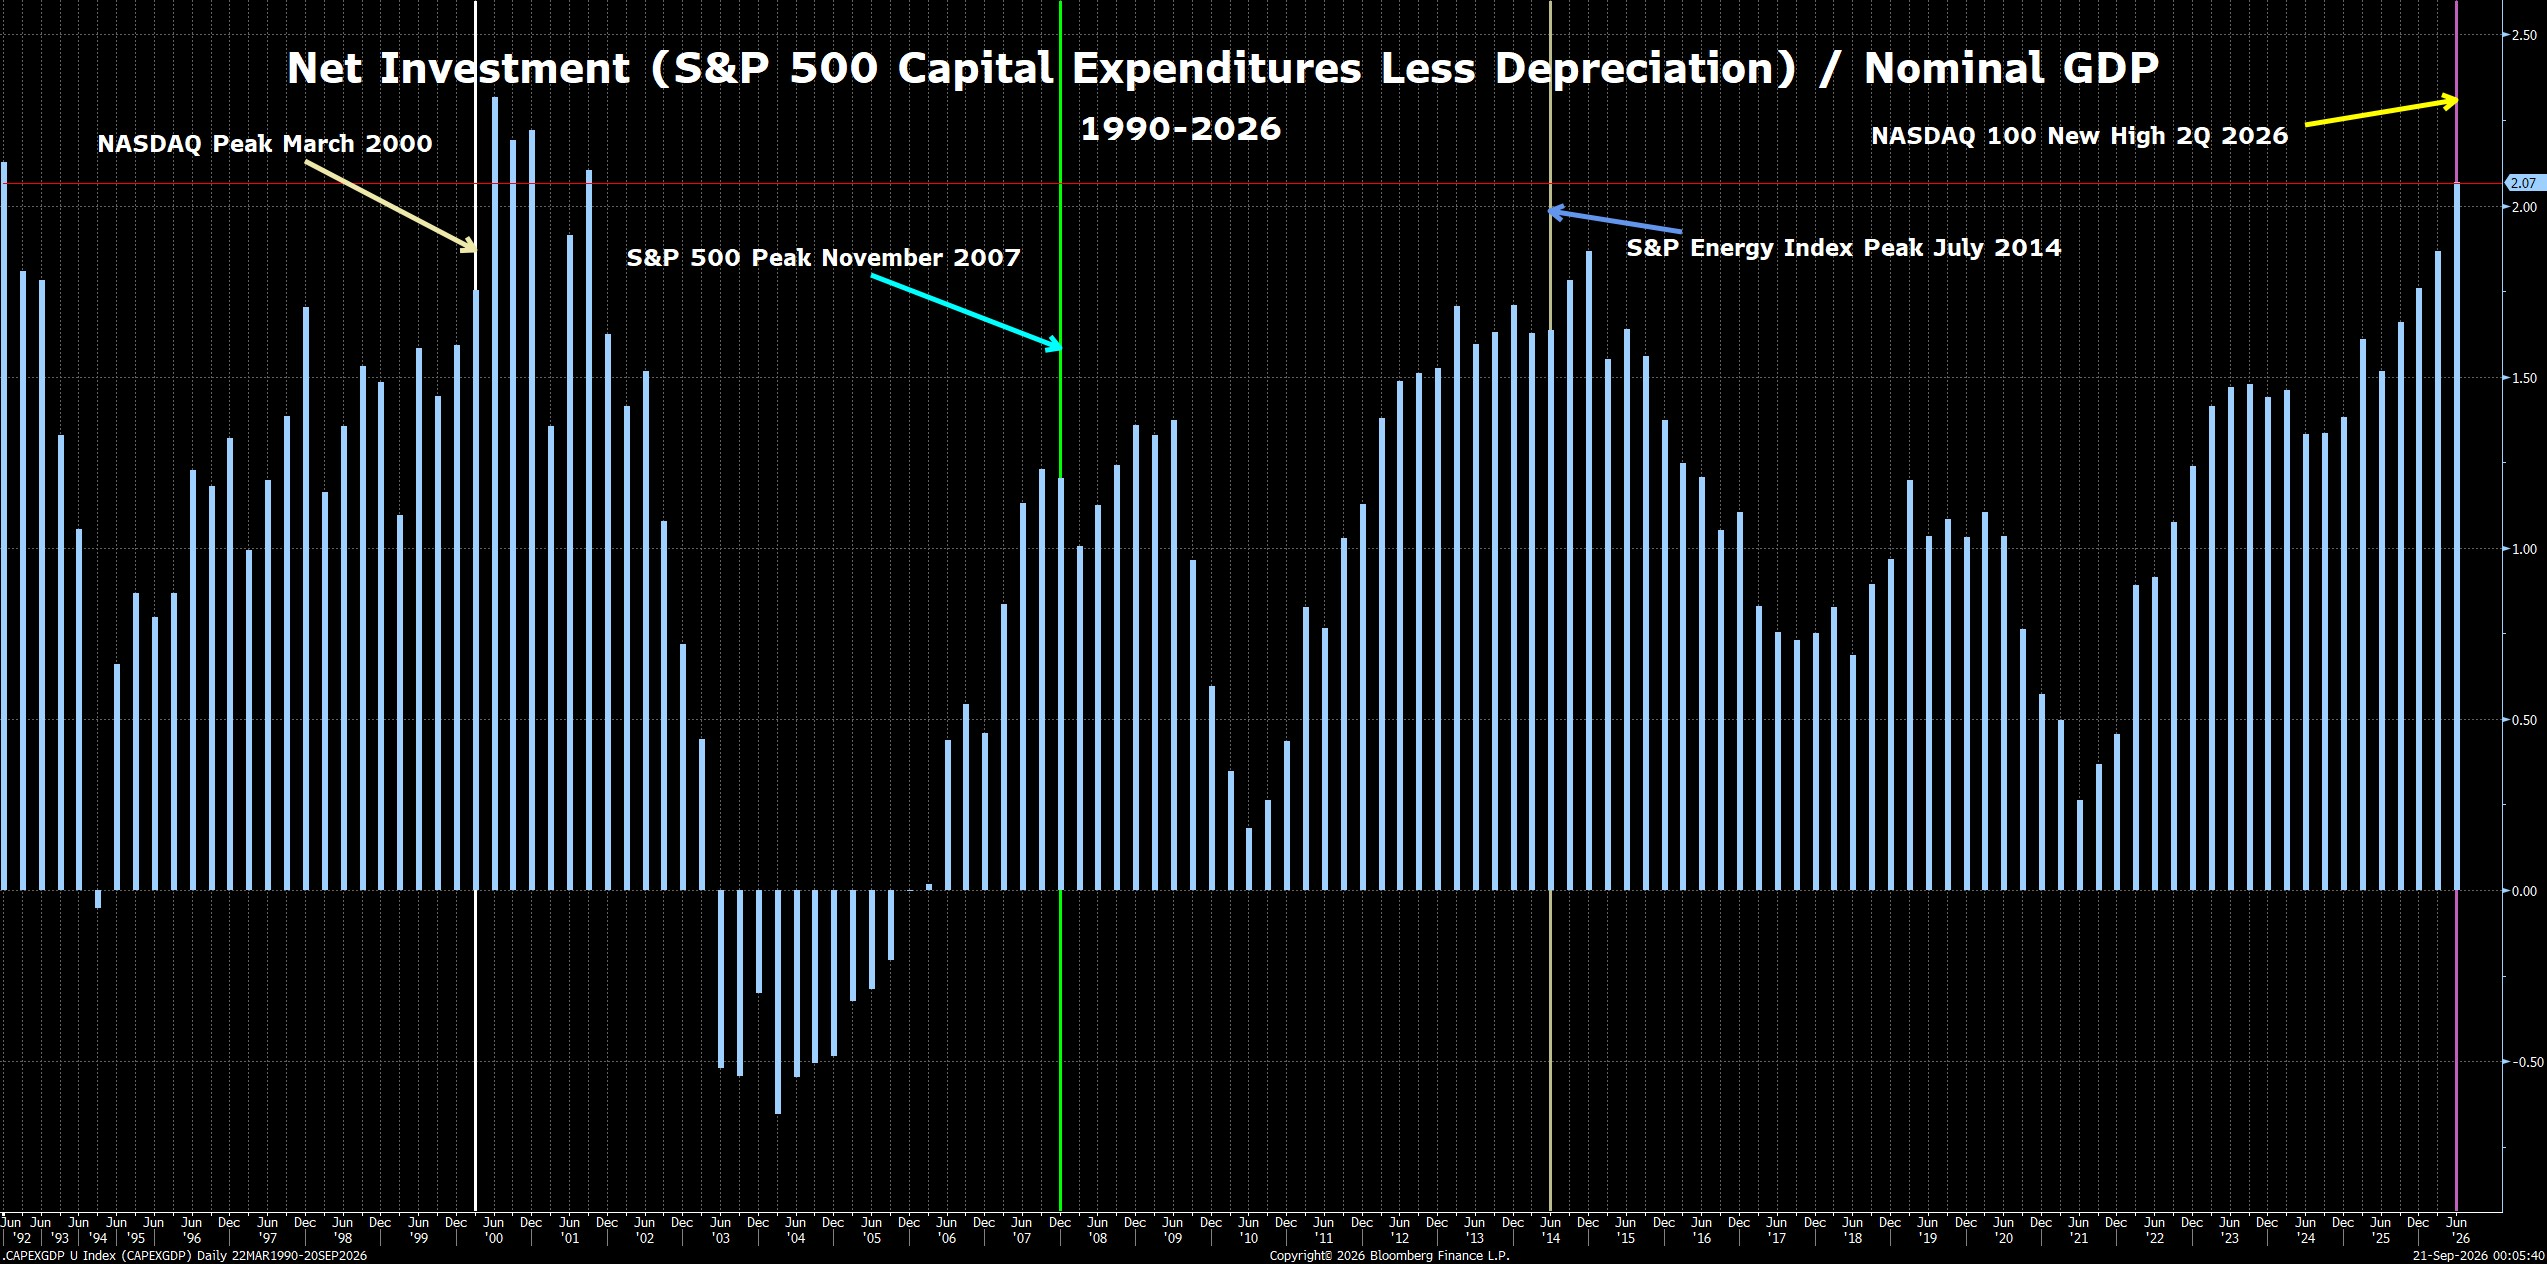
There’s also net investment, which concentrates in the bubble sector(s). That concentration is the current investment pouring into data centres.
Net Investment (S&P 500 Capital Expenditures Less Depreciation) / Nominal GDP 1992-Date:
It’s relatively simple to see a bubble forming, but much harder to call where it tops out. As and when it does top out though, the aftermath isn’t pretty:

I’m expecting to have the next post in this series of three out on Friday and that will be looking at why the AI bubble is likely to be within a year or two at most, and which Tech companies are most likely to survive the bursting of the bubble.
If you like my analysis and would like to see more, please take a free subscription at my thebiggerpicture substack, where I publish these posts first and for members (from next week) also bi-weekly videos looking at equity indices, bonds, currencies and commodities. Those videos are posted on my Youtube channel after a seven day delay. Links to all my posts from my charting substacks are also always posted on my twitter.


No comments:
Post a Comment