
In my post at the start of last week I was looking at the escalating economic shock that is the closure of the Strait of Hormuz, but also noting that the lack of patterns on equity indices from the late March lows were nonetheless looking higher.
US equity indices haven’t gone up a lot since then, with the exception of an impressive performance on QQQ, but I’m still thinking that SPX and QQQ in particular may go higher still and have some trendline targets to put forward in the event that turns out to be the case.
First though I’d like to look quickly at the current status of the Iran War and then take you on a walk down memory lane looking at the weeks before the last really big crisis in equities, which was of course the early weeks of the pandemic in 2020.
On Iran I wrote a post last Thursday on my The Bigger Picture substack looking at why the Iran War was largely irrelevant in the context of the economic shock being created by the closure of the Strait of Hormuz. If you haven’t already read that I’d suggest that you do that.
Further to that post there are two important dates coming up. The first is at the start of May, when the US Constitution requires the administration to go to Congress to authorise this war. That may or may not happen of course and the US administration may just argue that the war was never really a war and is in any case already over, but in the event that they don’t receive that authorisation the war needs to be wrapped up within the following thirty days.
I don’t know how seriously this administration will take this constitutional obligation but at the least this suggests that any active hostilities and the current embargo may be over by the end of May.
The second date is more important and is the consensus view I’ve been reading that the released strategic reserves and all the oil in transit after the closure of the Strait of Hormuz are likely to be exhausted by May 10th. That could be delayed a bit further, perhaps by the release of more strategic reserves, but as and when any surpluses have been used up, we will start a process of price discovery / demand destruction on oil.
The shortfall of the reduced supply vs demand looks to be in the region of ten million barrels per day or more. There is a decent analysis of how that is comprised here if you are interested. In the absence of other sources the price of oil will need to rise until it reaches a level where that ten million barrels per day shortfall is eliminated by demand destruction, because those ten million barrels per day are no longer wanted at that much higher price.
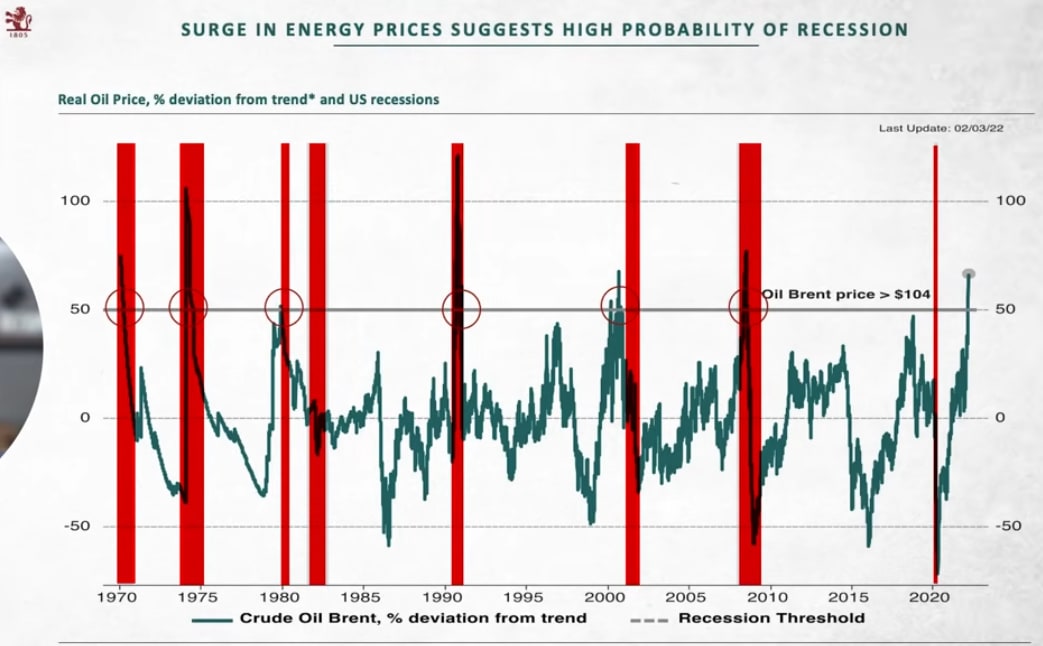
In that process I think we would likely see oil prices reach new all time highs in the $150 area, and may well see then reach new all time highs adjusted for inflation, which for Brent and West Texas Intermediate Crude would be in the $225 area. This would be a major worldwide economic shock, and as you can see looking at the chart below would likely put much of the world, including the US, into recession.
The best comparisons for this oil shock would likely be the mid-1970s and 1990 oil shocks:
So to summarise, we are looking at a major economic shock to the world, starting in a couple of weeks or so, that will likely happen to a significant degree even if the Strait of Hormuz were to be fully opened to commercial shipping today, as it takes a while for oil tankers to reach their destinations even when they can pass freely.
So why are equity indices still rising? Well let’s have a look at the last major shock to the world economy in 2020. The COVID shock was predictable. I remember talking to my brother in late January 2020 discussing the WHO not imposing flight controls and speculating as to whether that was because it was already too late to stop the coming pandemic. Many people saw the problem coming. Analysts were cautious about predicting a problem that people didn’t want to see, and markets hoped it would all just go away until it became undeniable that it wouldn’t.
I wrote a post on 19th February about the nascent pandemic and talking about the risks to world markets, and one thing I was watching but didn’t mention was that by the time I wrote that post there had already for several days been growing shortages of toilet paper in shops across the world including the US. That toilet paper shortage was created by people who could see what was coming and were hoarding essential supplies.
Those hoarders were all ahead of equity markets, which rose 5.5% from the start of February 2020 into a new all time high on 19th February, at which point reality finally started to bite and equities started to fall.
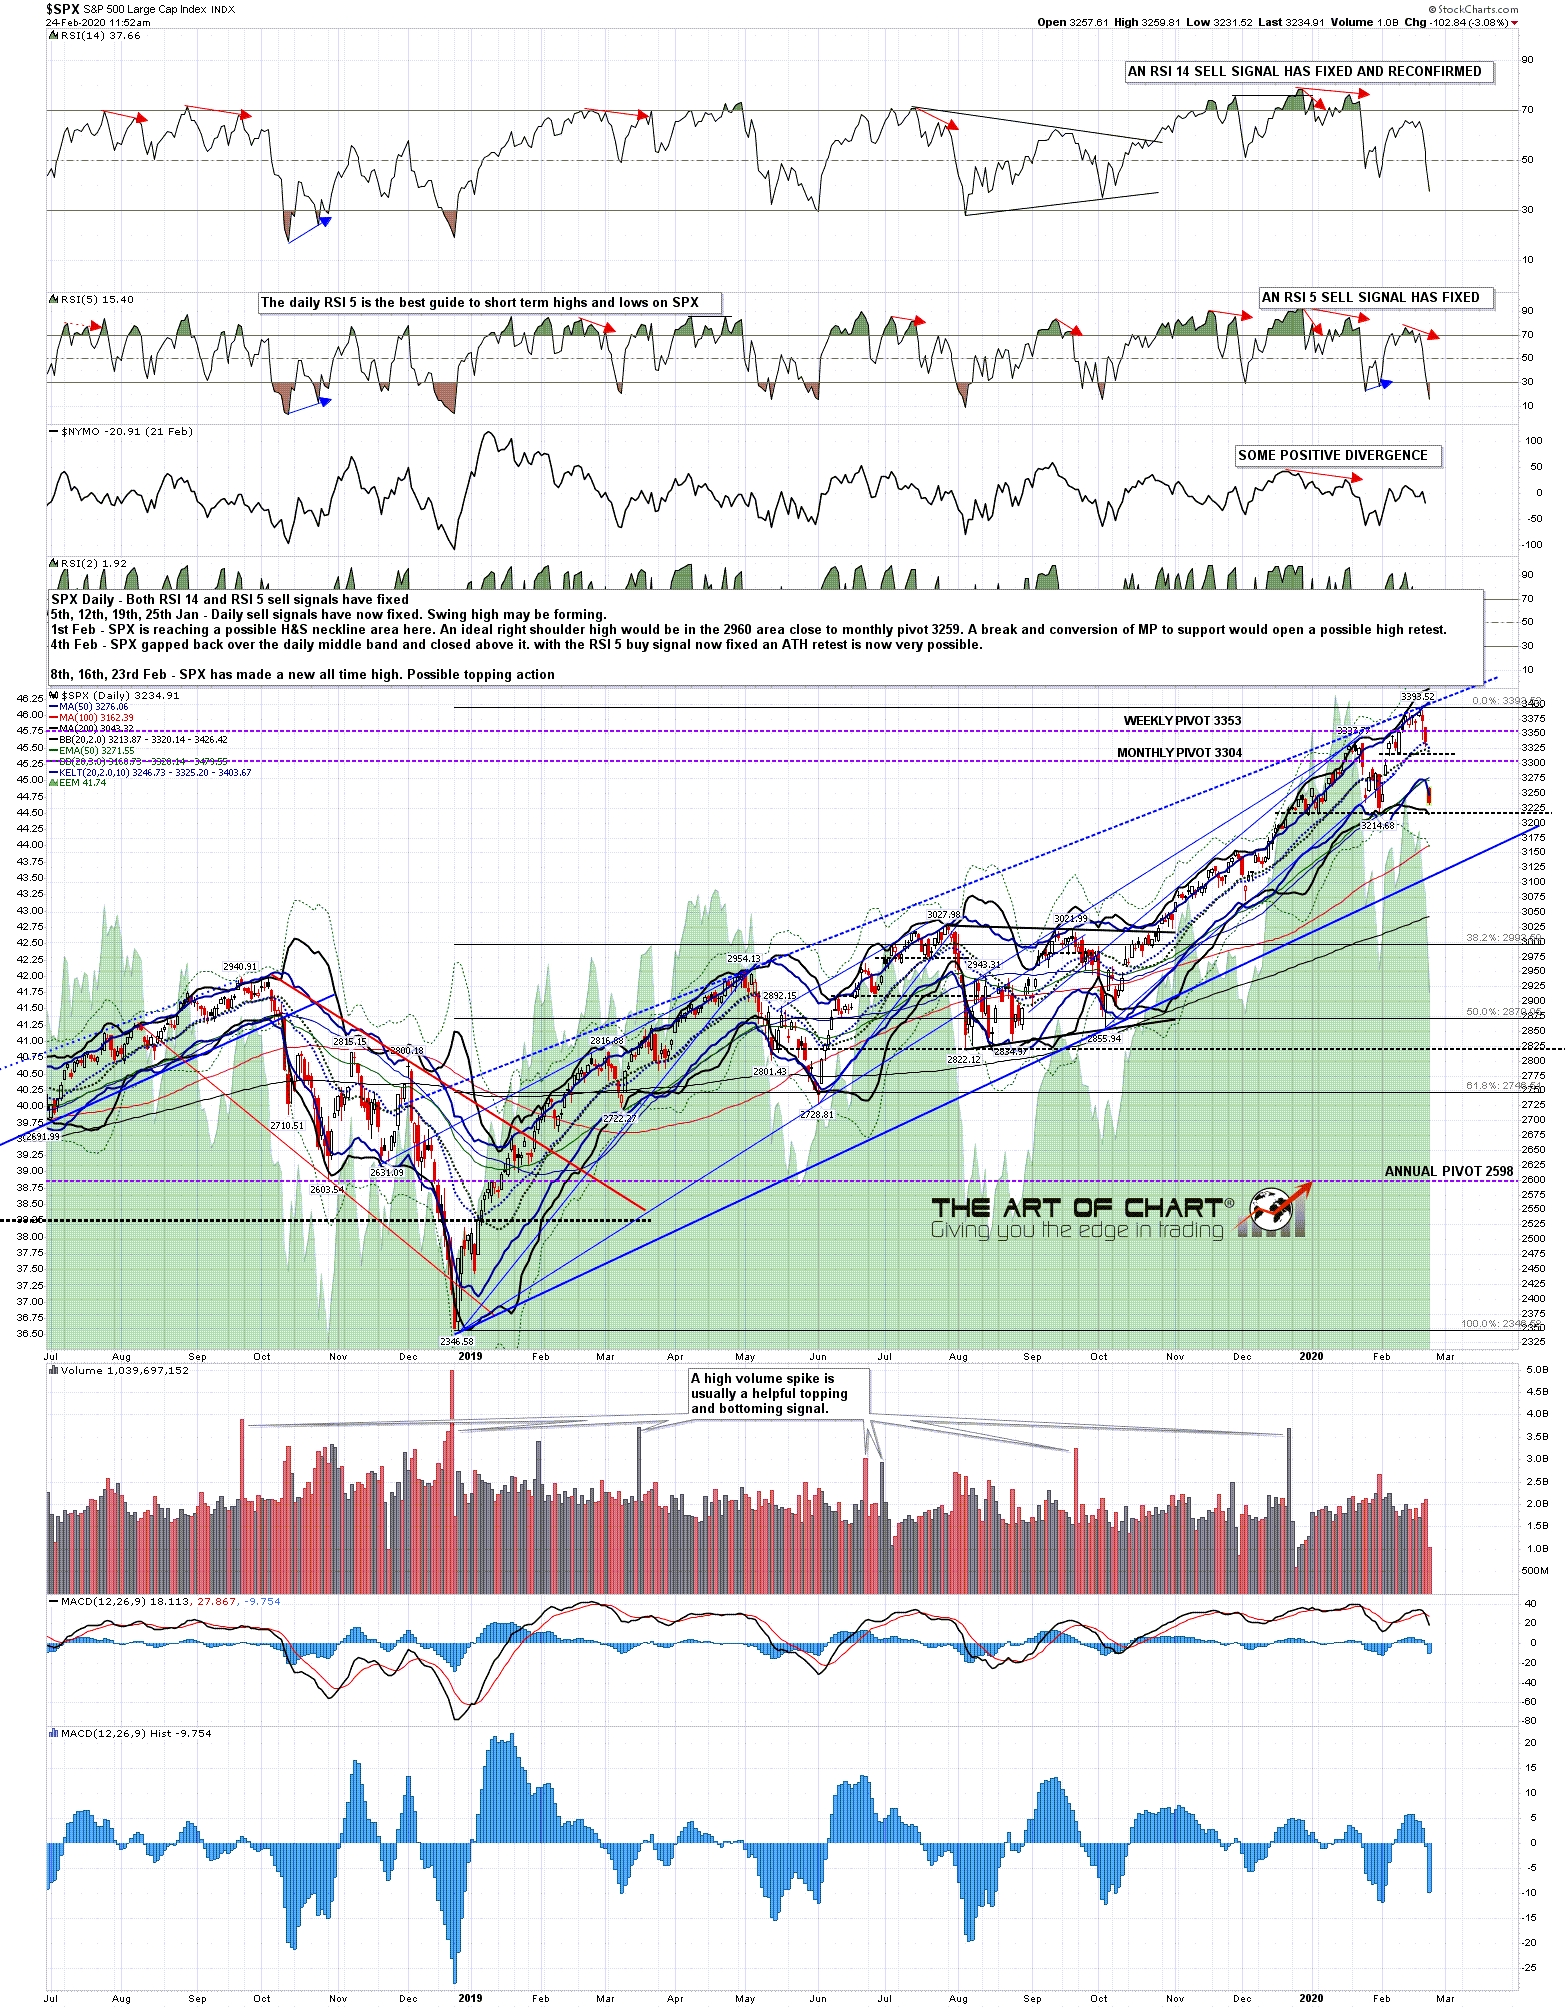
I wrote another post on 24th February looking at the start of the decline from the high, and SPX went on to decline 35.4% over the next month into the crash low at 2191.86 on 24th March 2020.
Where SPX topped out in February was interesting however, with the move up in February hitting a high quality resistance trendline for the rising wedge from the late 2018 low. This entire wedge would then be fully retraced over the following month.
SPX daily chart from 24th February 2020:
The question is whether we might see a similar move here. We still have a couple of weeks before reality becomes really hard to ignore and I do have a couple of high quality trendlines that might be hit in that time.
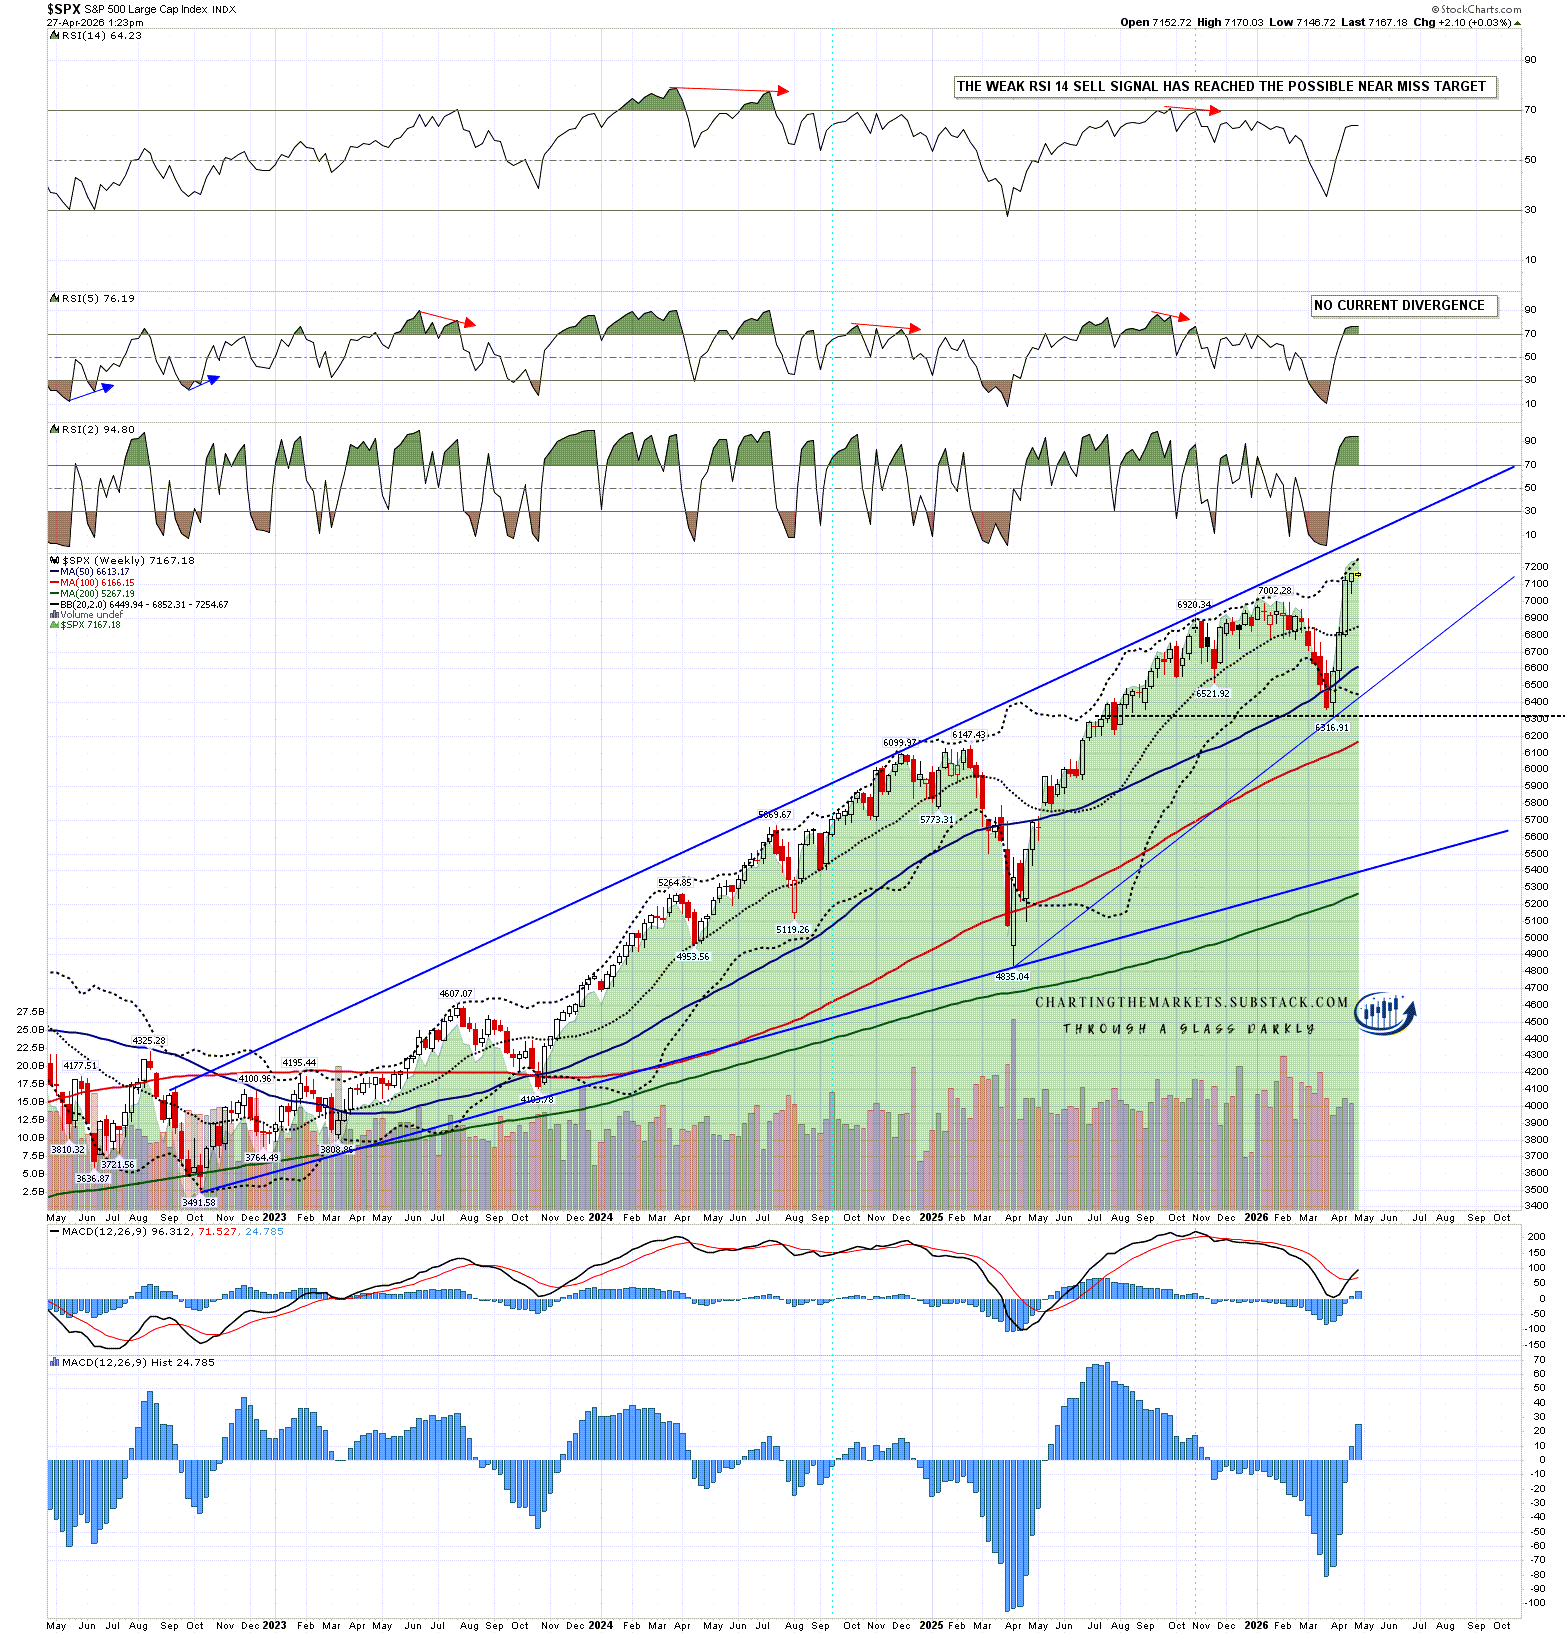
On SPX I have a decent looking rising megaphone from the late 2022 low, and at the time of writing I have the resistance trendline in the 7360 area.
SPX weekly chart:
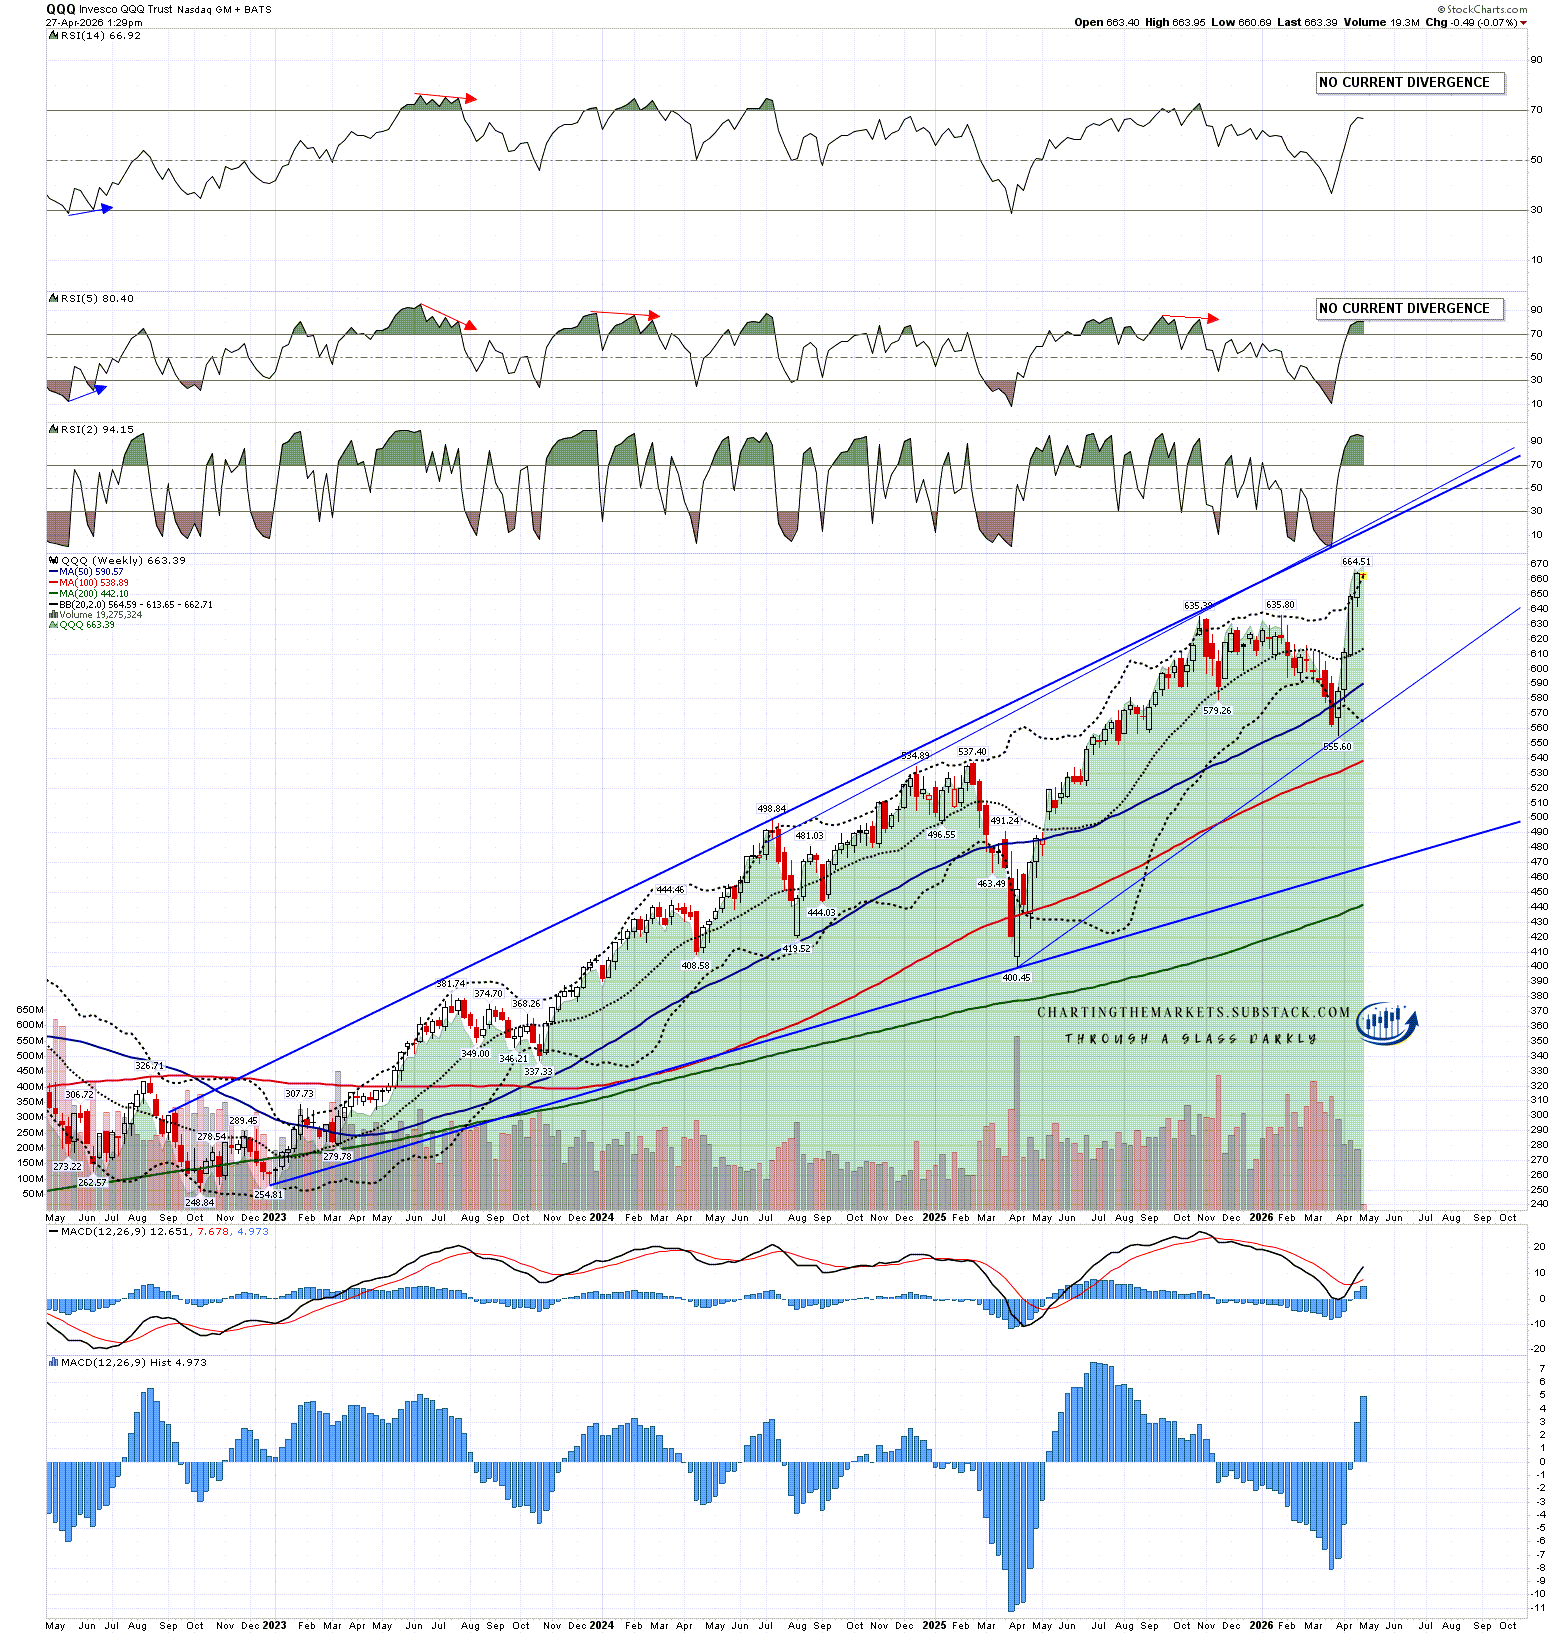
On QQQ I also have a decent looking rising megaphone from the late 2022 low, and at the time of writing I have the resistance trendline in the 680 area.
QQQ weekly chart:
These trendlines don’t need to be hit, and rationally they really shouldn’t be hit, but I’ll be watching these, and if reached, they should both be a solid sell there in my view.
I’ll be doing a post later this week with a shorter term view, but I was having a careful look at equity indices over the weekend, and wanted to share these as possible upside targets.
In the meantime we are in the early stages of a major economic shock to the world that may well be comparable to the pandemic in 2020, and when we make the high for the current move, I’m thinking that high may last the rest of this year and perhaps next year as well. Be careful out there.
If you like my analysis and would like to see more, please take a free subscription at my chartingthemarkets substack, where I publish these posts first. I also do a premarket video every day on equity indices, bonds, currencies, energies, precious commodities and other commodities at 8.45am EST, but only for paying subscribers. Other places to find me are my page on the platform previously known as twitter, and my YouTube channel.
No comments:
Post a Comment