
In my last post on Thursday I was looking at the upside scenario on US indices if the rally could break higher and we are still in the same inflection point, albeit now near the likely bottom area of it.
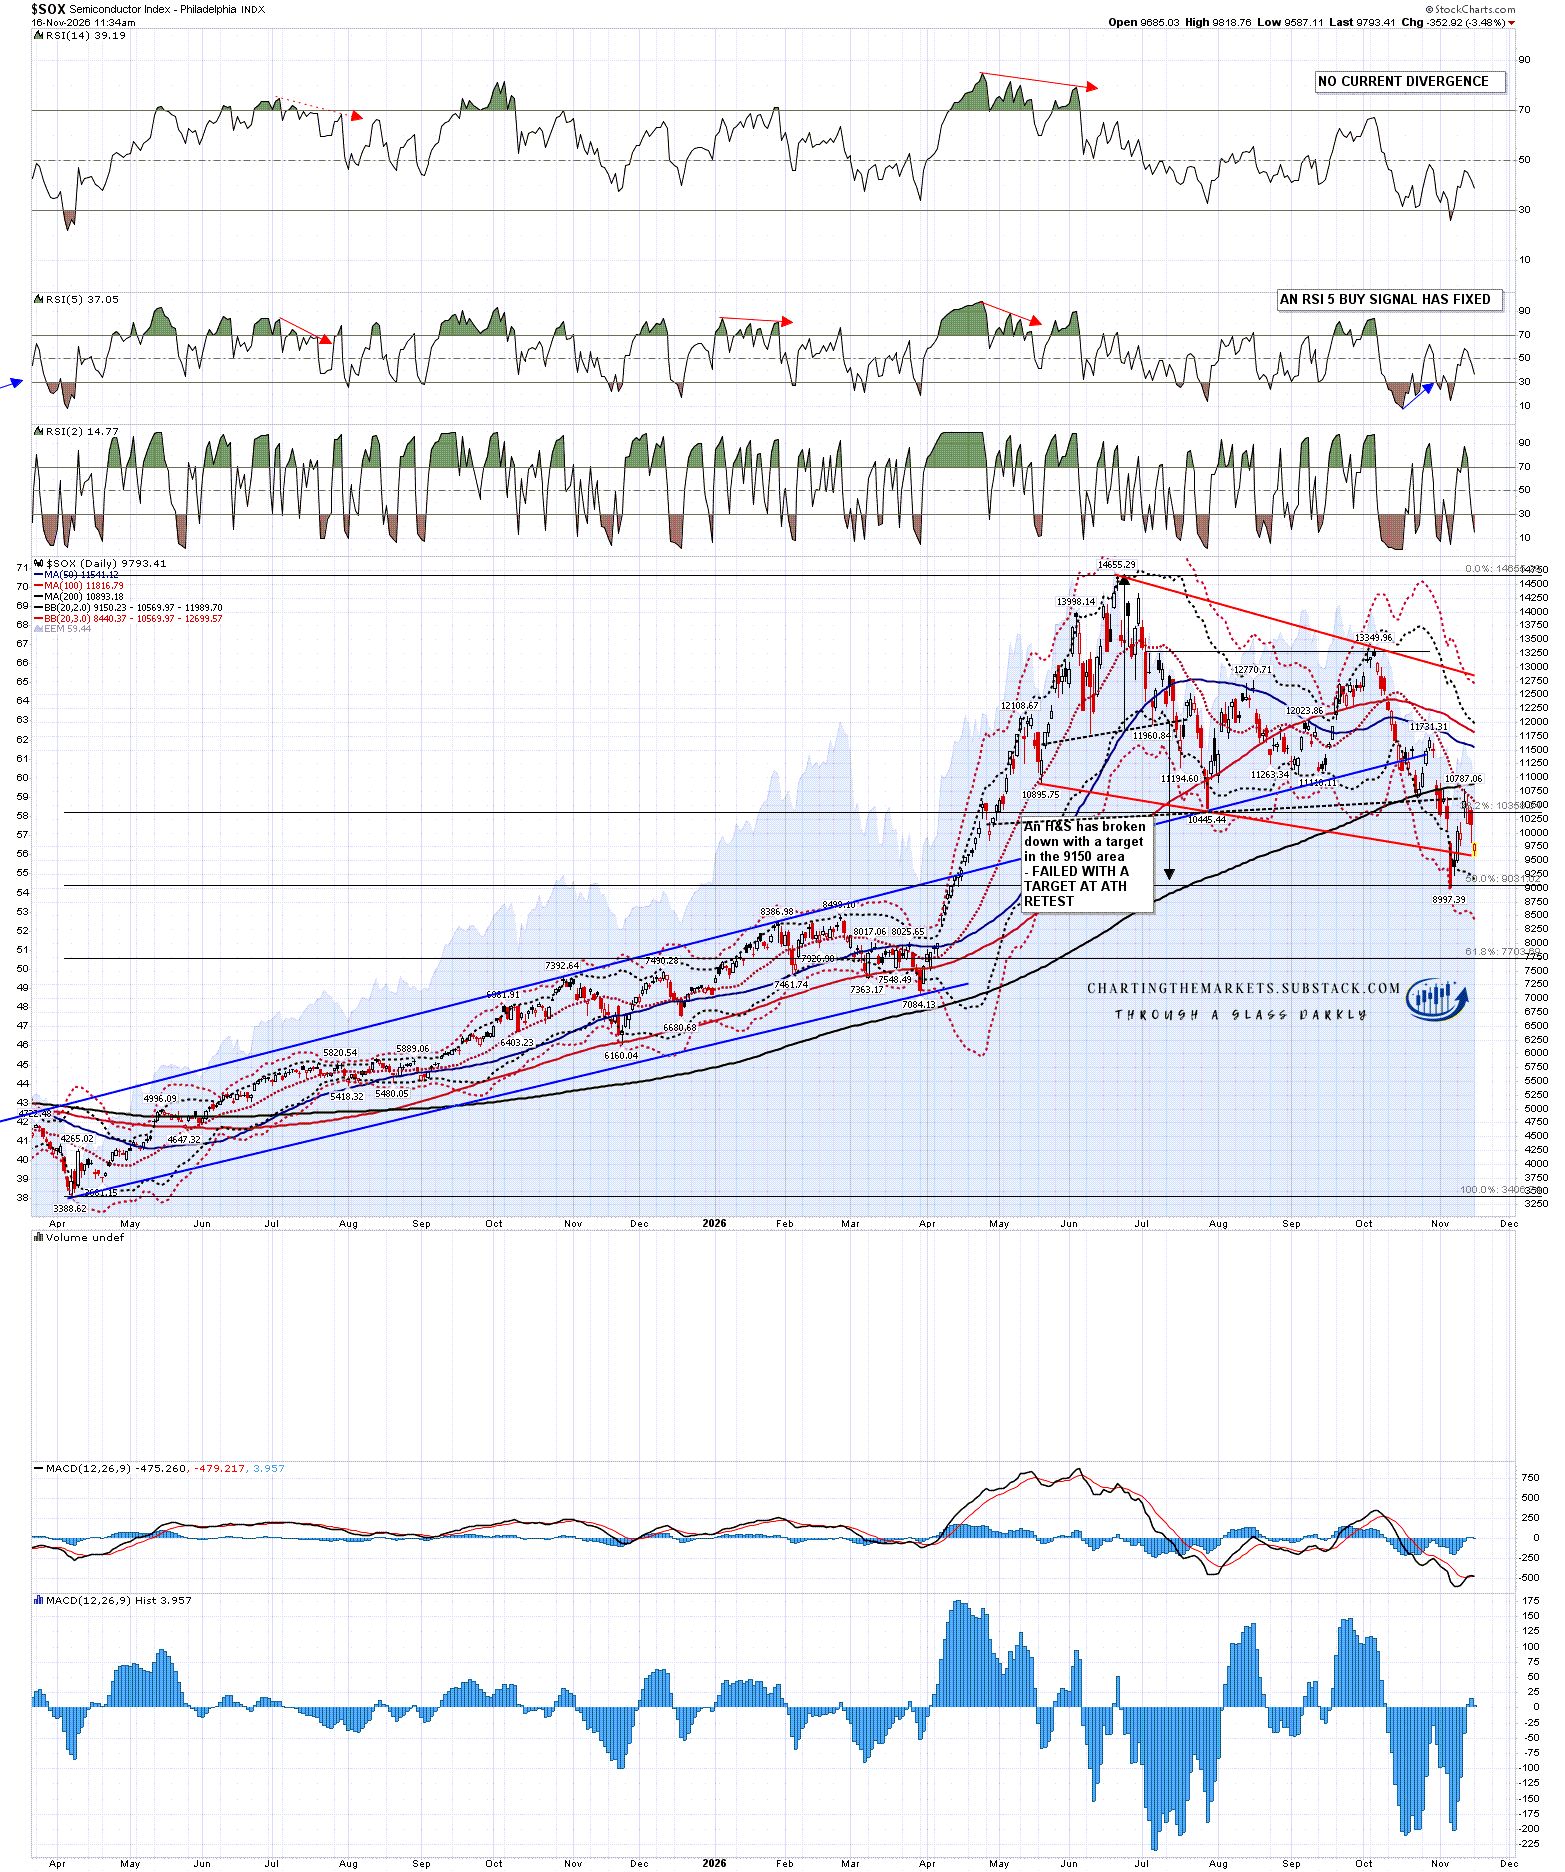
On the bull side The Philadelphia Semiconductor Index (SOX), QQQ and SPX all rallied back to their daily middle bands at the highs last week and I noted on Thursday that:
‘The daily middle bands on all of SPX, QQQ and SOX are important resistance and an obvious failure level. Equally if they all break back over their daily middle bands and can hold above for a couple of days, those will be solid bullish breaks. ‘
Obviously we have been seeing some retracement since then but at the time of writing that hasn’t reached the point where it looks like a hard fail. On the SOX chart below a possible IHS is still forming, though if SOX goes much lower I’ll be wondering about a possible retest of the early November low.
SOX daily chart:
Just for a change the rest of the charts today will be from the index futures hourly charts as the pattern setups are clear and I don’t generally post those outside my member only content and have been feeling that I should use these in my posts more often.
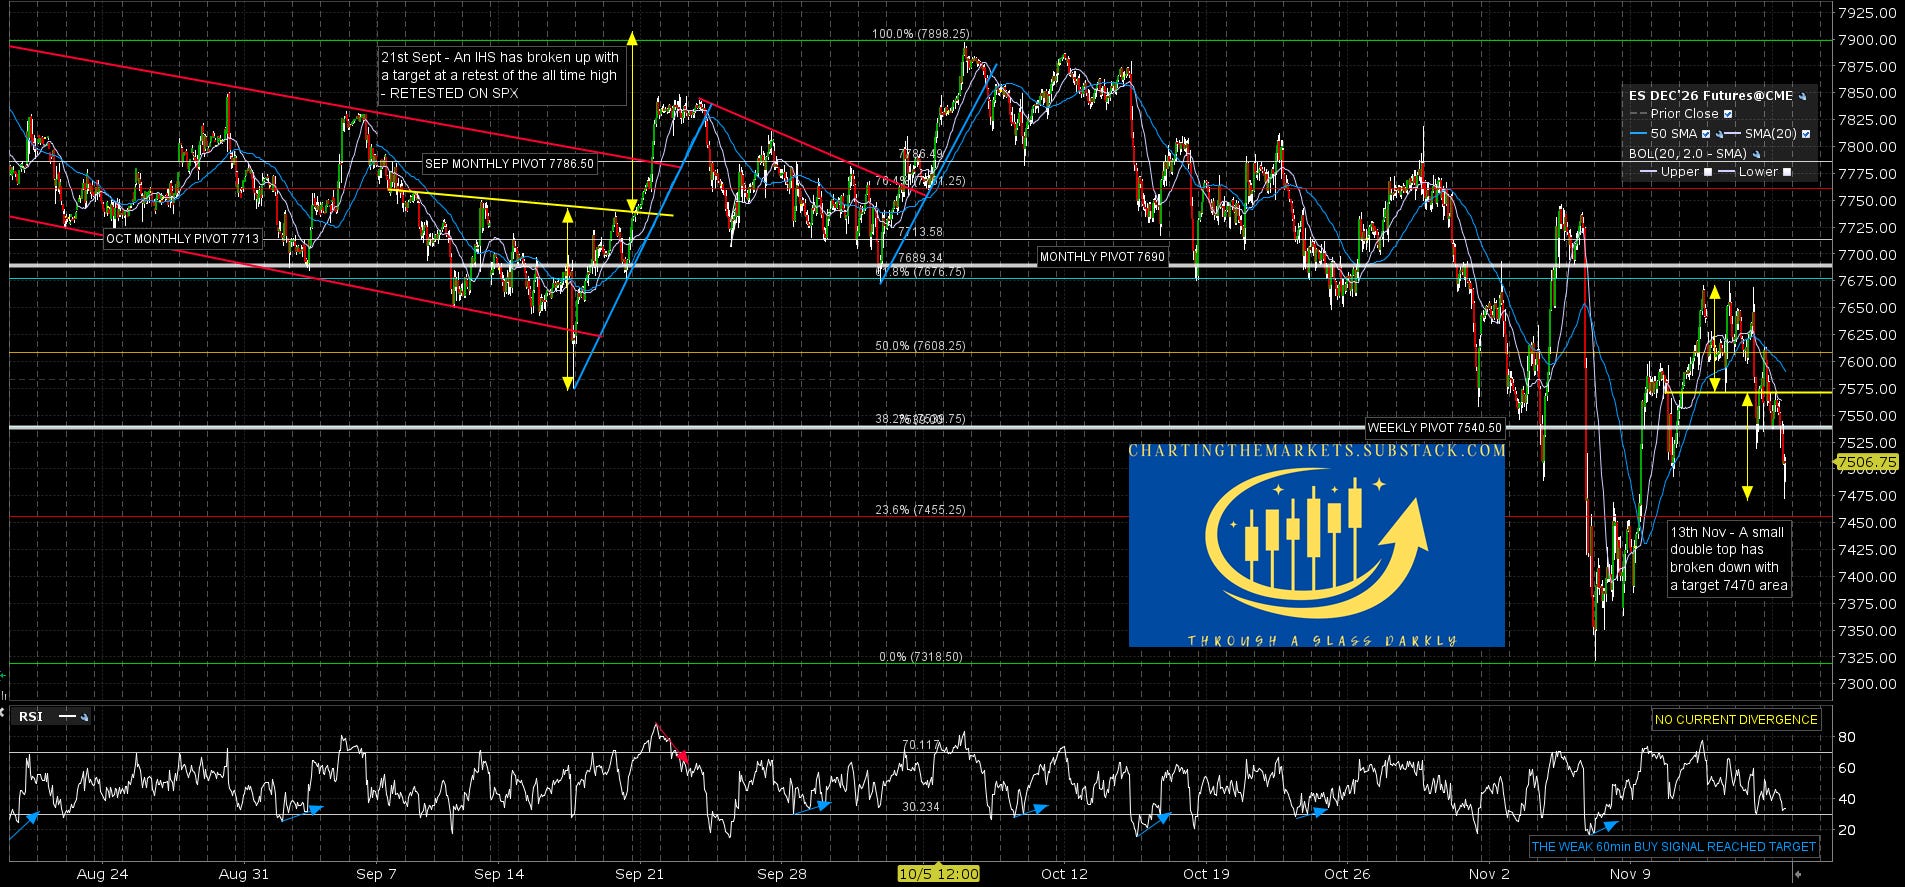
On ES (SPX future) a small double top formed at last week’s highs, broke down and made target this morning. If this is just a retracement, then this is the obvious low area. Any move much lower invites a retest of the November low.
ES 60min chart:
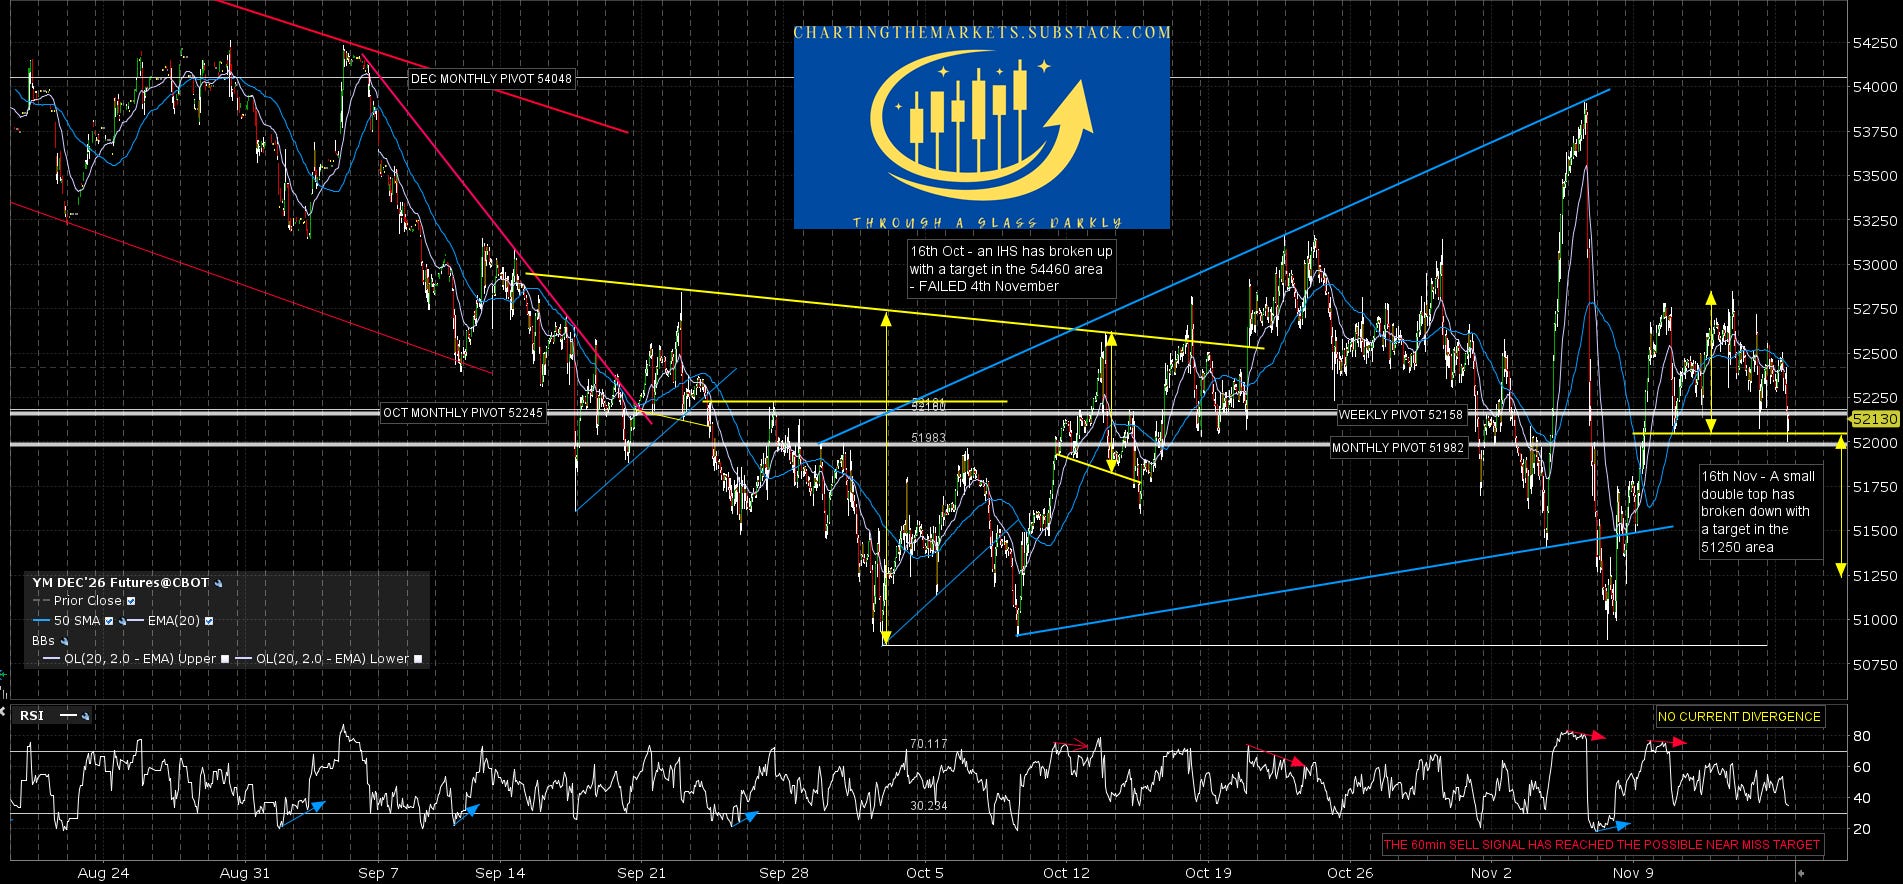
On YM (Dow Ind future) a double top also formed at last week’s highs and broke down this morning with a target in the 51250 area. This is what I would call a binary setup with two targets, one or the other of which is likely to deliver. Those two targets are either reaching the double top target, or rejecting back up to the prior high (52861). As I’ve mentioned before, if a topping or bottoming pattern fails and rejects, the obvious place to do that is shortly after the break down or up. This would therefore be the obvious area to reject from.
YM 60min chart:
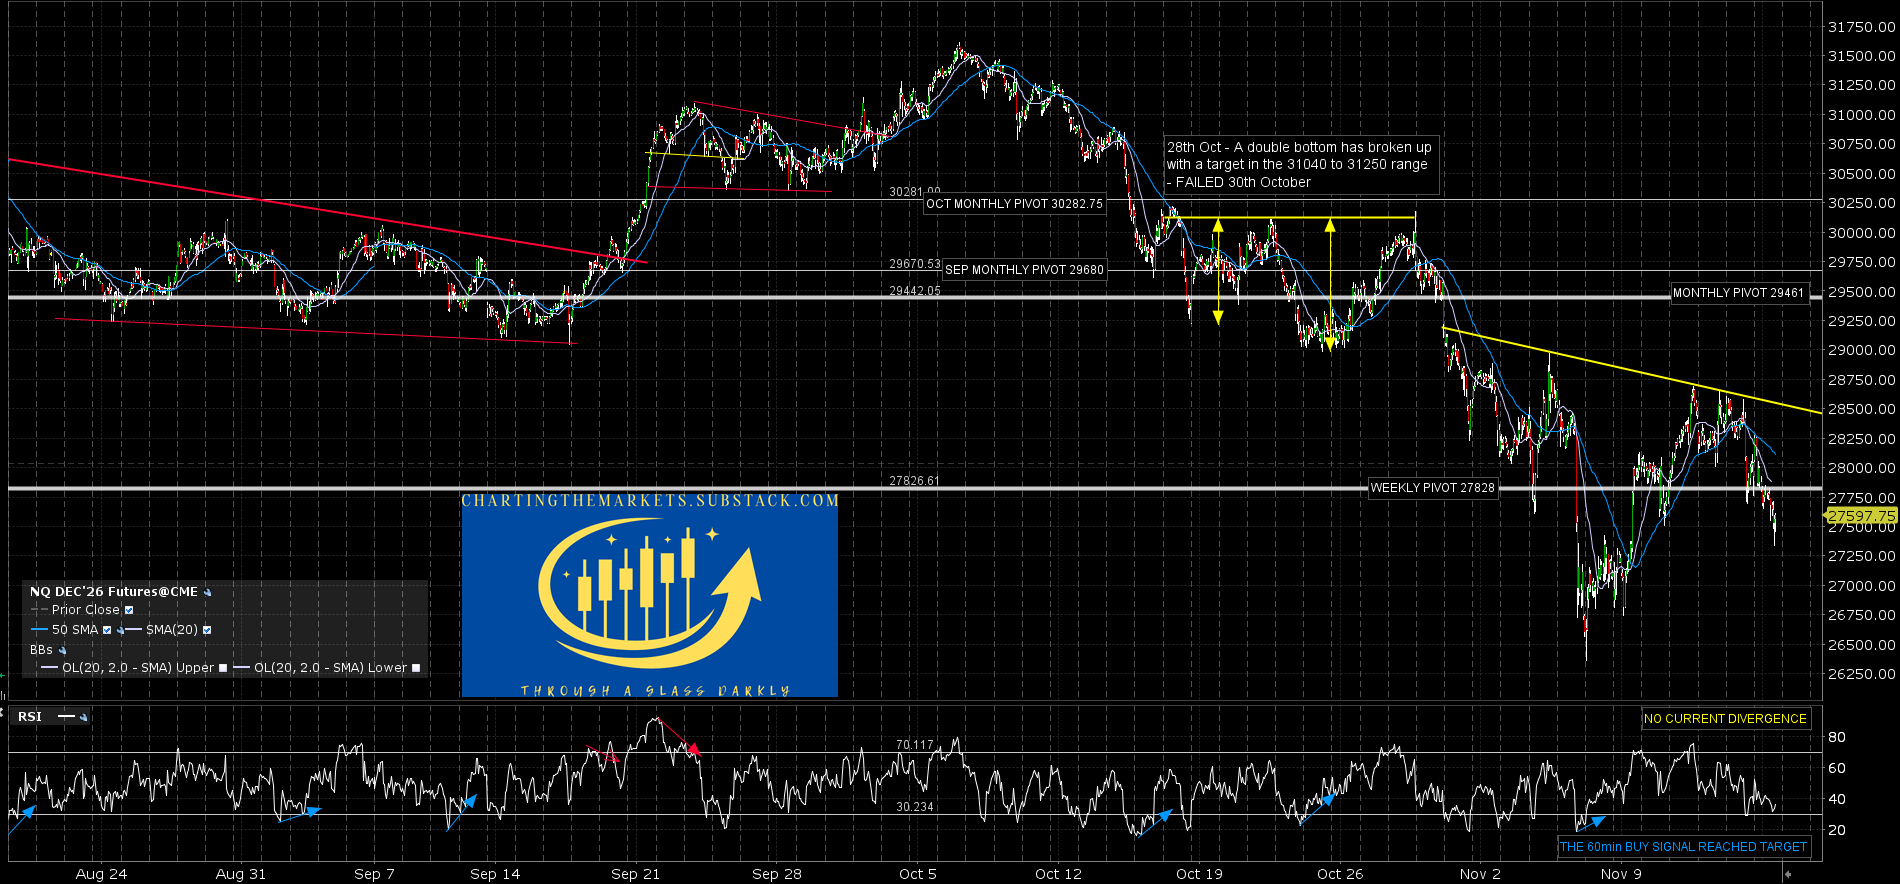
In terms of bottoming patterns here I was looking at the possible IHS patterns for SOX and QQQ on Thursday. The SOX and QQQ IHS patterns are still looking decent and on NQ (NDX future) you can see that is still looking very nice. If the IHS breaks up the target would be in the 31,000 area.
NQ 60min chart:
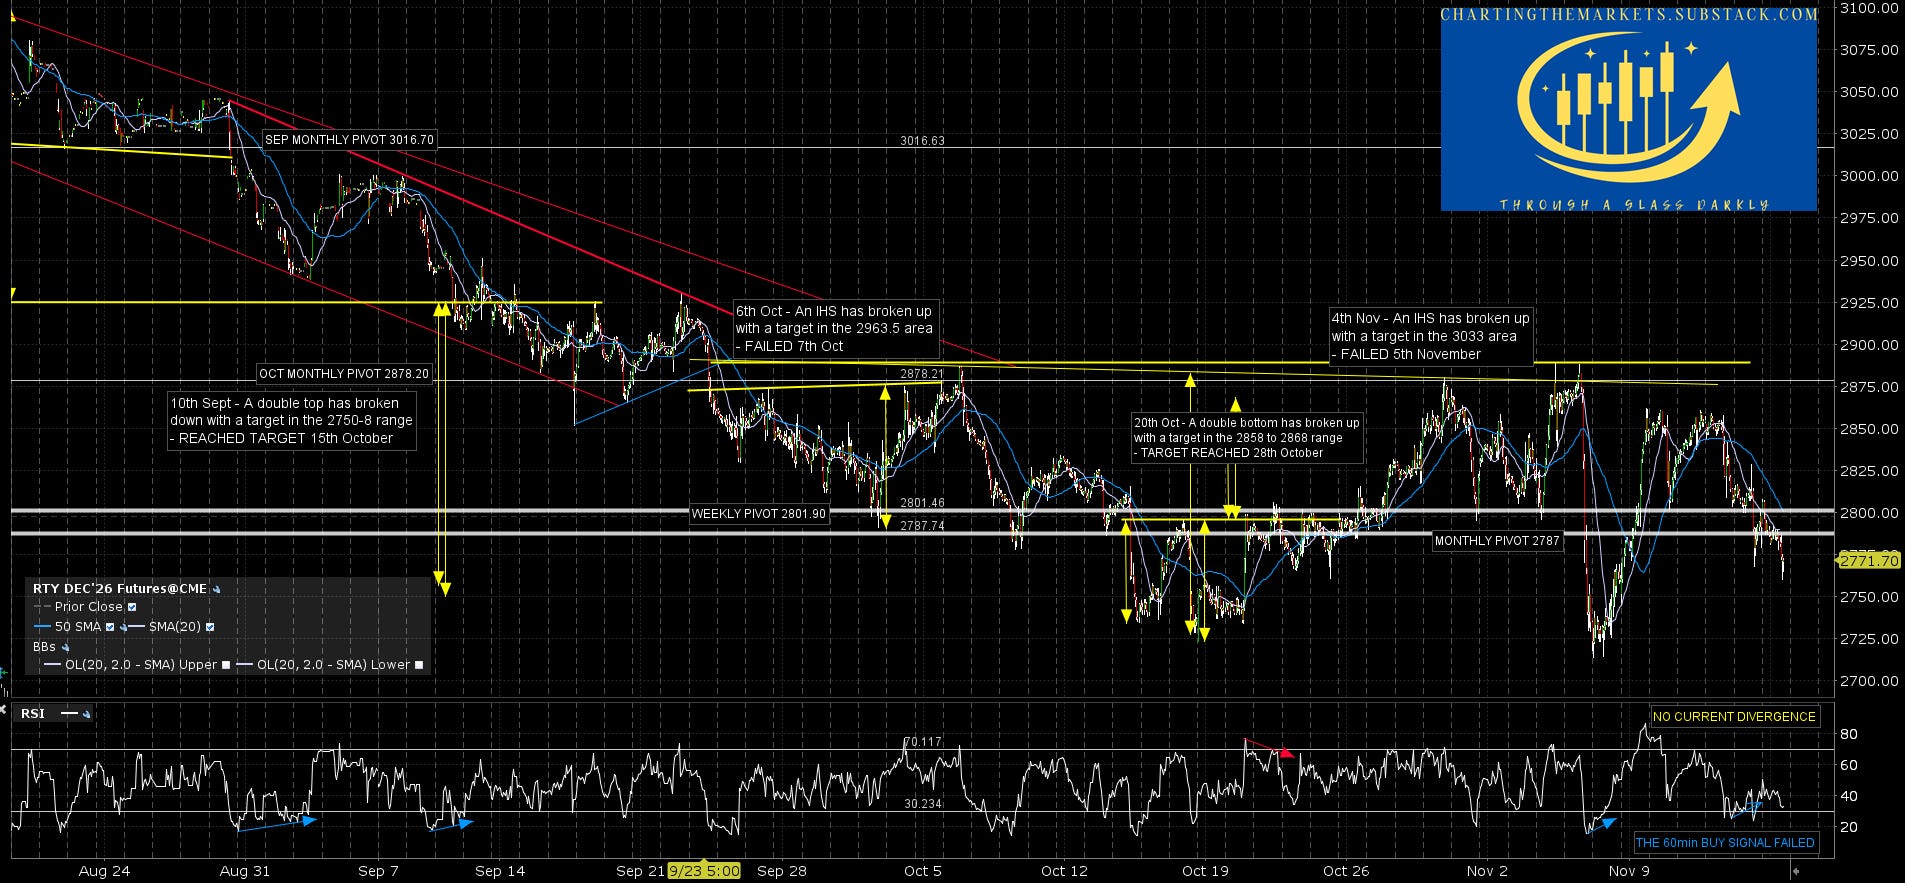
There is also a very nice double bottom on RTY (Russell 2k future). That’s still looking good and on a sustained break over double bottom resistance the target would be in the 3060 area.
RTY 60min chart:
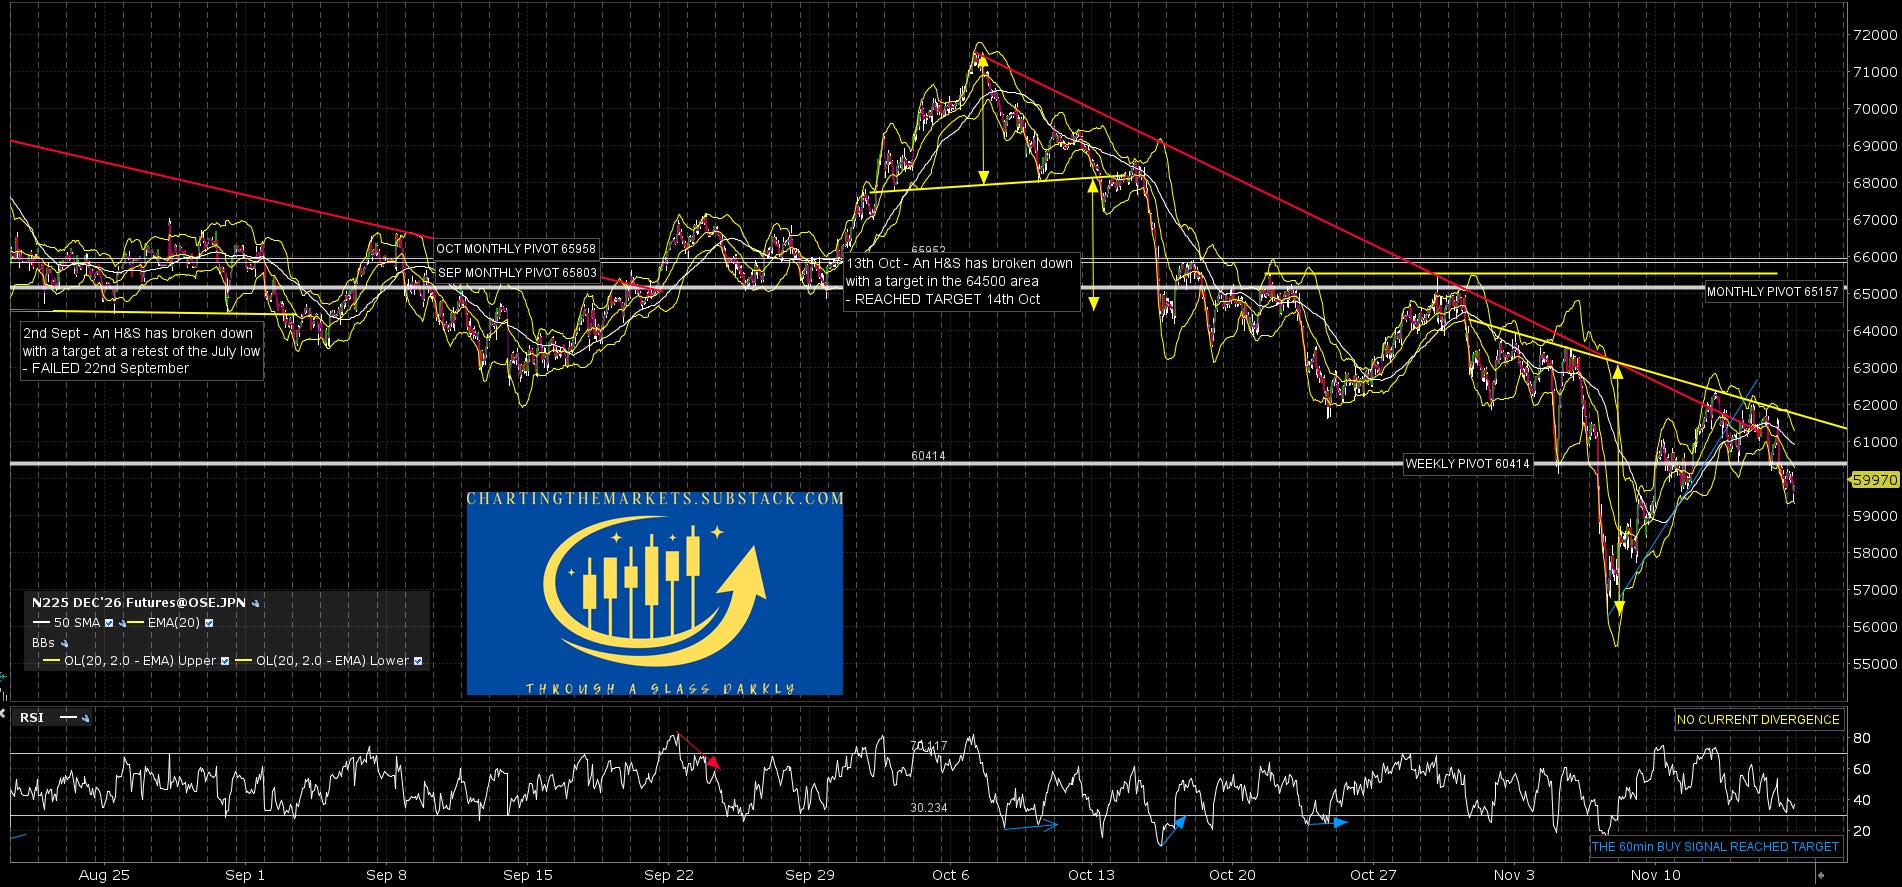
DAX and ESTX50 weren’t big players in the retracement over recent months and are close to all time highs, but N225 (Nikkei 225 future) was hit hard. There is also a decent quality IHS forming on N225 that on a sustained break up would look for a target in the 68500 area.
N225 60min chart:
Now there is clearly also a decent downside scenario here which I’ve covered in detail in my posts this month, and we may see equities break down and play that out, but if that isn’t going to happen in this historically bullish leaning period into the end of the year, then the bullish scenario here is decent, clear, and the obvious place to turn back up into that is ideally in this area, with a possible but inferior second chance at a retest of the early November lows.
I’m doing a three part series on the (likely) AI bubble and published the first instalment late last week on my The Bigger Picture substack. If you missed it you can see that here. I’m planning a post on Anthropic’s doubtful prospects tomorrow as the IPO is coming up, and the second instalment in the AI bubble three part series should be posted later this week.
If you like my analysis and would like to see more, please take a free subscription at my chartingthemarkets substack, where I publish these posts first. I also do a premarket video every day on equity indices, bonds, currencies, energies, precious commodities and other commodities at 8.45am EST, but only for paying subscribers. Other places to find me are my page on the platform previously known as twitter, and my YouTube channel.


No comments:
Post a Comment