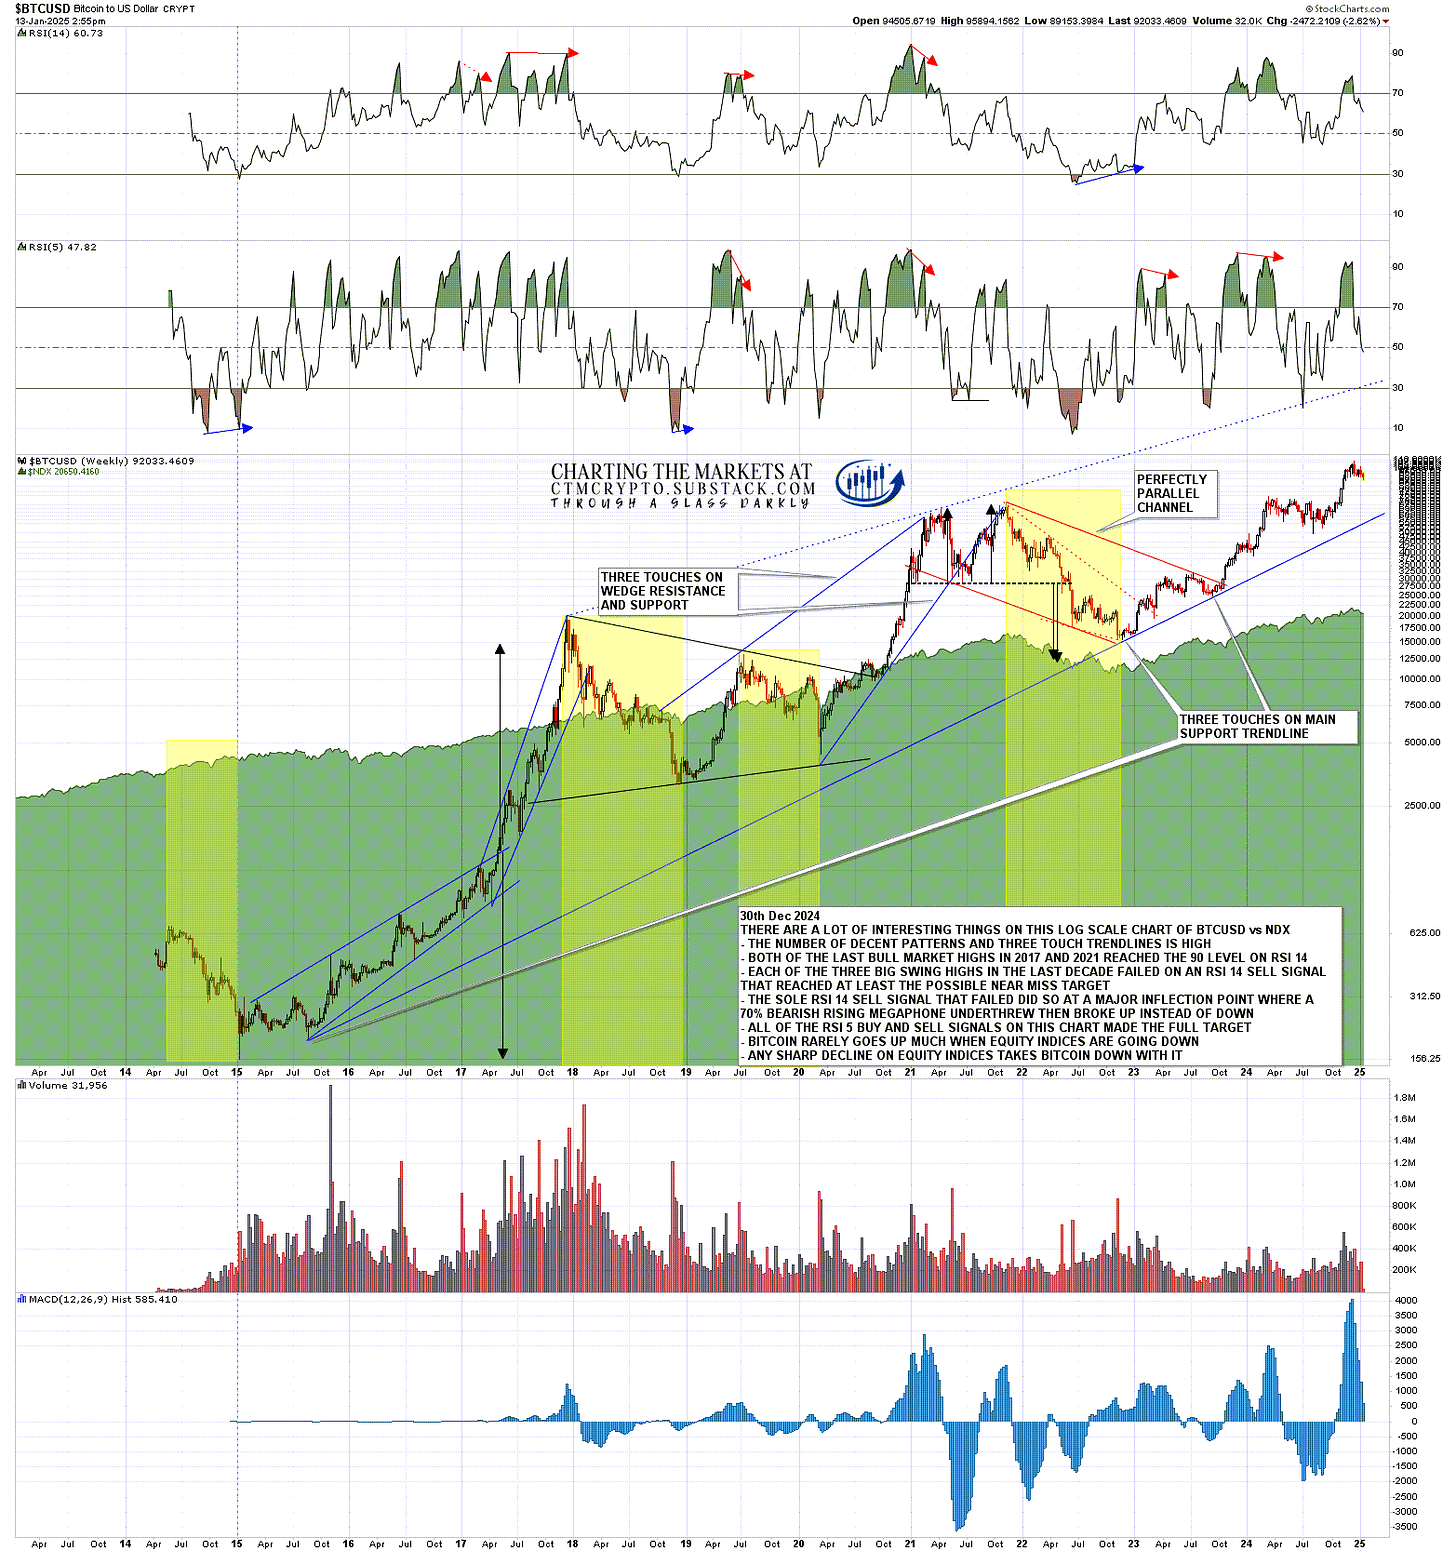
I did a post on equity indices before the open this morning talking about the inflection point here and we are looking in essence at the same inflection point on Crypto, as historically both have tended to be significantly correlated and, as you can see on the chart below, there has been no obvious sign that is changing at the moment.
On Crypto we have a clear inflection point where there could be a break either significantly lower or back towards a retest of the recent highs and that is also the case on US equity indices. Whichever way this breaks, they will most likely break in that same direction though, if that break is into high retests on both, then that may well be part of a topping process that just delivers a similar or larger downside move to the one I am looking at today, just a bit later on.
On the bigger picture I am leaning towards a retracement / consolidation on Crypto in the first half of 2025 and then new all time highs with a very possible bull market high pencilled in close to the end of the year. That scenario would be a good match with past Crypto bull markets
BTCUSD weekly (LOG) vs NDX:
I went through the inflection point setup in detail on my premarket video this morning, and the downside scenario on Bitcoin (BTCUSD) is particularly nice.
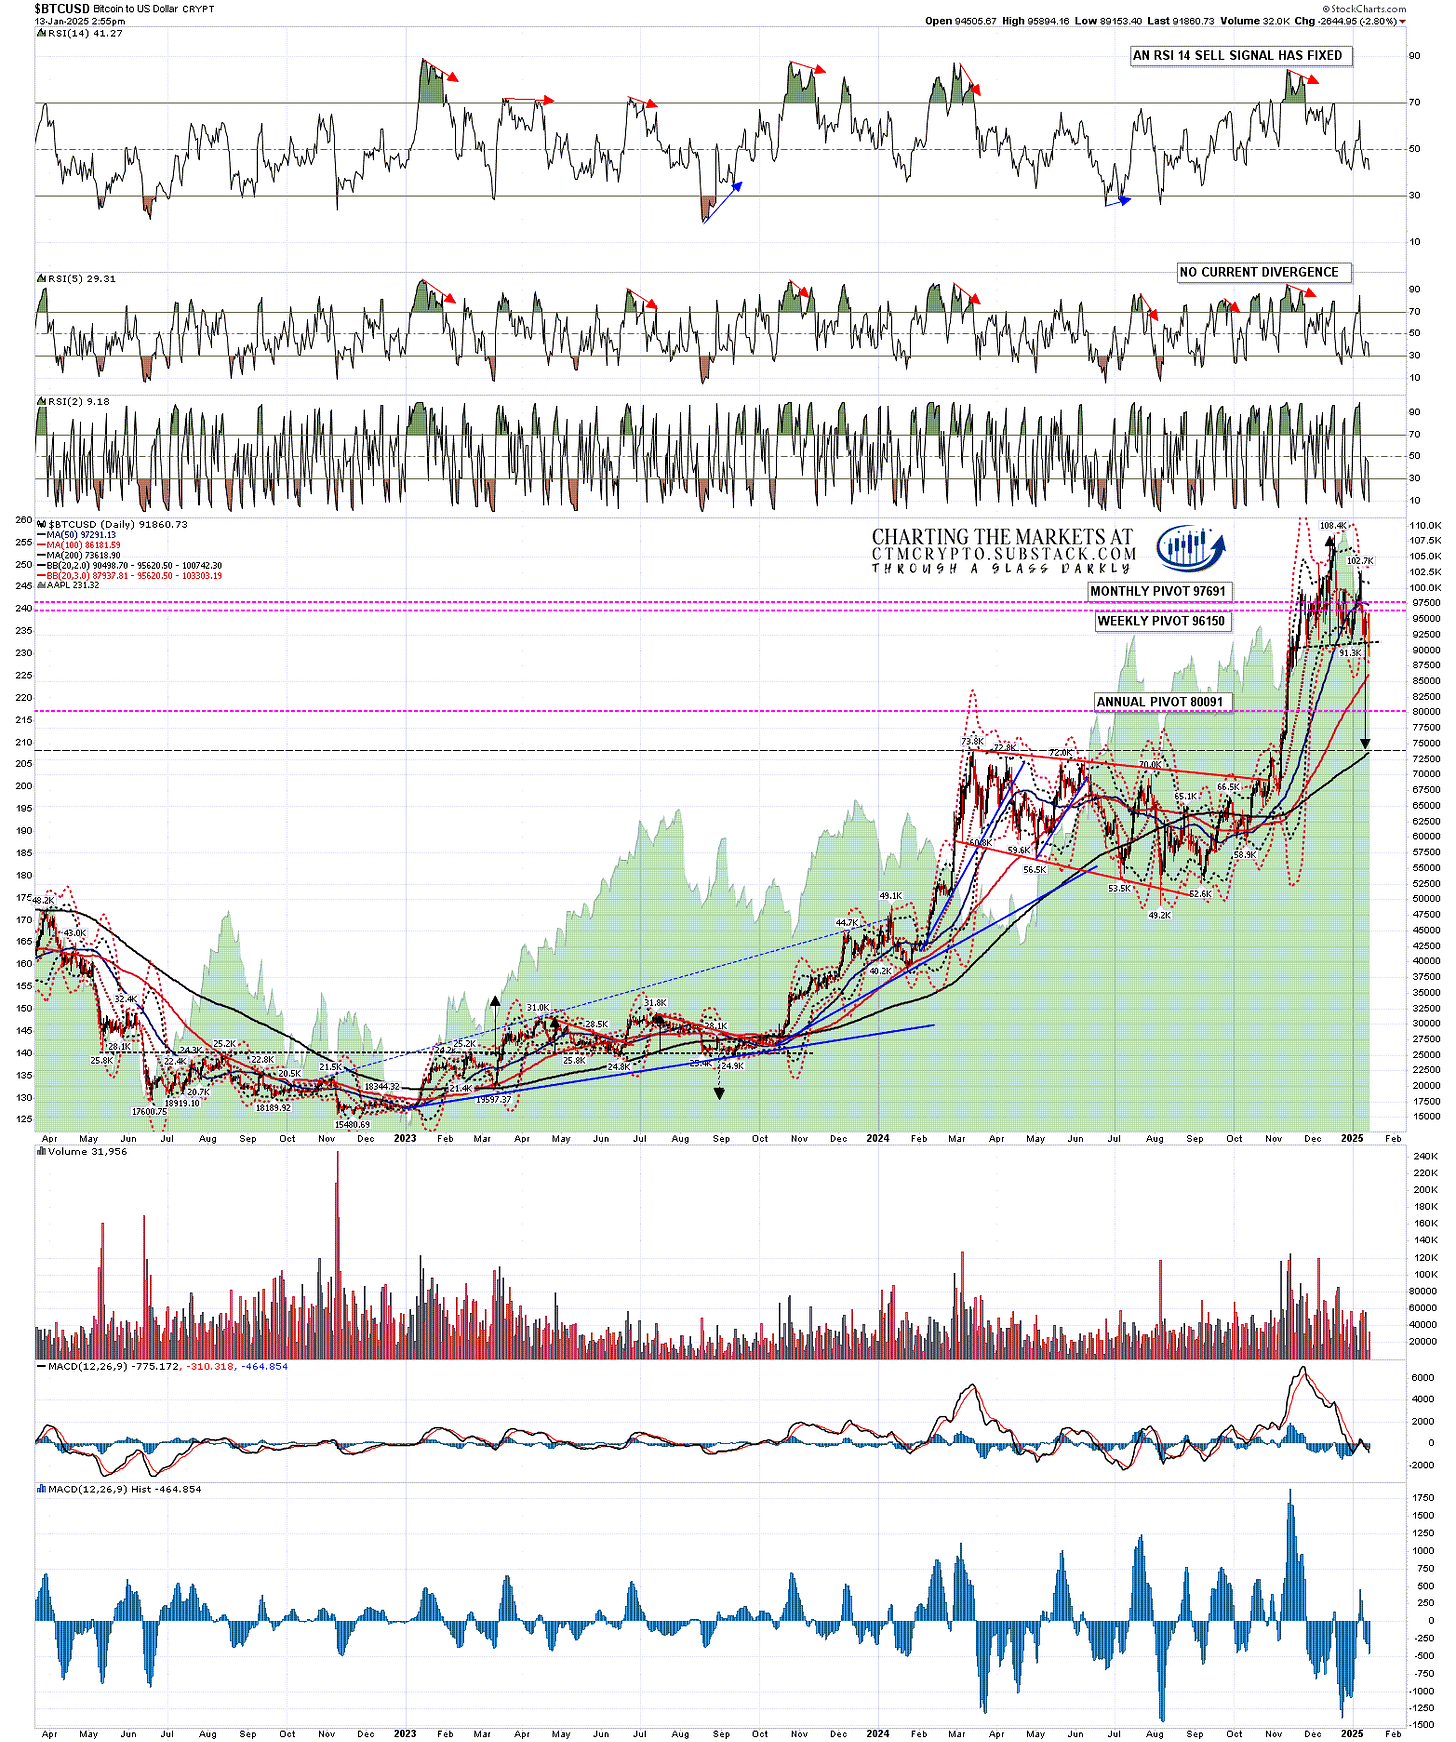
I was talking about the possible H&S forming on Crypto in my last Crypto post on 31st December 2024, and that H&S has now completed forming and has broken down with a target in the 74000 area, which is a particularly attractive target because it would be a backtest of the March 2024 high at 73.8k, which was an important high that lasted until November 2024. A backtest of that high would be a very logical target.
That doesn’t in fact make that target much more likely to be hit though. In terms of the pattern setup here we have a good quality H&S that has formed and broken down and there are now two clear options which are firstly that price goes to that 74k target or secondly that price rejects back up to a retest of the all time high at 108.4k. Most likely at this point, we will see one or the other of these options deliver.
BTCUSD daily chart:
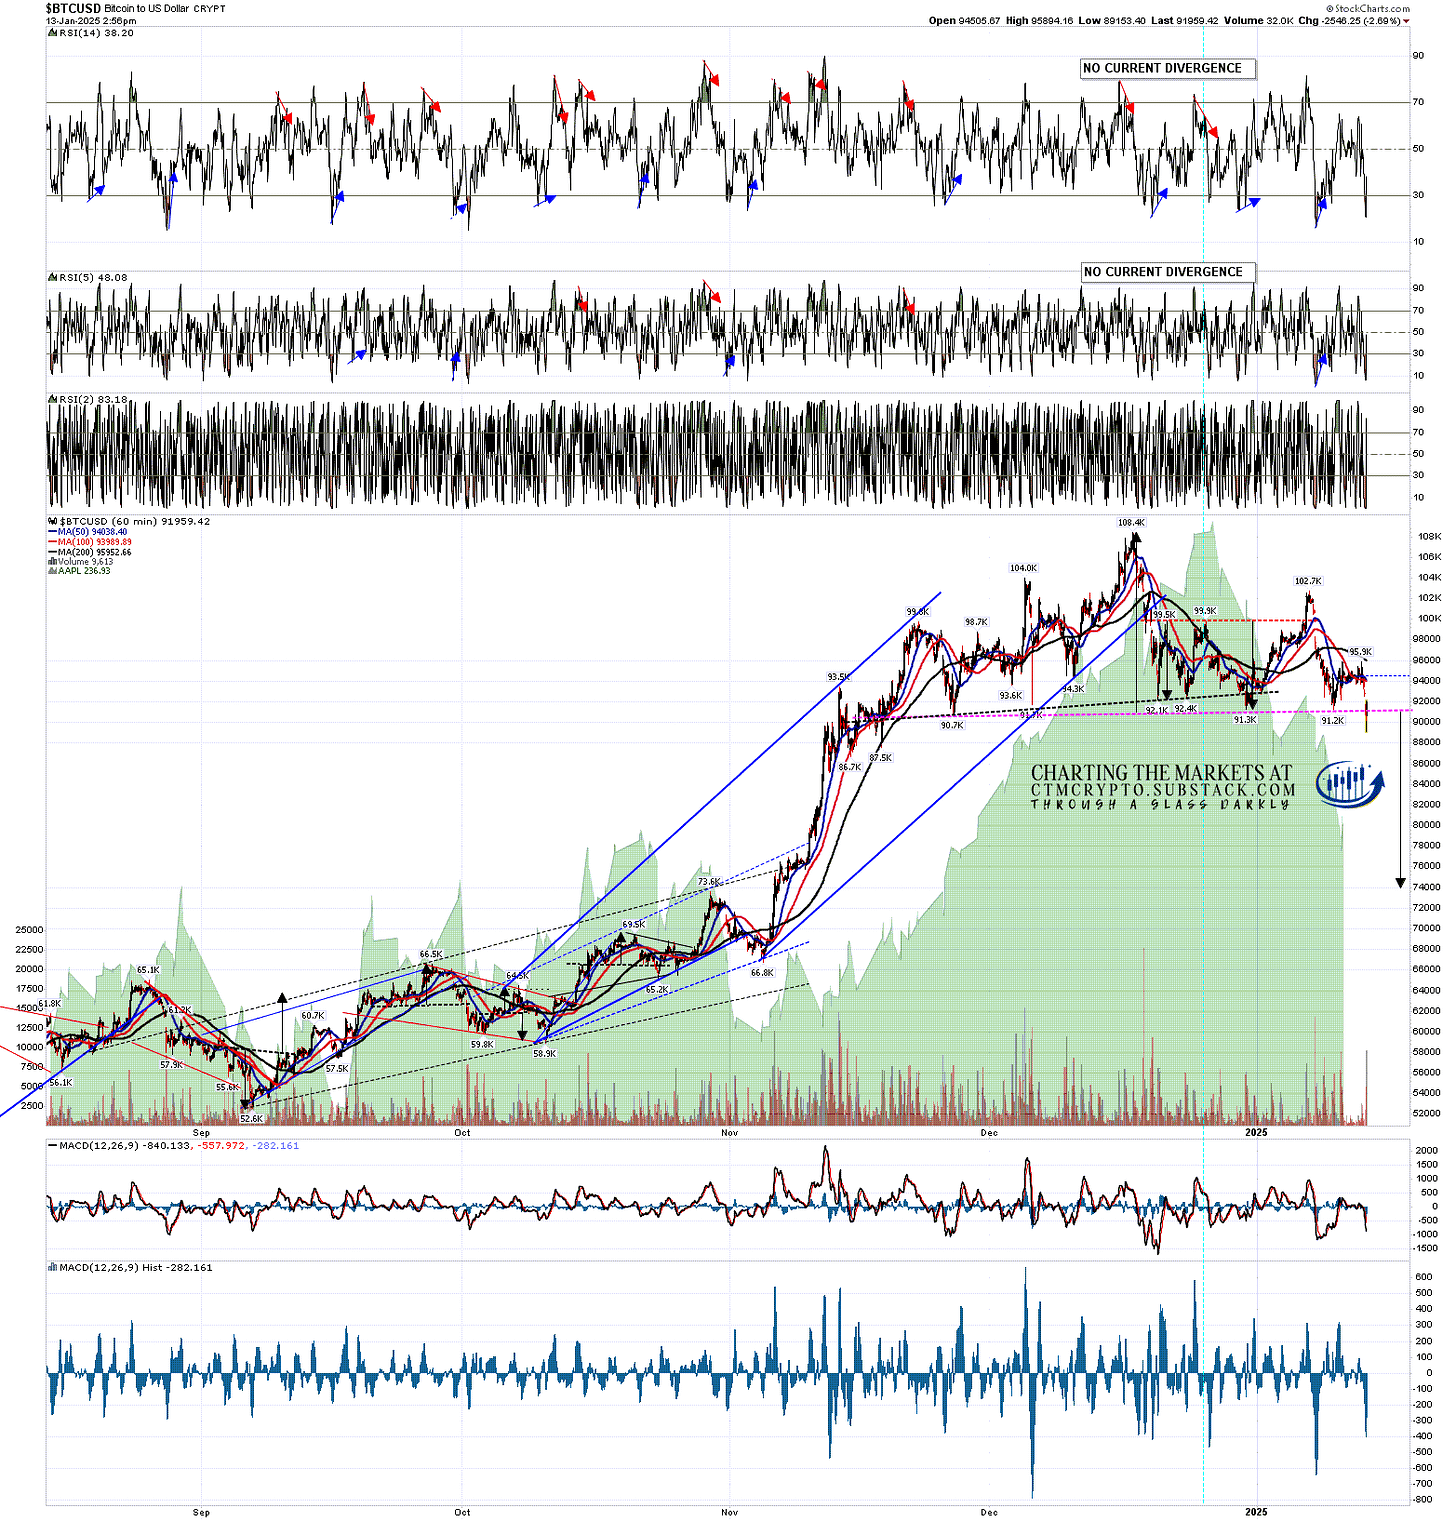
On the Bitcoin hourly chart this is a high quality pattern and formed in a classic way. If price can follow through hard to the downside this has a very decent shot at making that 74k target.
There is currently no positive RSI divergence on any of these Crypto hourly charts, but that could be fixed over the next trading day. That wouldn’t be required for a hard reversal back up here, but it would be a very helpful indicator.
BTCUSD 60min chart:
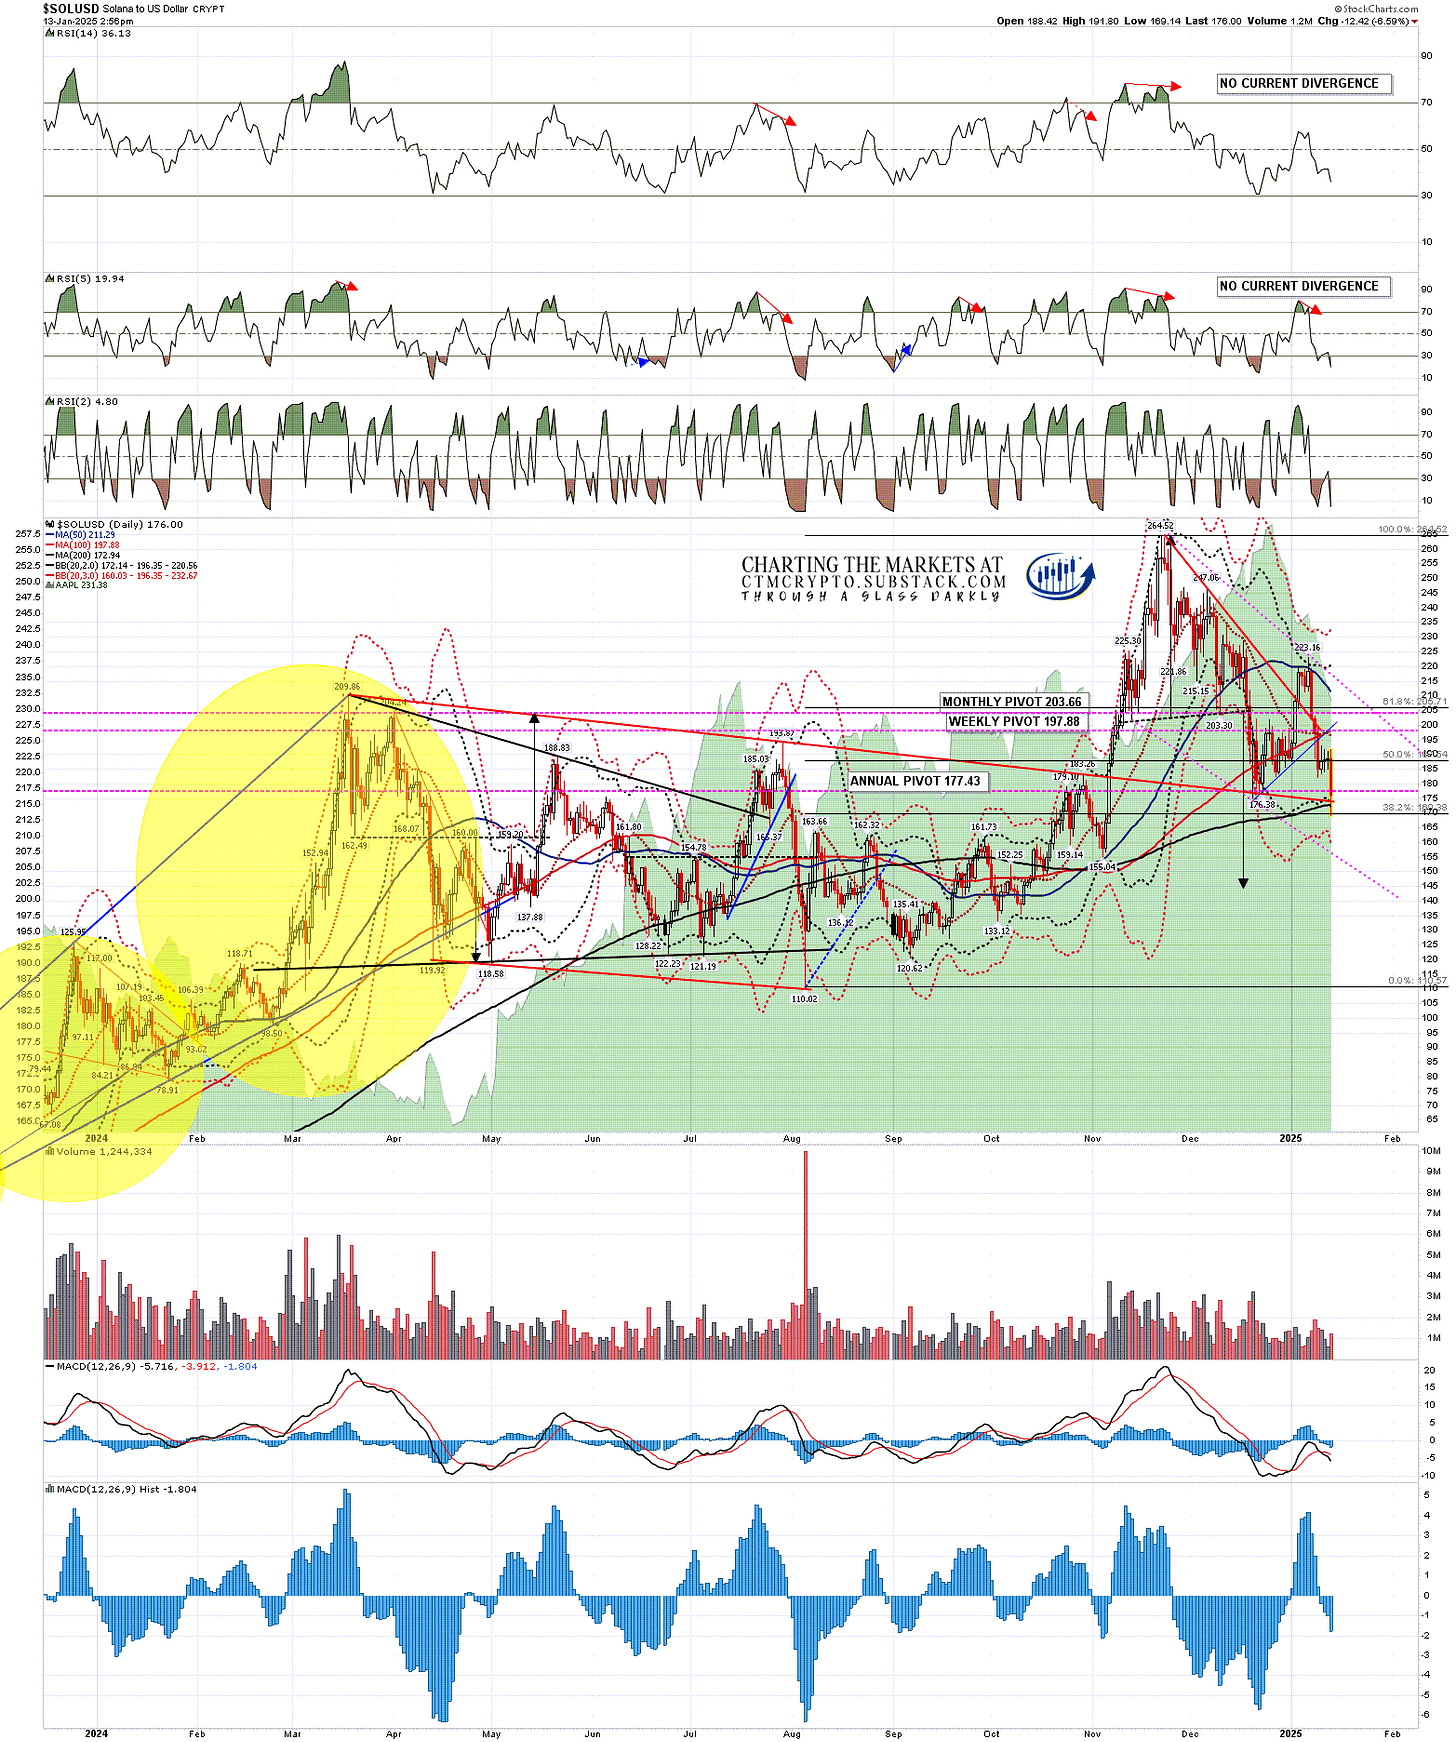
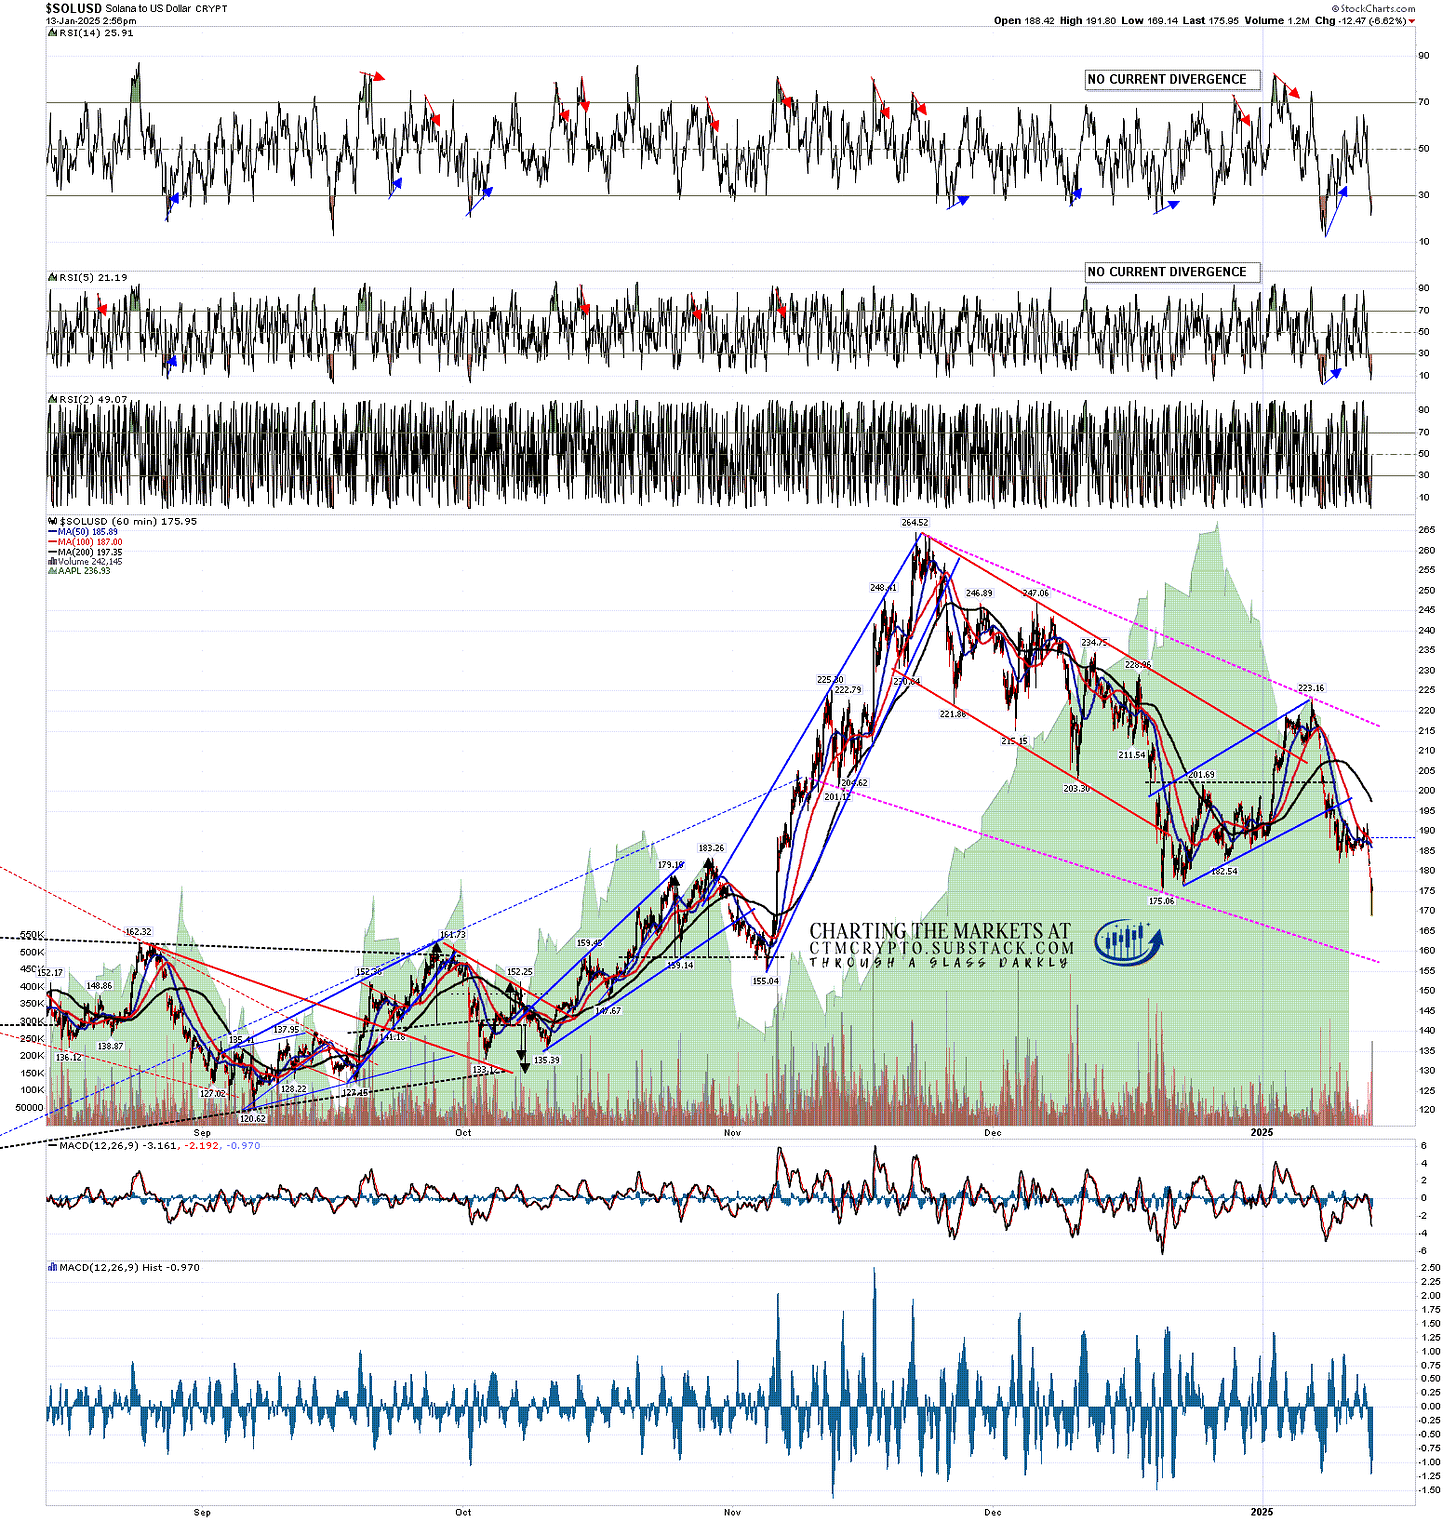
On Solana (SOLUSD) I was looking at a good quality H&S that had broken down with a target in the 145 area. There was then a strong rally but that didn’t invalidate the H&S so that 145 target is still open and may be reached.
SOLUSD daily chart:
On the hourly chart I’ve also drawn in a bull flag wedge that may be forming here. If Solana heads towards the 145 target and, it takes a couple of weeks to get there, then the 145 target may be reached with a test of that bull flag wedge support. An overall bull flag forming would make sense as in my view this move is likely to be a bullish consolidation.
SOLUSD 60min chart:
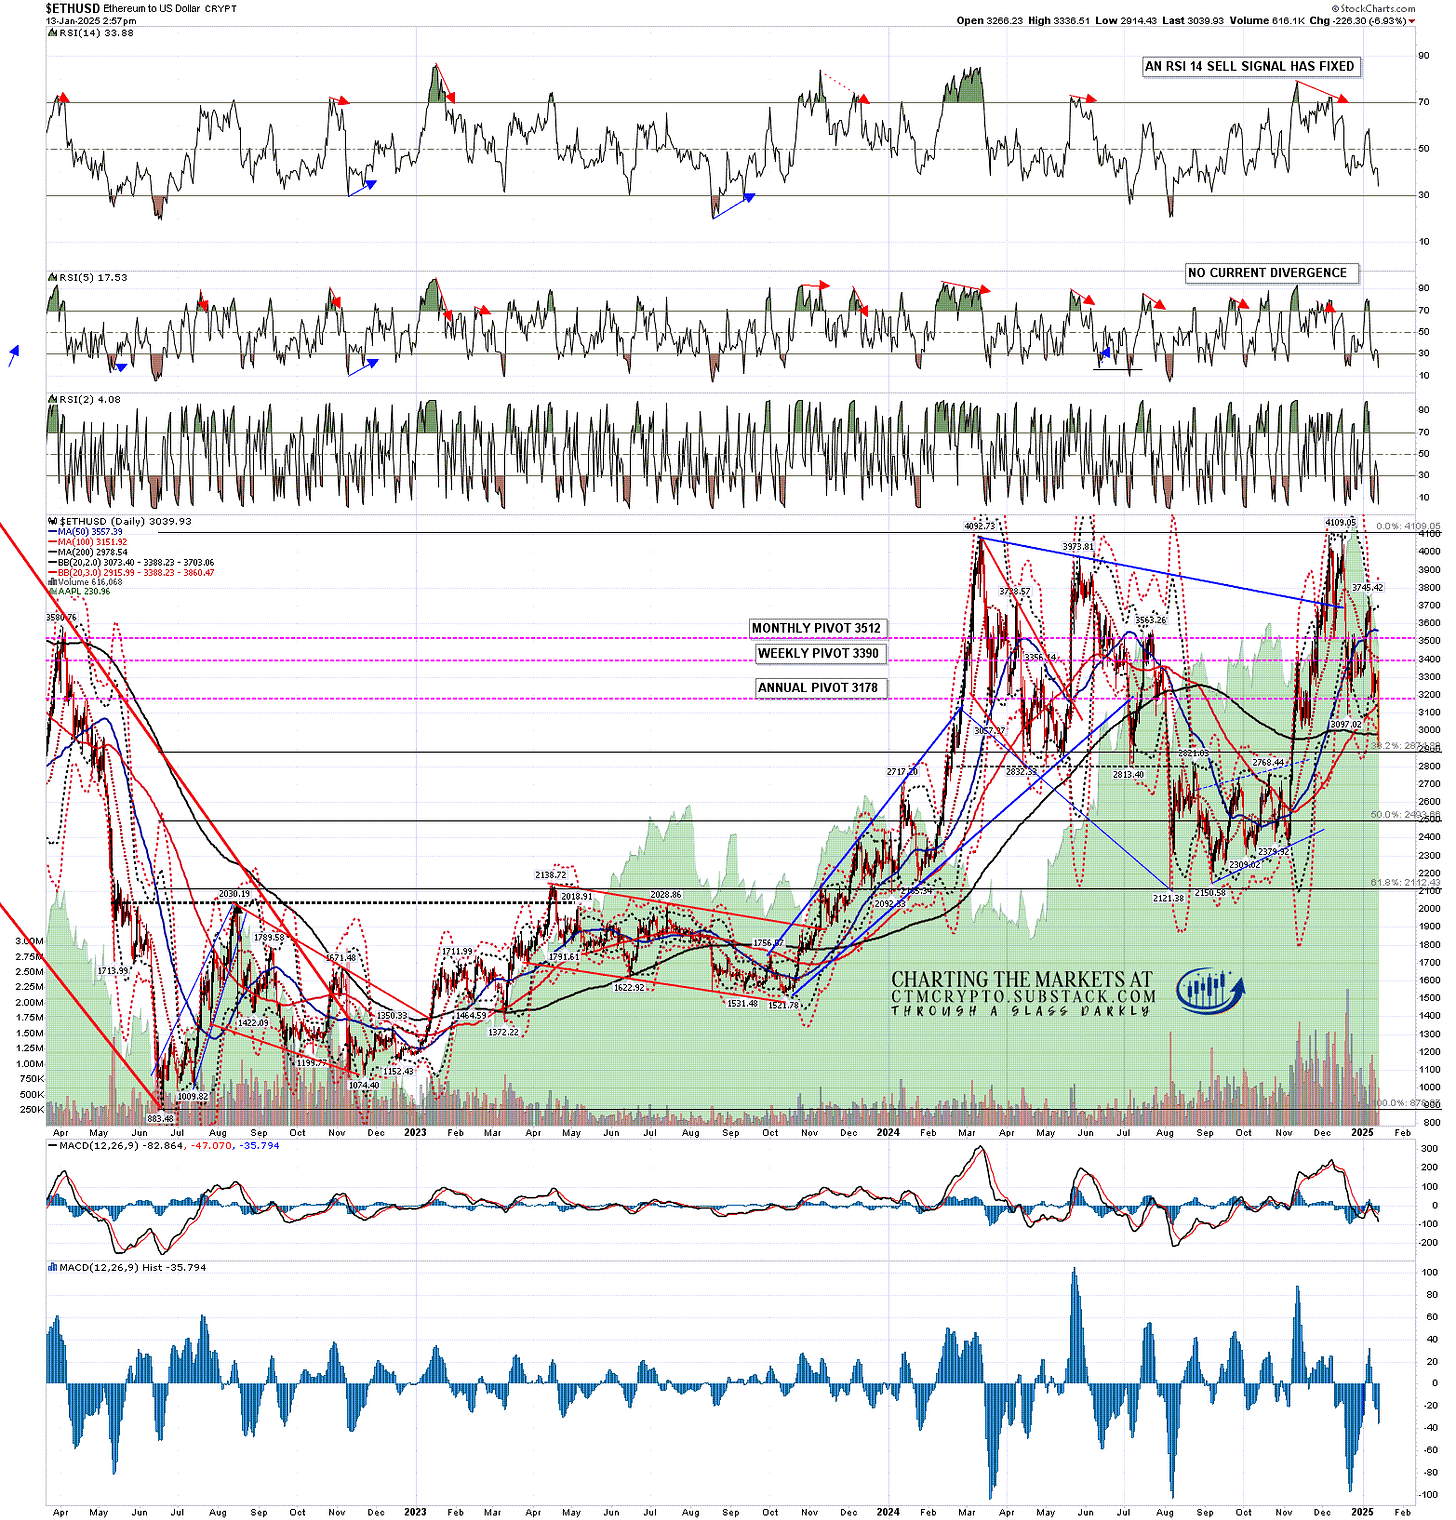
On Ethereum (ETHUSD) a small double top had broken down in mid December with a target in the 2910 area and that target has almost been reached today, with the low on Ethereum today at the time of writing at 2914.43. This is also a test of the 200dma, currently at 2979, and would be a great area to make a low. If price nonetheless follows through to the downside and the 200dma becomes resistance then that opens the lower target, which in this case is impressively ambitious.
Over the last couple of months Ethereum has retested the March 2024 high at 4092.73 and made a marginally higher high at 4109.95. That has technically now formed a double top setup that on a sustained break below the August 2024 low at 2150.58 would look for a target in the 40 area, almost entirely wiping Ethereum out.
That is interesting but I have seen a lot of similarly apocalyptic patterns form in the past and they hardly ever play out to target. That is therefore not the main pattern I’ve been watching, but it does highlight the importance of the 2000-2150 area as key support on Ethereum, as an area which has also held as resistance or support on significant tests an impressive seven times since mid-2022. This area is the target of the pattern that I have actually been watching and has now broken down, and that I am thinking might make target.
That pattern is the high quality H&S that has formed on the Ethereum chart since late November, and which has now broken down with target in the 2100 area. If the larger double top on Ethereum breaks down I wouldn’t be taking the downside target seriously but, it might well set up a strong rejection from this key support level that would target a retest of the December high at 4109.95. In effect the double top might therefore be a disguised bull flag setup, and I see those form and play out a lot.
ETHUSD daily chart:
I have been asked a lot whether the bull market high on Crypto might be in, and the answer is obviously yes, but I don’t think that is likely. If you missed the historical breadown I did on my post on 31st December you can see there the reason why I think that. My preferred scenario here is that we see a bullish consolidation either now or soon on Crypto that takes a few months and sets up the next big leg up on Crypto into a possible bull market high in late 2025.
One way or another this should be an interesting year on Crypto. :-)
If you’d like to see more of these posts and the other Crypto videos and information I post, please subscribe for free to my Crypto substack.
I do a premarket video every day on Crypto at 9.15am EST. If you’d like to see those I post the links every morning on my twitter, and the videos are posted shortly afterwards on my Youtube channel.
I'm also to be found at Arion Partners, though as a student rather than as a teacher. I've been charting Crypto for some years now, but am learning to trade and invest in them directly, and Arion Partners are my guide around a space that might reasonably be compared to the Wild West in one of their rougher years.


No comments:
Post a Comment