In my last post on Tuesday 7th January I was looking at the bull and bear options at the inflection point that had been forming on US indices over the previous few days. On Friday the US indices closed at the bottom of the inflection point and I was talking about that on my The Bigger Picture webinar last night, and what might be in store for us today.
Since then, at the time of writing, ES is down 45 handles, which is a clear break down. Are the US indices now resolving to the downside? Not quite yet in my view.
There is also the reality that any big bull or bear setup, like an H&S pattern or a flag, can break in the other direction, and the most likely time to see that on both is just after the first break. When any decent quality H&S breaks down (or up), there are two clear options, the first being that price breaks down (or up) towards the H&S target, and the second being that price rejects back up towards the top of the H&S head, undoing the reversal pattern, with the break over the right shoulder high being the point at which the H&S pattern has failed.
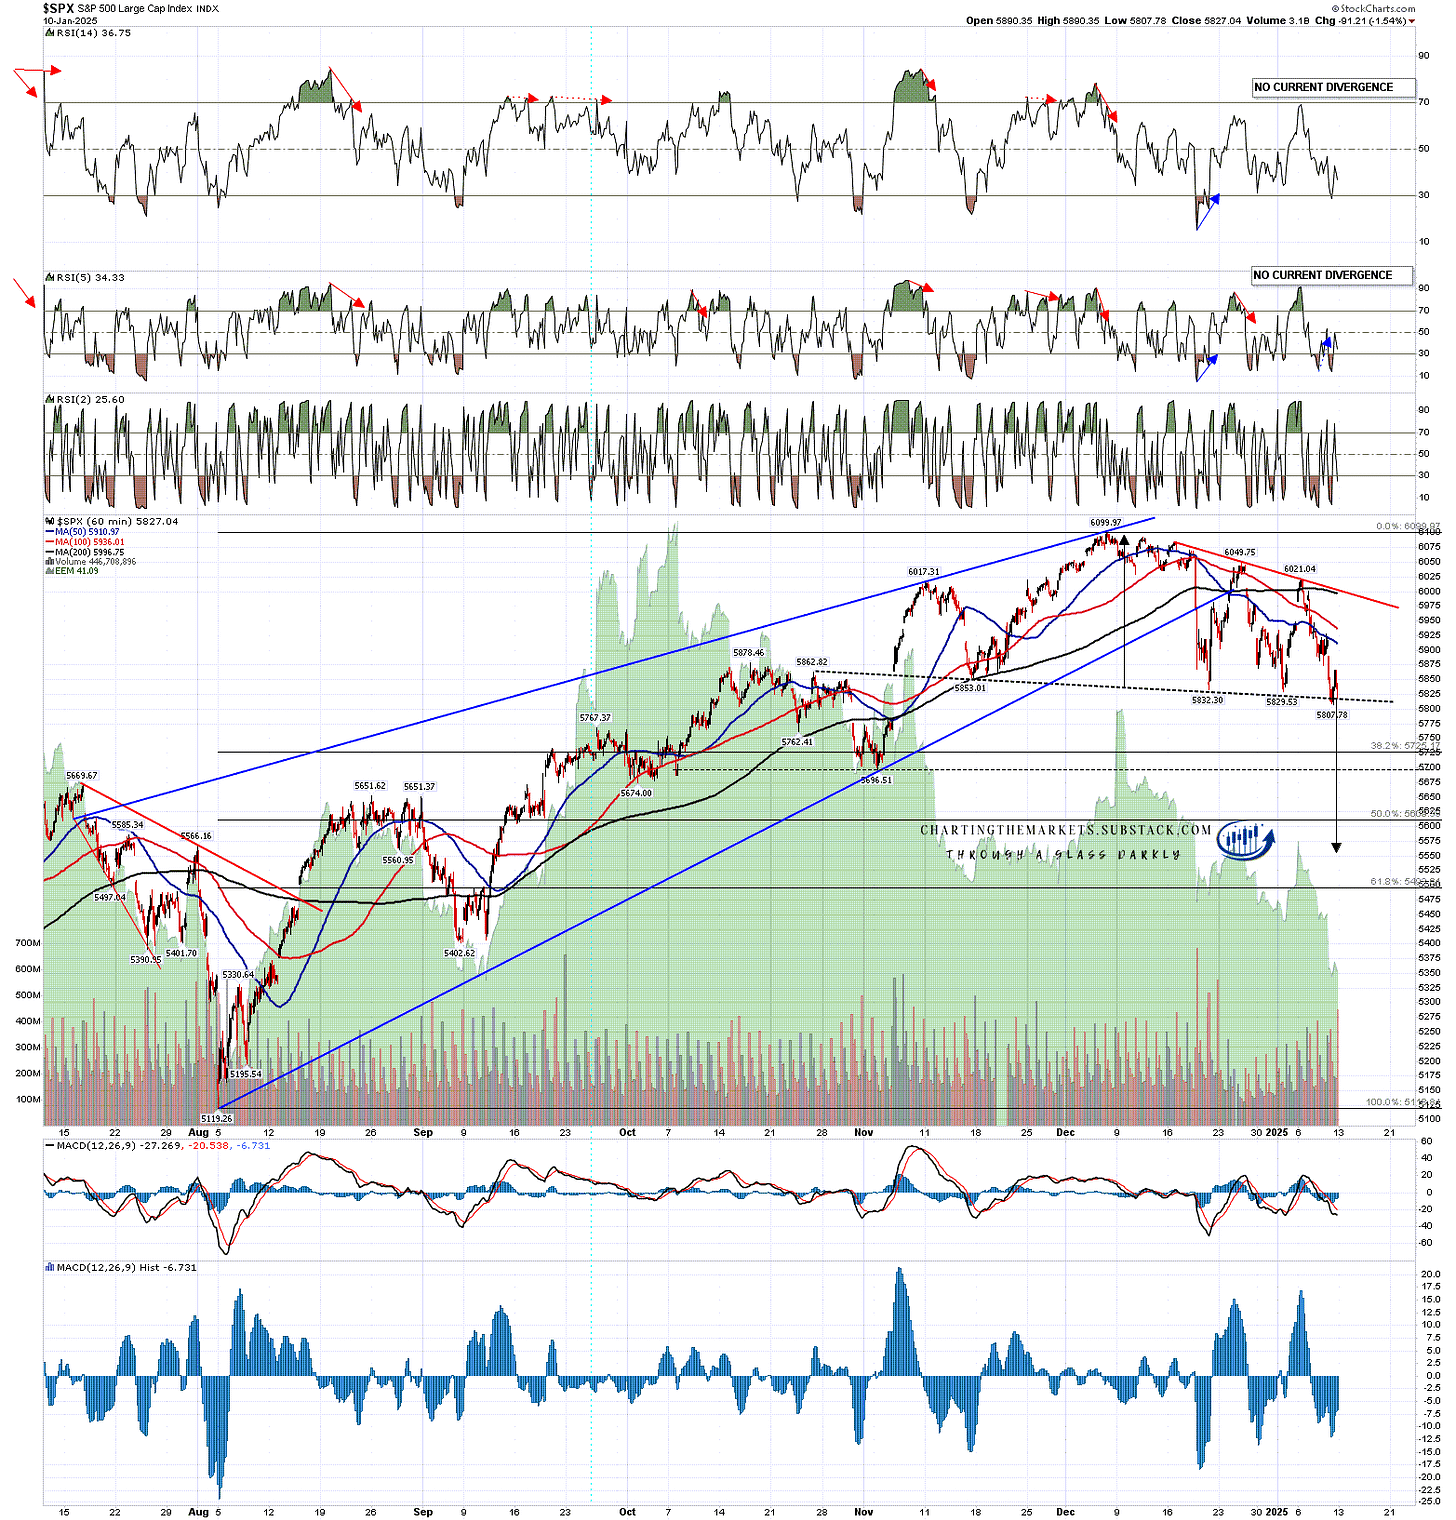
So how’s that looking here? Well on SPX the H&S I have been watching form for the last few weeks broke down with a target in the 5550 area on Friday afternoon, and if price follows through with a sustained move down today, then that is the target I will be looking for.
We can already see possible hourly buy signals brewing on the futures for the US indices, and we could see similar buy signals forming on SPX on a lower low under Friday’s low in the first hour this morning. If those fix that will be bullish and, on a break over the right shoulder high at 6049.75, the H&S would fail with a target at a retest of the all time high at 6099.97.
There is more though. It sometimes happens that more than one pattern forms as an H&S is forming, and in this case a possible bull flag wedge has also formed with the (red) declining resistance trendline currently in the 6000 area. On a break over that I would be leaning heavily towards an all time high retest.
SPX 60min chart:
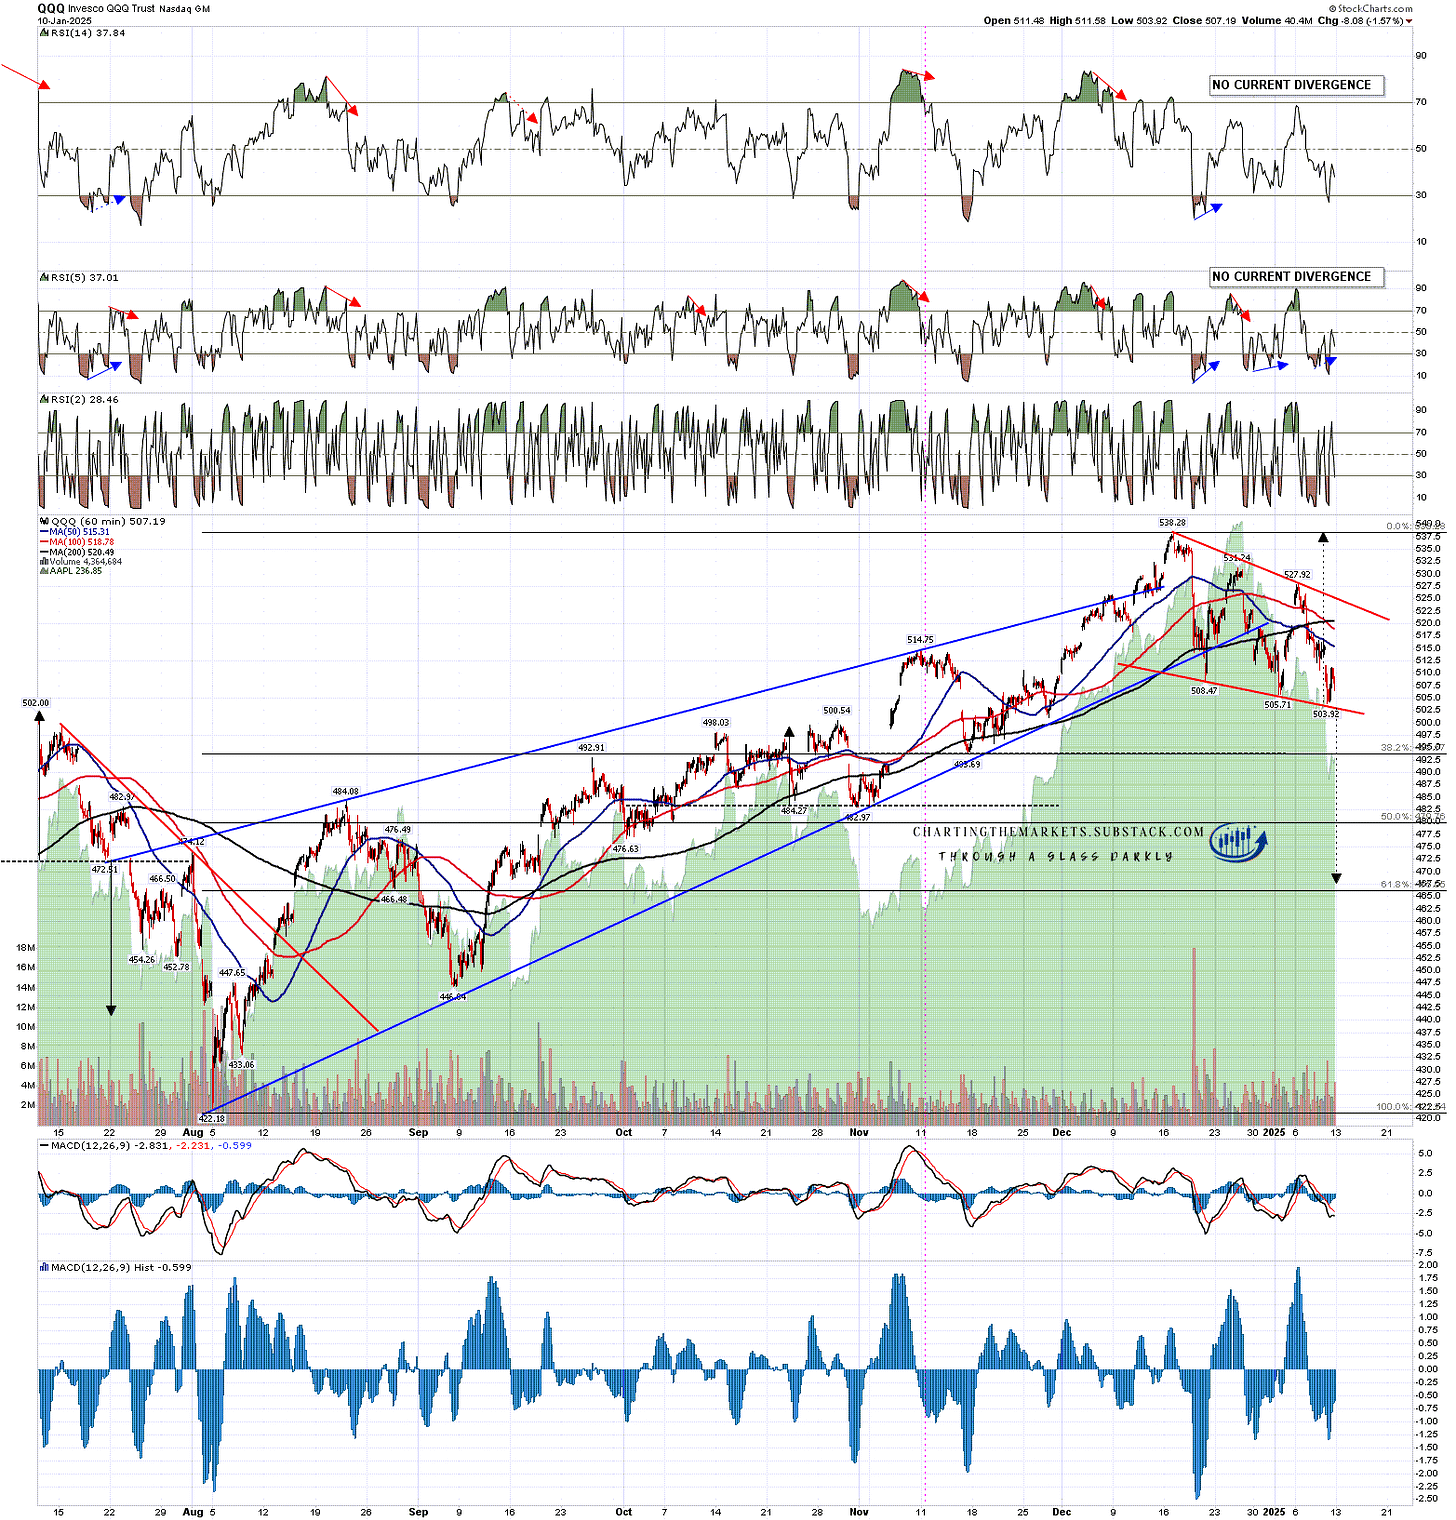
As I was showing in my last post, there is no obvious topping pattern on the Qs and there is a very decent quality bull flag, which was testing the flag trendline I showed late December at the lows on Friday. If that breaks up (70%) then the target will be at a retest of the all time high there. If the flag breaks down (30%) and follows through on that break, then the bull flag was a disguised topping pattern, and the target would be in the 467.50 area, close to the 61.8% fib retracement of the move up from the August low.
As with SPX, breaks below the Friday lows this morning could set possible hourly RSI 14 and RSI 5 buy signals brewing on QQQ.
QQQ 60min chart:
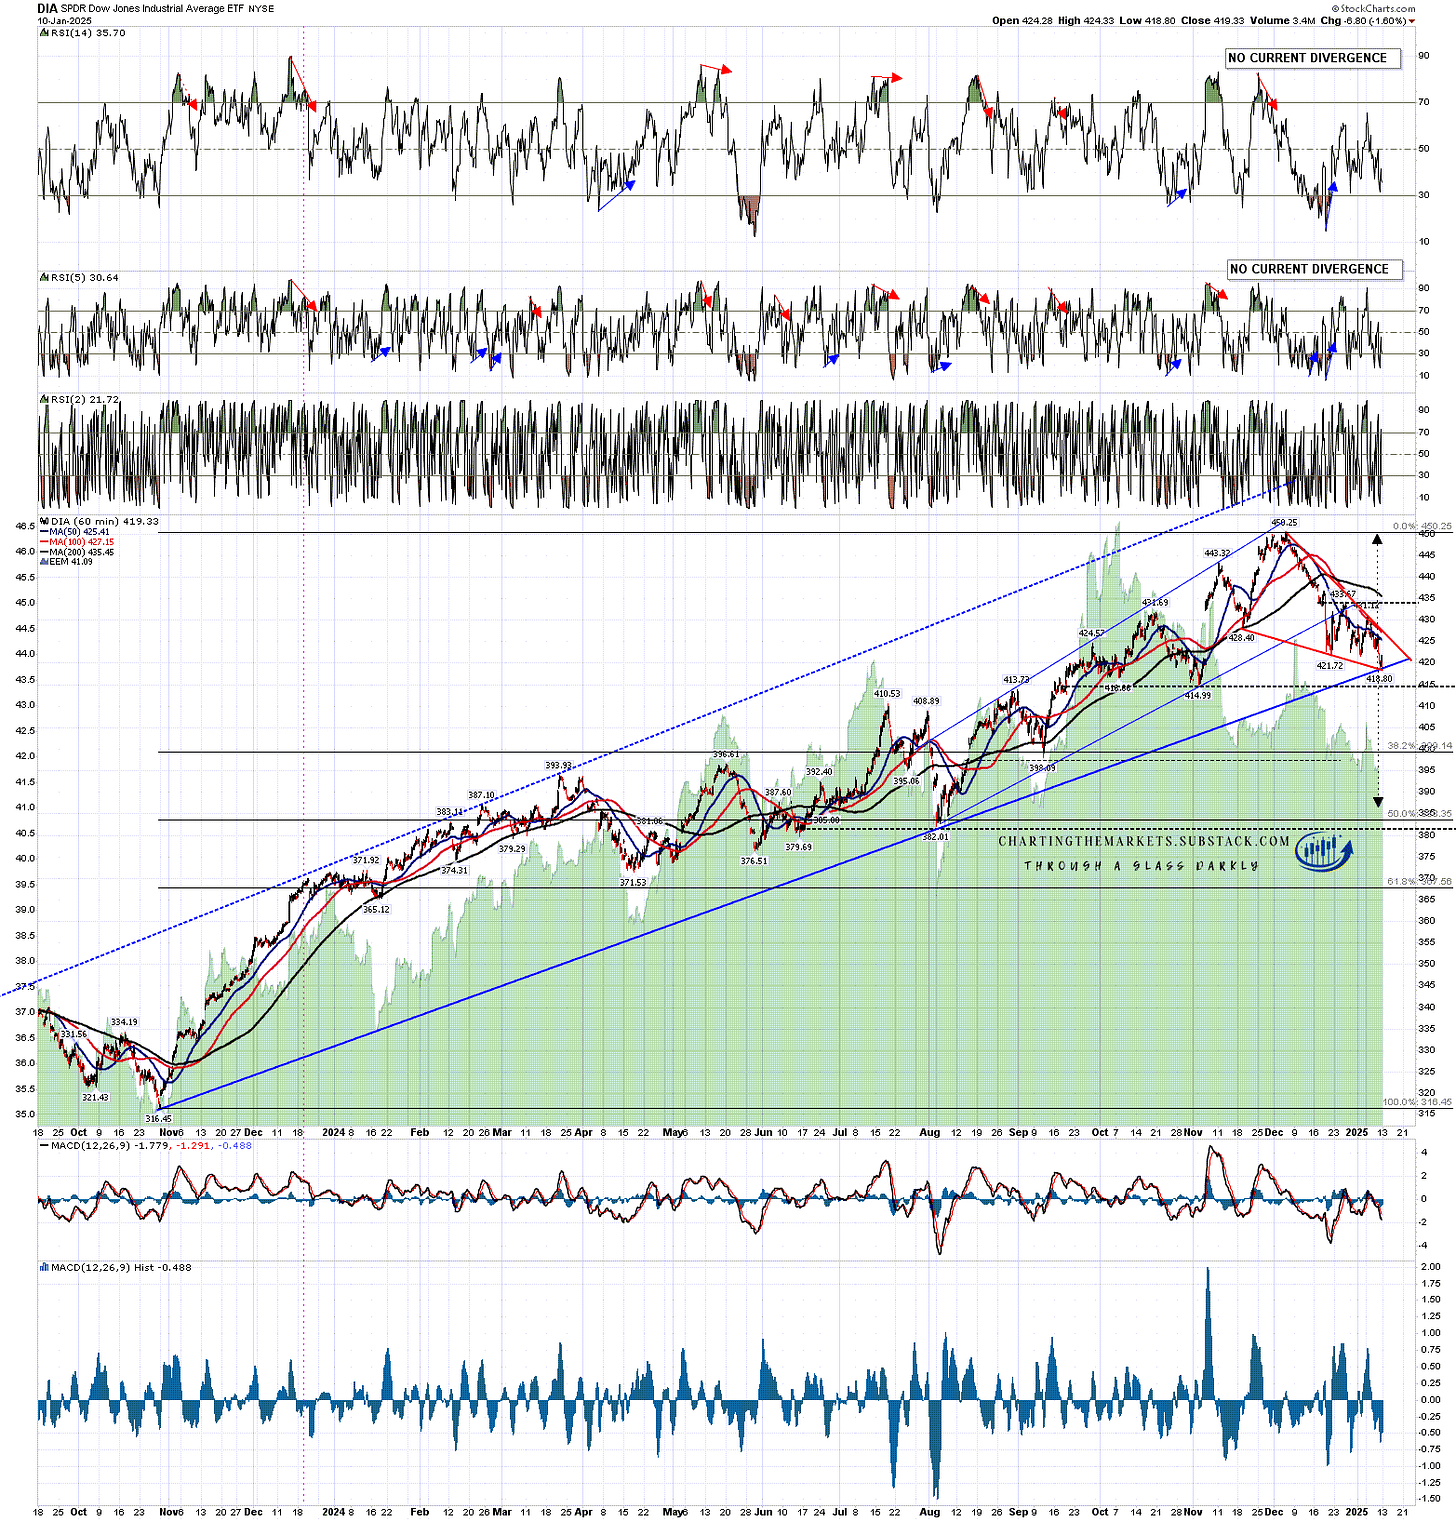
On DIA there is also no obvious topping pattern, and there is also a possible bull flag wedge forming. In addition the low on Friday was a test and slight break of rising support from the late October 2023 low. A break up from the flag would have a clear target at a retest of the all time high at 450.25.
If we see a break down and follow through today then the flag target would be in the 386.5 area, retracing most of the move up from the August low, and a little under 50% of the move up from the late October 2023 low.
A lower low this morning could set a possible hourly RSI 5 buy signal brewing.
DIA 60min chart:
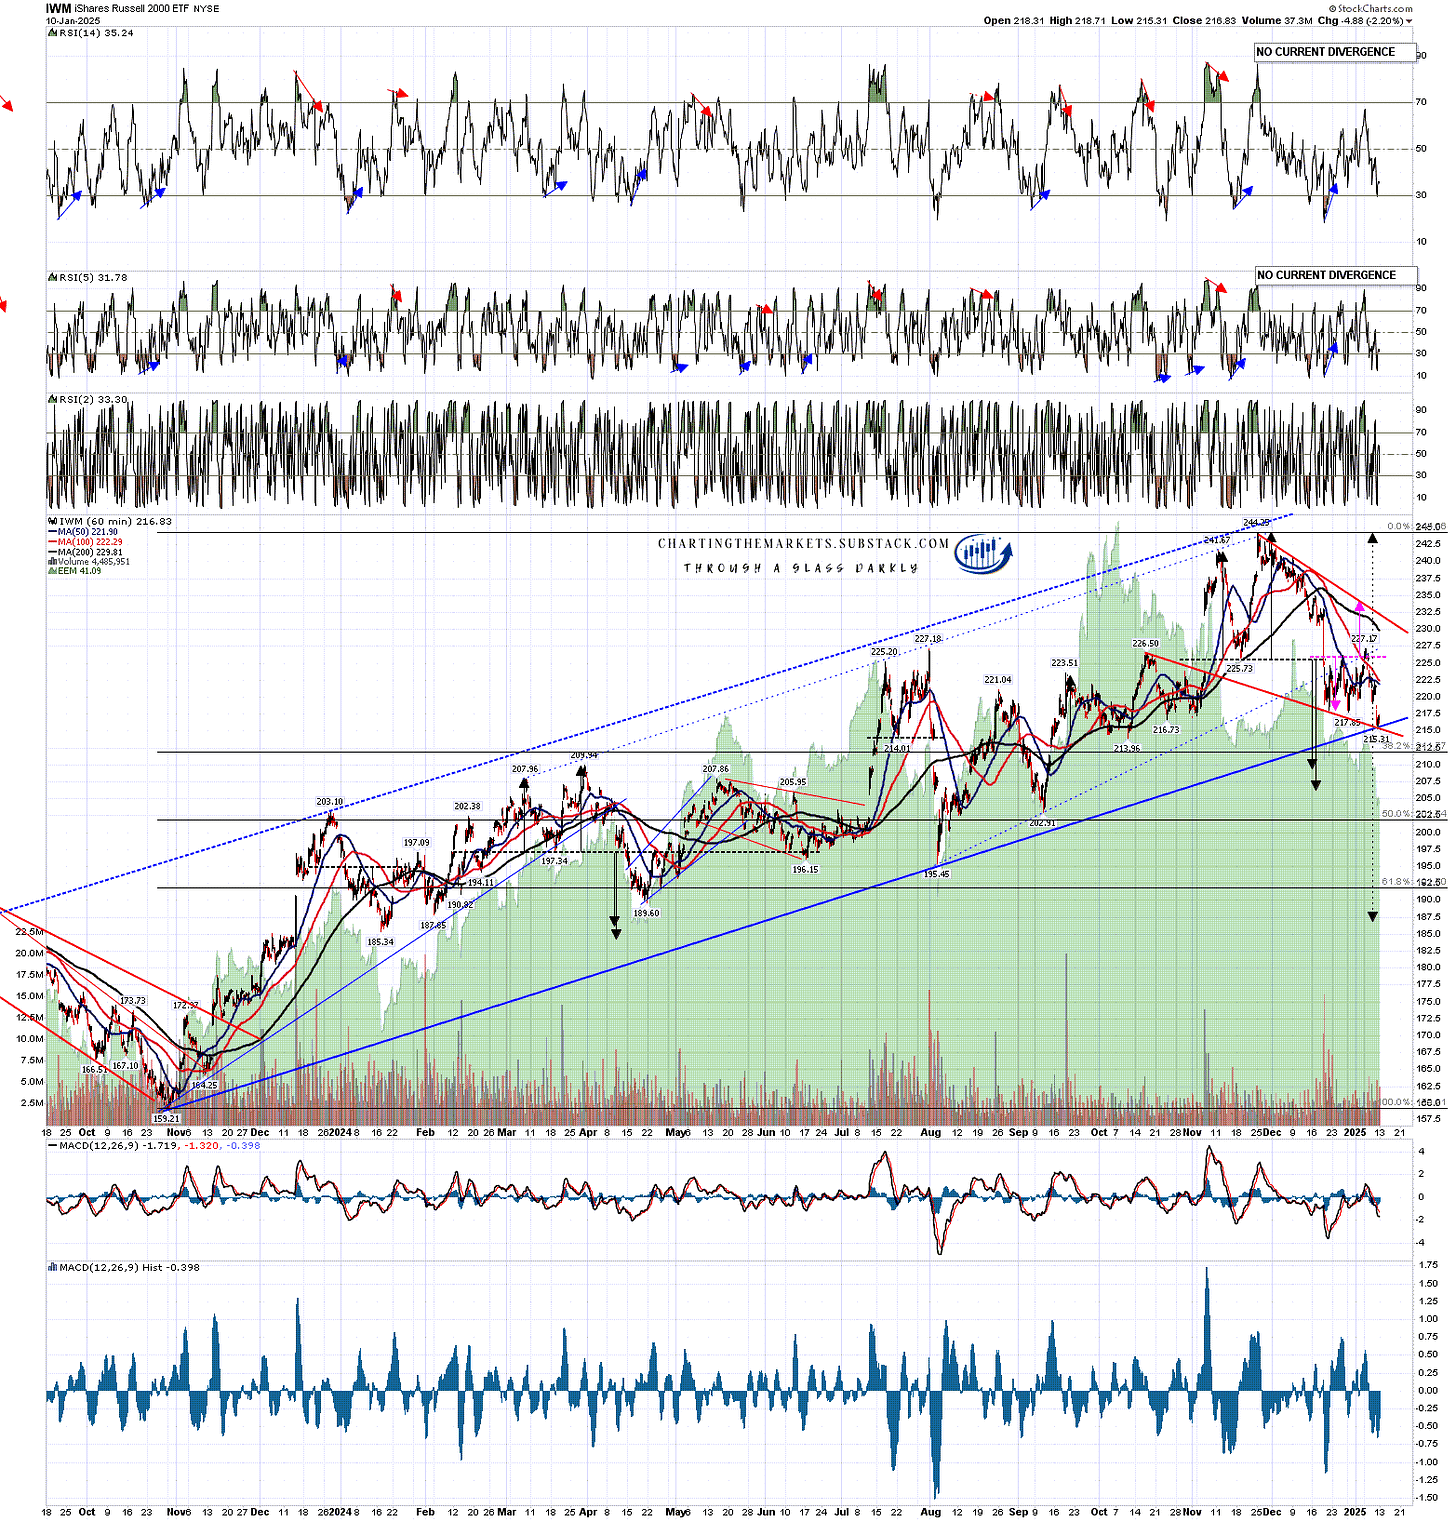
In my last two posts I mentioned the double top on IWM that had broken down with a target in the 206-9 range, and that is still very much in play. The double bottom that has broken up in my last post failed back into the lows and IWM also now has a decent quality bull flag forming, and also tested the rising support trendline from the late October 2023 low at the low on Friday.
The setup here on IWM is similar to the one on DIA, but with more targets, as a possible H&S has also formed and broken down on Friday, with last week’s failed double bottom being the right shoulder on that H&S. On a hard break down today the flag target would be in the 187.5 area.
A lower low this morning could set a possible hourly RSI 5 buy signal brewing.
IWM 60min chart:
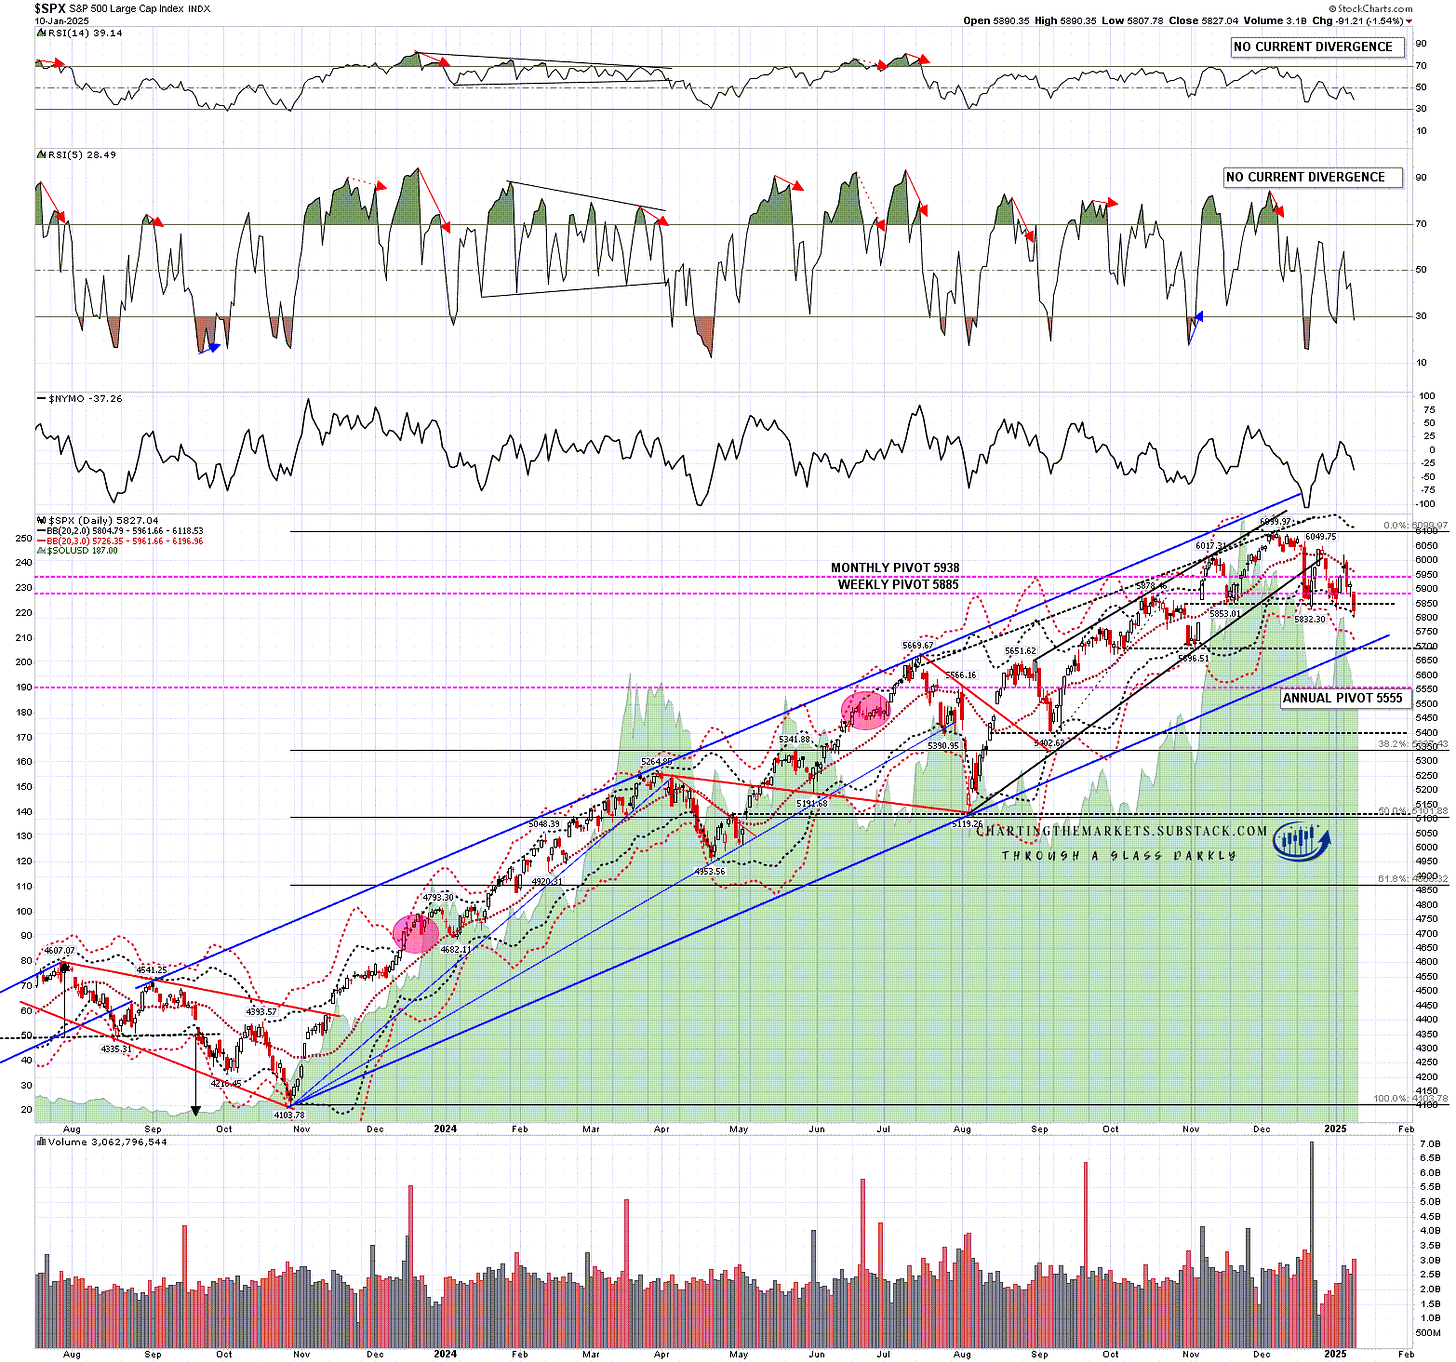
I was saying in my last post that SPX needed to convert back over the daily middle band and it failed there again. It’s not too late for that to change but this is the point of decision for these scenarios. If SPX heads down instead then the daily bollinger bands are now expanding and should expand rapidly as that downmove progresses. For today I have the daily 3sd lower band a hundred handles or so below Friday’s close, and if SPX makes it down there today, the 3sd lower band might by then be a further 25-50 handles lower. There is now plenty of room to the downside.
SPX daily chart:
Price will give us the decision on the way this breaks, and likely we see that decision today or tomorrow at the latest. My lean is somewhat in favor of the bear scenario, but I wouldn’t be at all surprised to see a break up. If we do see retests of the all time highs on SPX, NDX, and Dow, then those retests may well make the second highs of double top patterns to deliver a similar downmove to the one I’ve been looking at today after those high retests.
I’m leaning towards a weak first half of 2025 and new all time highs later in the year, very possibly as a topping process for a much more significant high. Whichever way this breaks would be fine for that scenario.
One way or another I think we’ll be seeing lower soon and I’m not expecting this to be a good year for US equities. The last two years have been banner years for US equities. A third straight year of these kinds of gains looks like a big stretch.
If you like my analysis and would like to see more, please take a free subscription at my chartingthemarkets substack, where I publish these posts first.
I also do a premarket video every day on equity indices, bonds, currencies, energies, precious commodities and other commodities at 8.45am EST. If you’d like to see those I post the links every morning on my twitter, and the videos are posted shortly afterwards on my Youtube channel.

No comments:
Post a Comment