
In my last post yesterday I was looking at the big inflection points in the current rally on US equity indices that could take SPX and QQQ, and perhaps also DIA and IWM, to retests of their late 2024 all time highs.
The first inflection point in this process was at the Monday’s lows and key support, and they rallied there.
The second inflection point was after the initial rallies, and they pushed through to the upside there.
The third inflection point we reached this morning, and if we are to see this move fail hard, then this is the most likely remaining place to see that. Equally, if bulls push through this, on SPX there is a clear path to the all time high retest and that would likely be made.
In my premarket video this morning I was looking at the setup here but I wanted to do a post as well because these posts are a nice little example series examining in detail how a reversal like this works.
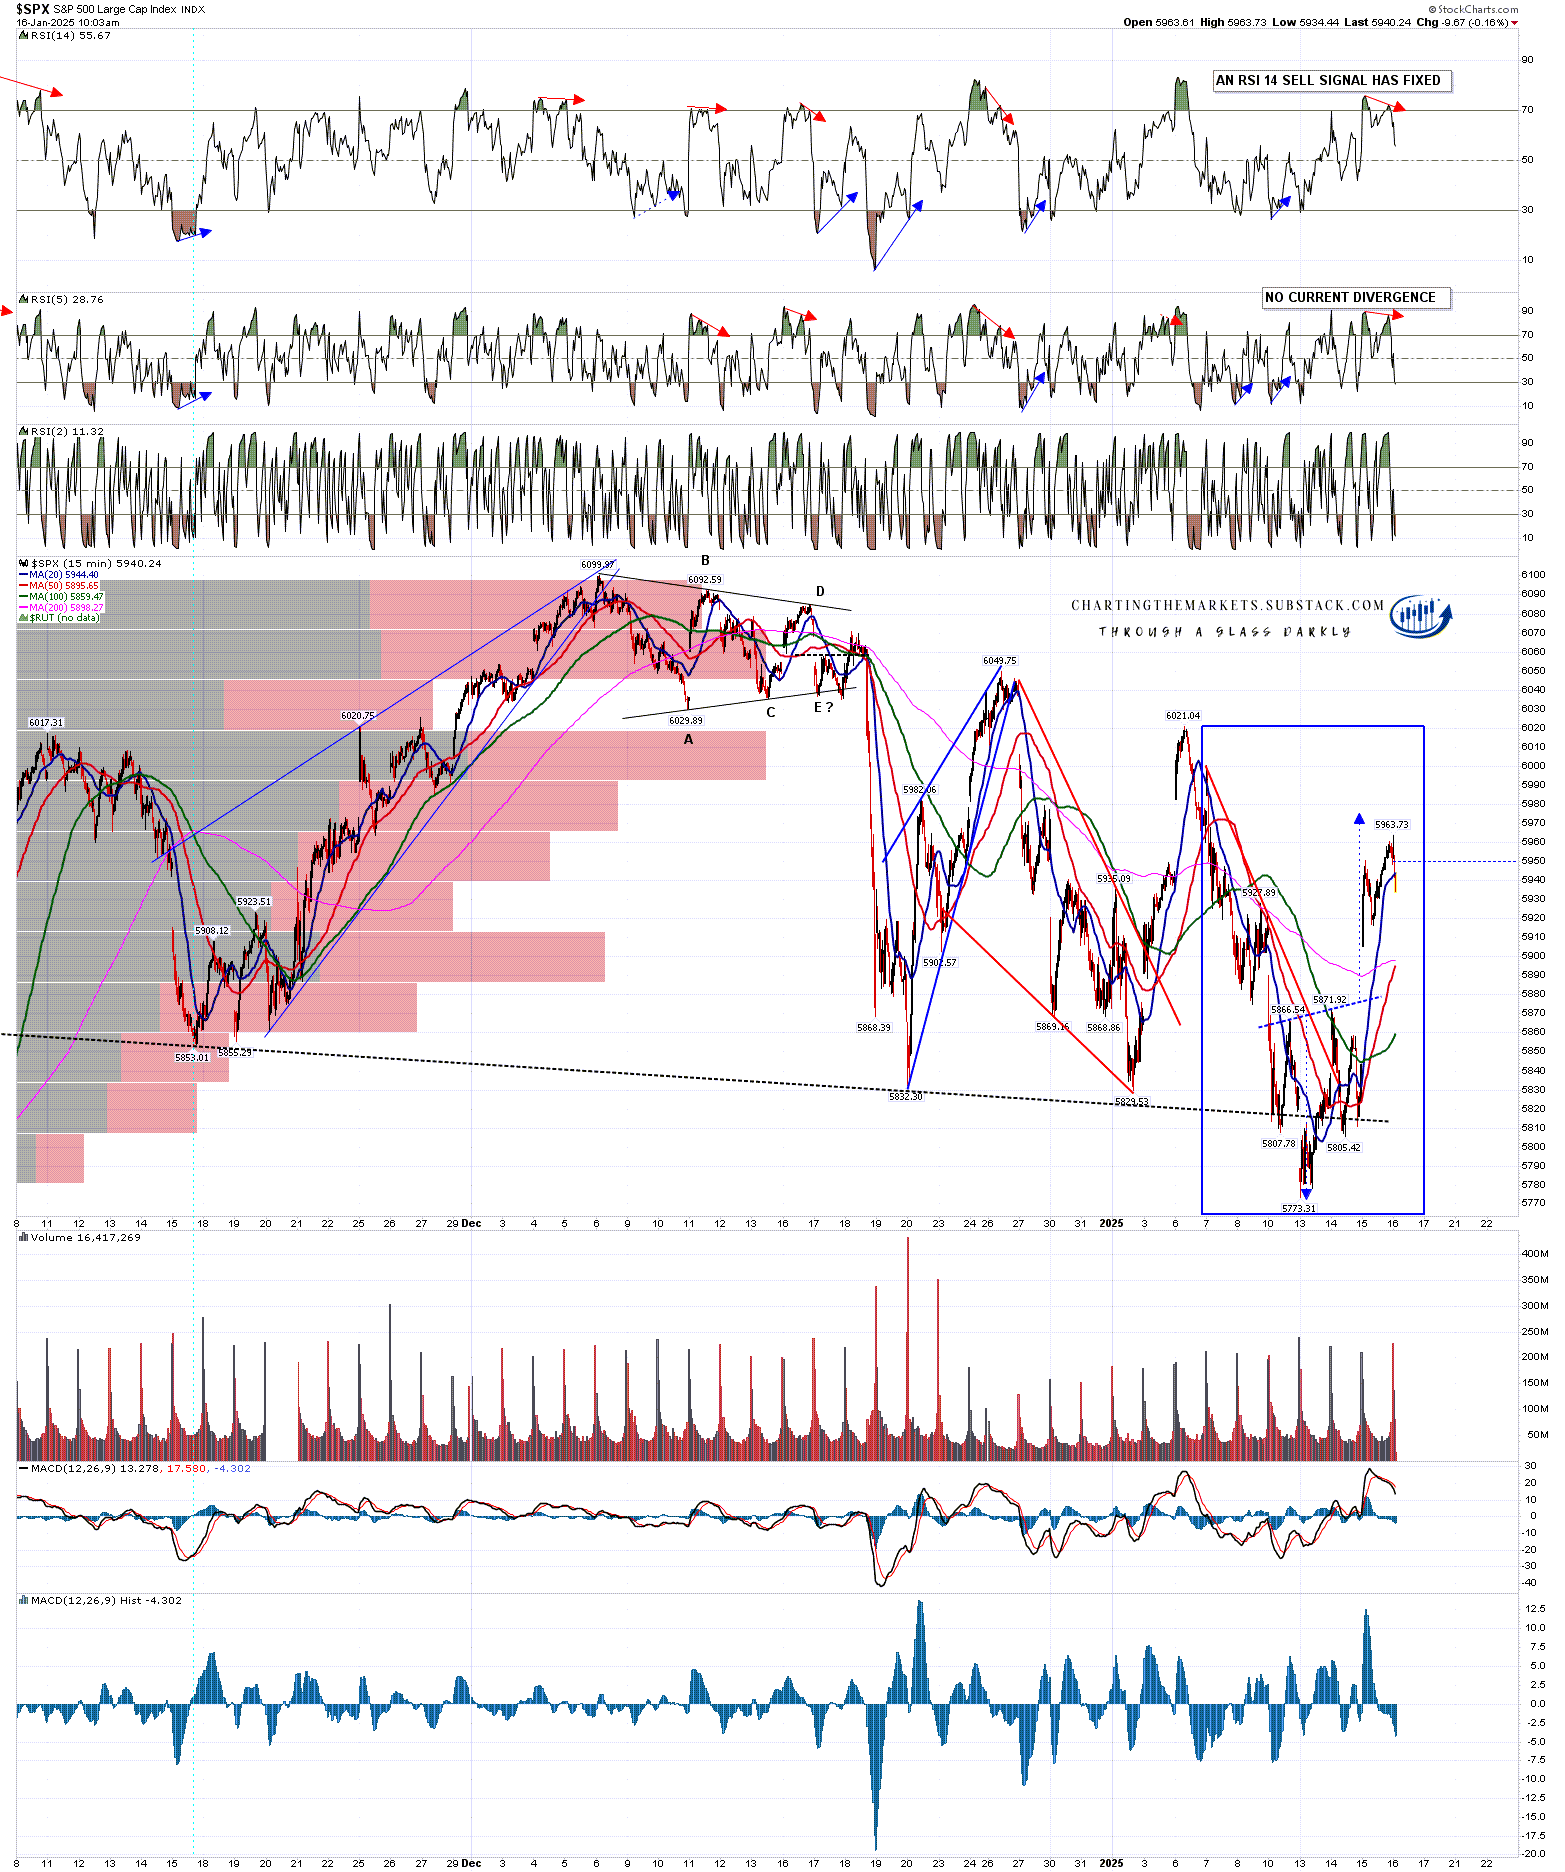
The good quality IHS that I was looking at yesterday on SPX broke up and has come very close to target. Hourly RSI 14 and RSI 5 sell signals were brewing at the close yesterday and fixed this morning, with the RSI 5 sell signal having now also made target this morning. A retracement or consolidation was likely and is now in progress.
On the bull scenario this is a bullish consolidation acting as a springboard to higher highs. On the bear scenario this is the start of a hard fail before lower lows.
SPX 15min chart:
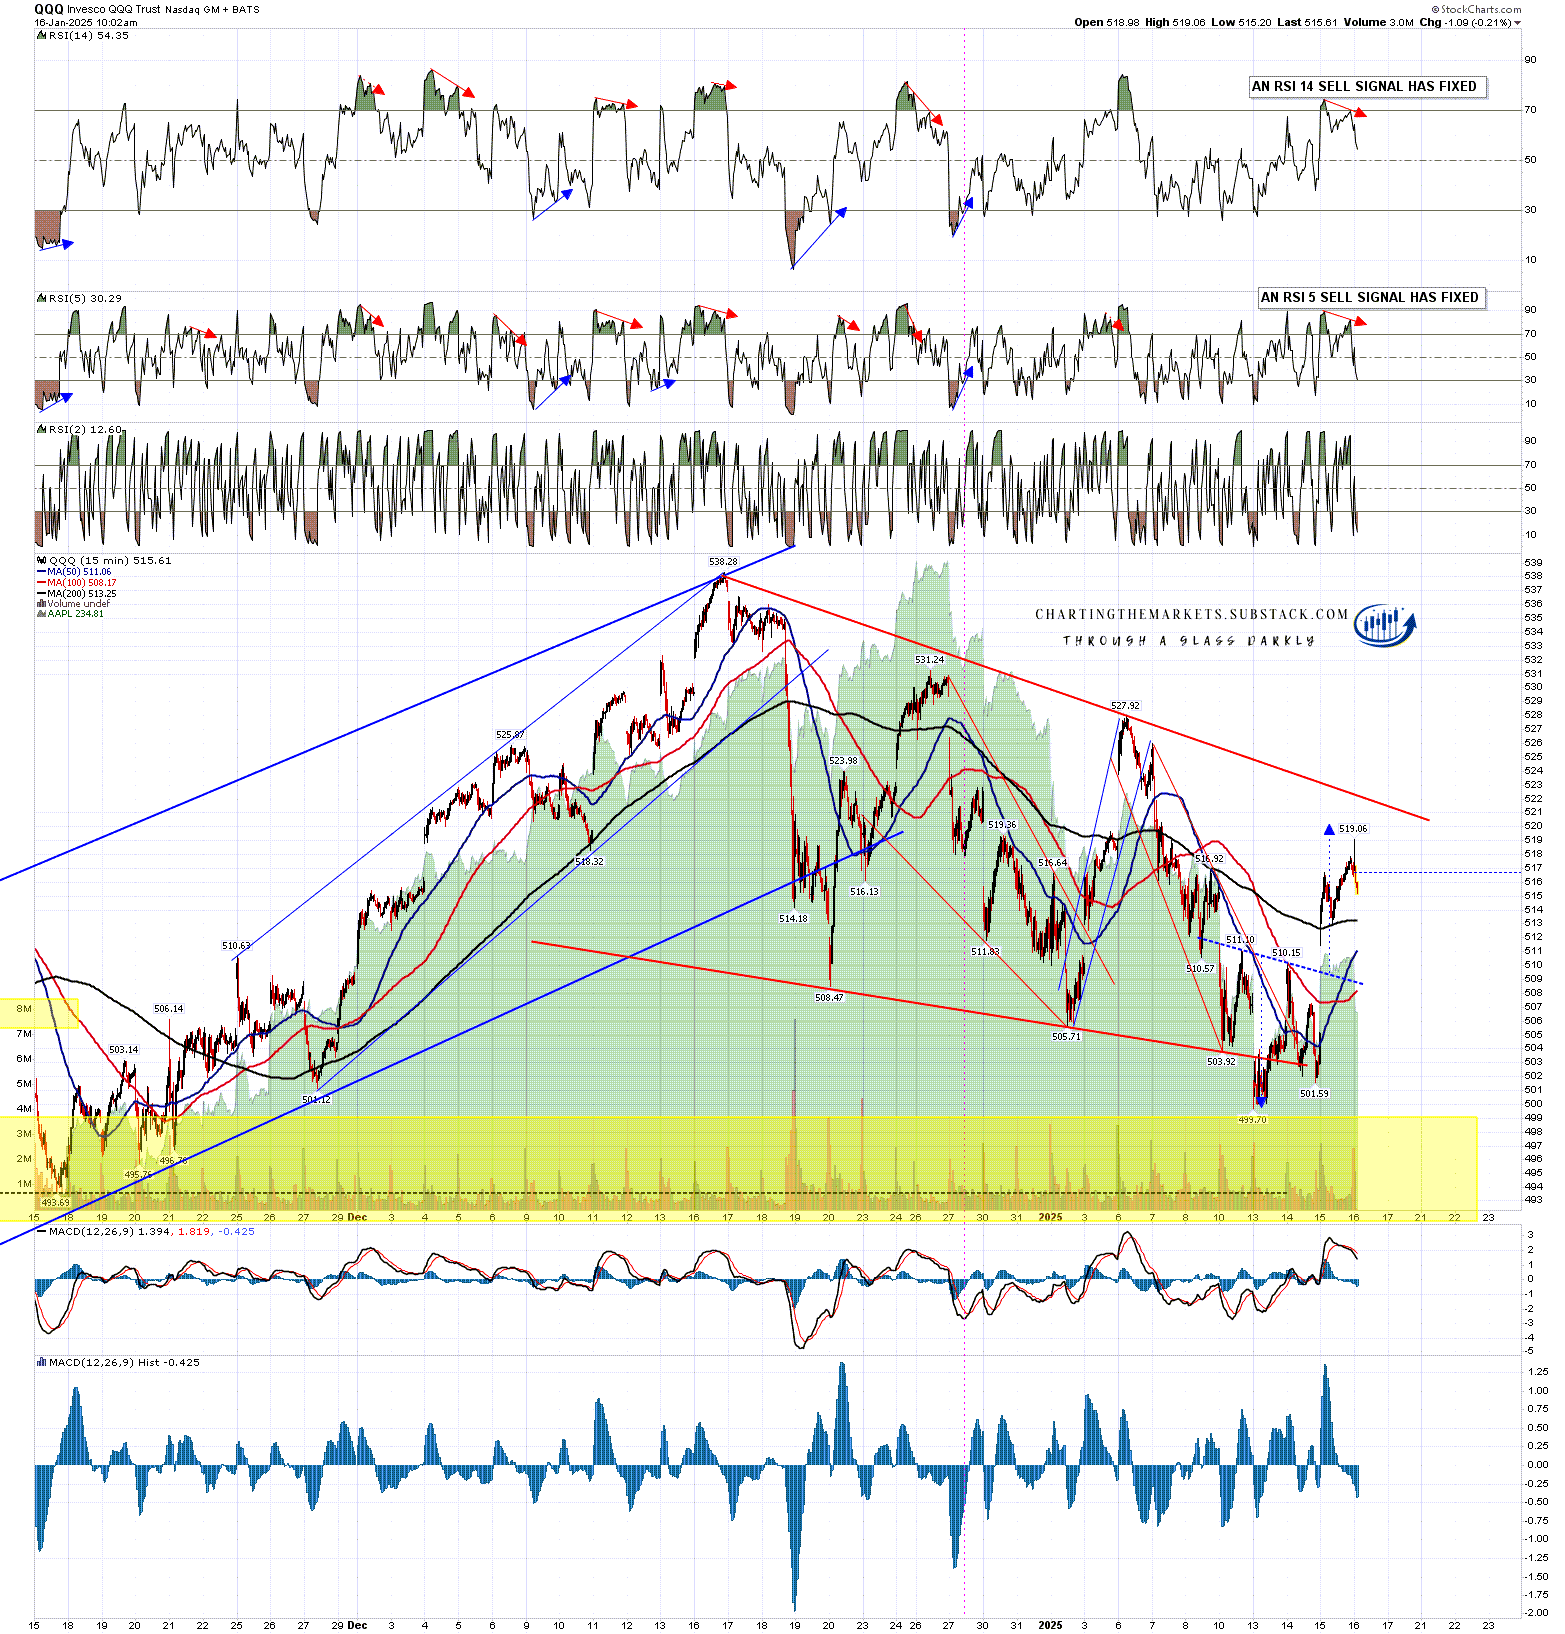
The good quality IHS that I was looking at yesterday on QQQ broke up and has come very close to target. Hourly RSI 14 and RSI 5 sell signals were brewing at the close yesterday and fixed this morning, with the RSI 5 sell signal having now also made target this morning. A retracement or consolidation was likely and is now in progress. So far this is almost identical to SPX.
On the bigger picture QQQ is testing the daily middle band, but the key resistance as I noted yesterday is the bull flag resistance now in the 522.25 area. A sustained break over that level fixes a target at a retest of the all time high.
QQQ 15min chart:
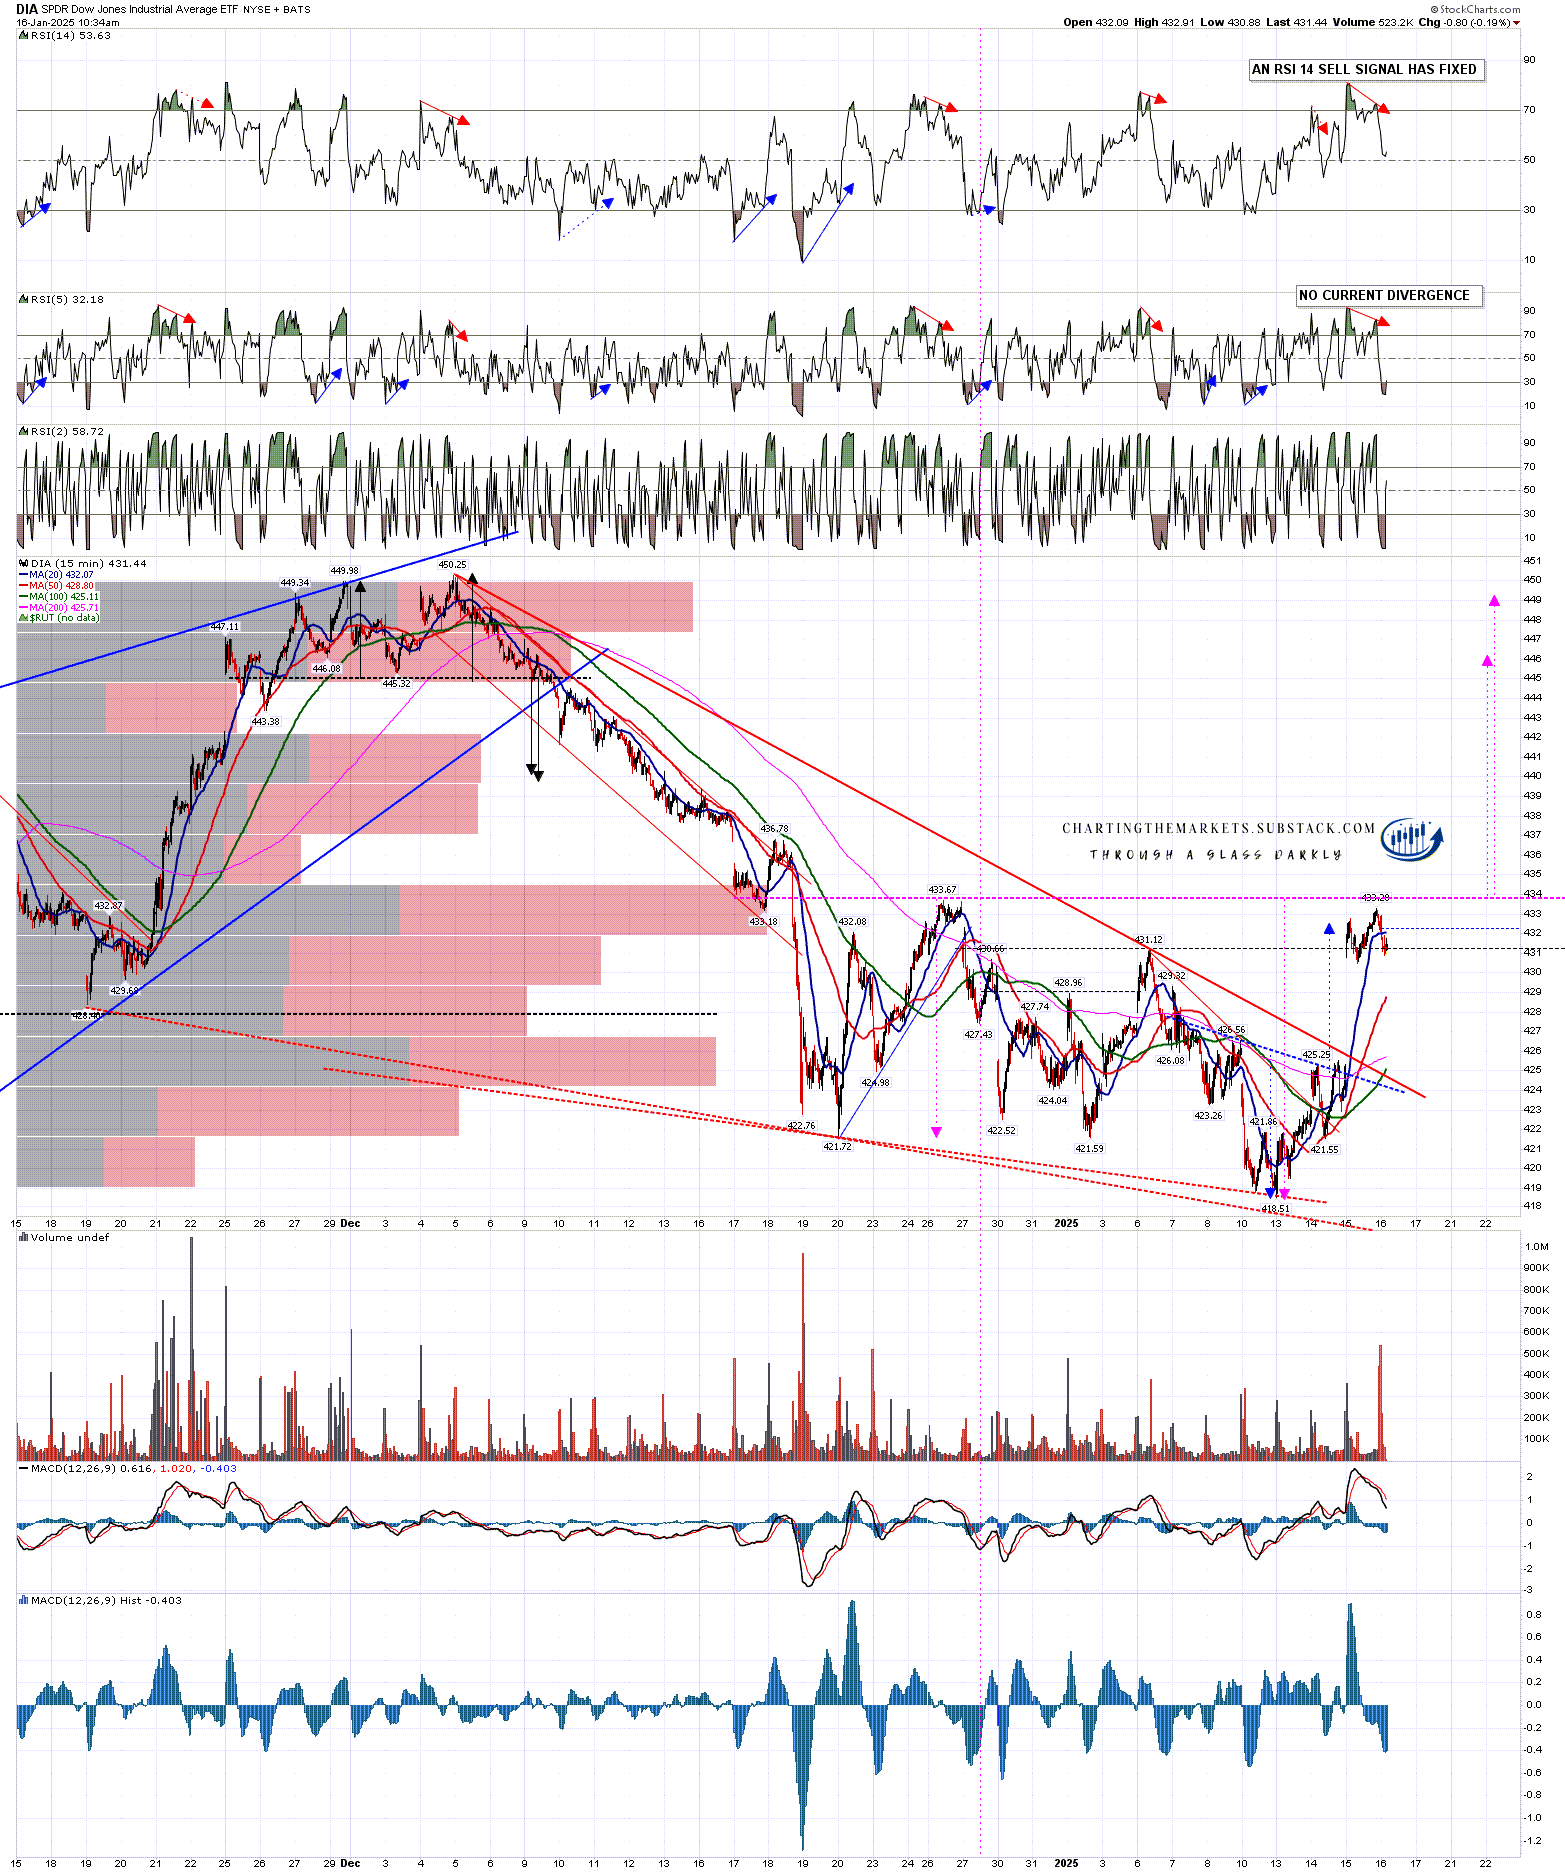
The moderate quality IHS that I was looking at yesterday on DIA broke up and has reached target. Hourly RSI 14 and RSI 5 sell signals were brewing at the close yesterday and fixed this morning, with the RSI 5 sell signal having now also made target this morning. A retracement or consolidation was likely and is now in progress. So far this is similar to SPX. I’m noting that these three indices are moving strongly in sync here as that strengthens the setup here.
On the bigger picture DIA broke back hard over the daily middle band and has come close to the key resistance level I was looking at at 433.67. This is possible asymmetric double bottom resistance and a sustained break above would look for a target range 446-9, putting DIA within striking distance of the all time high retest at 450.25.
DIA 15min chart:
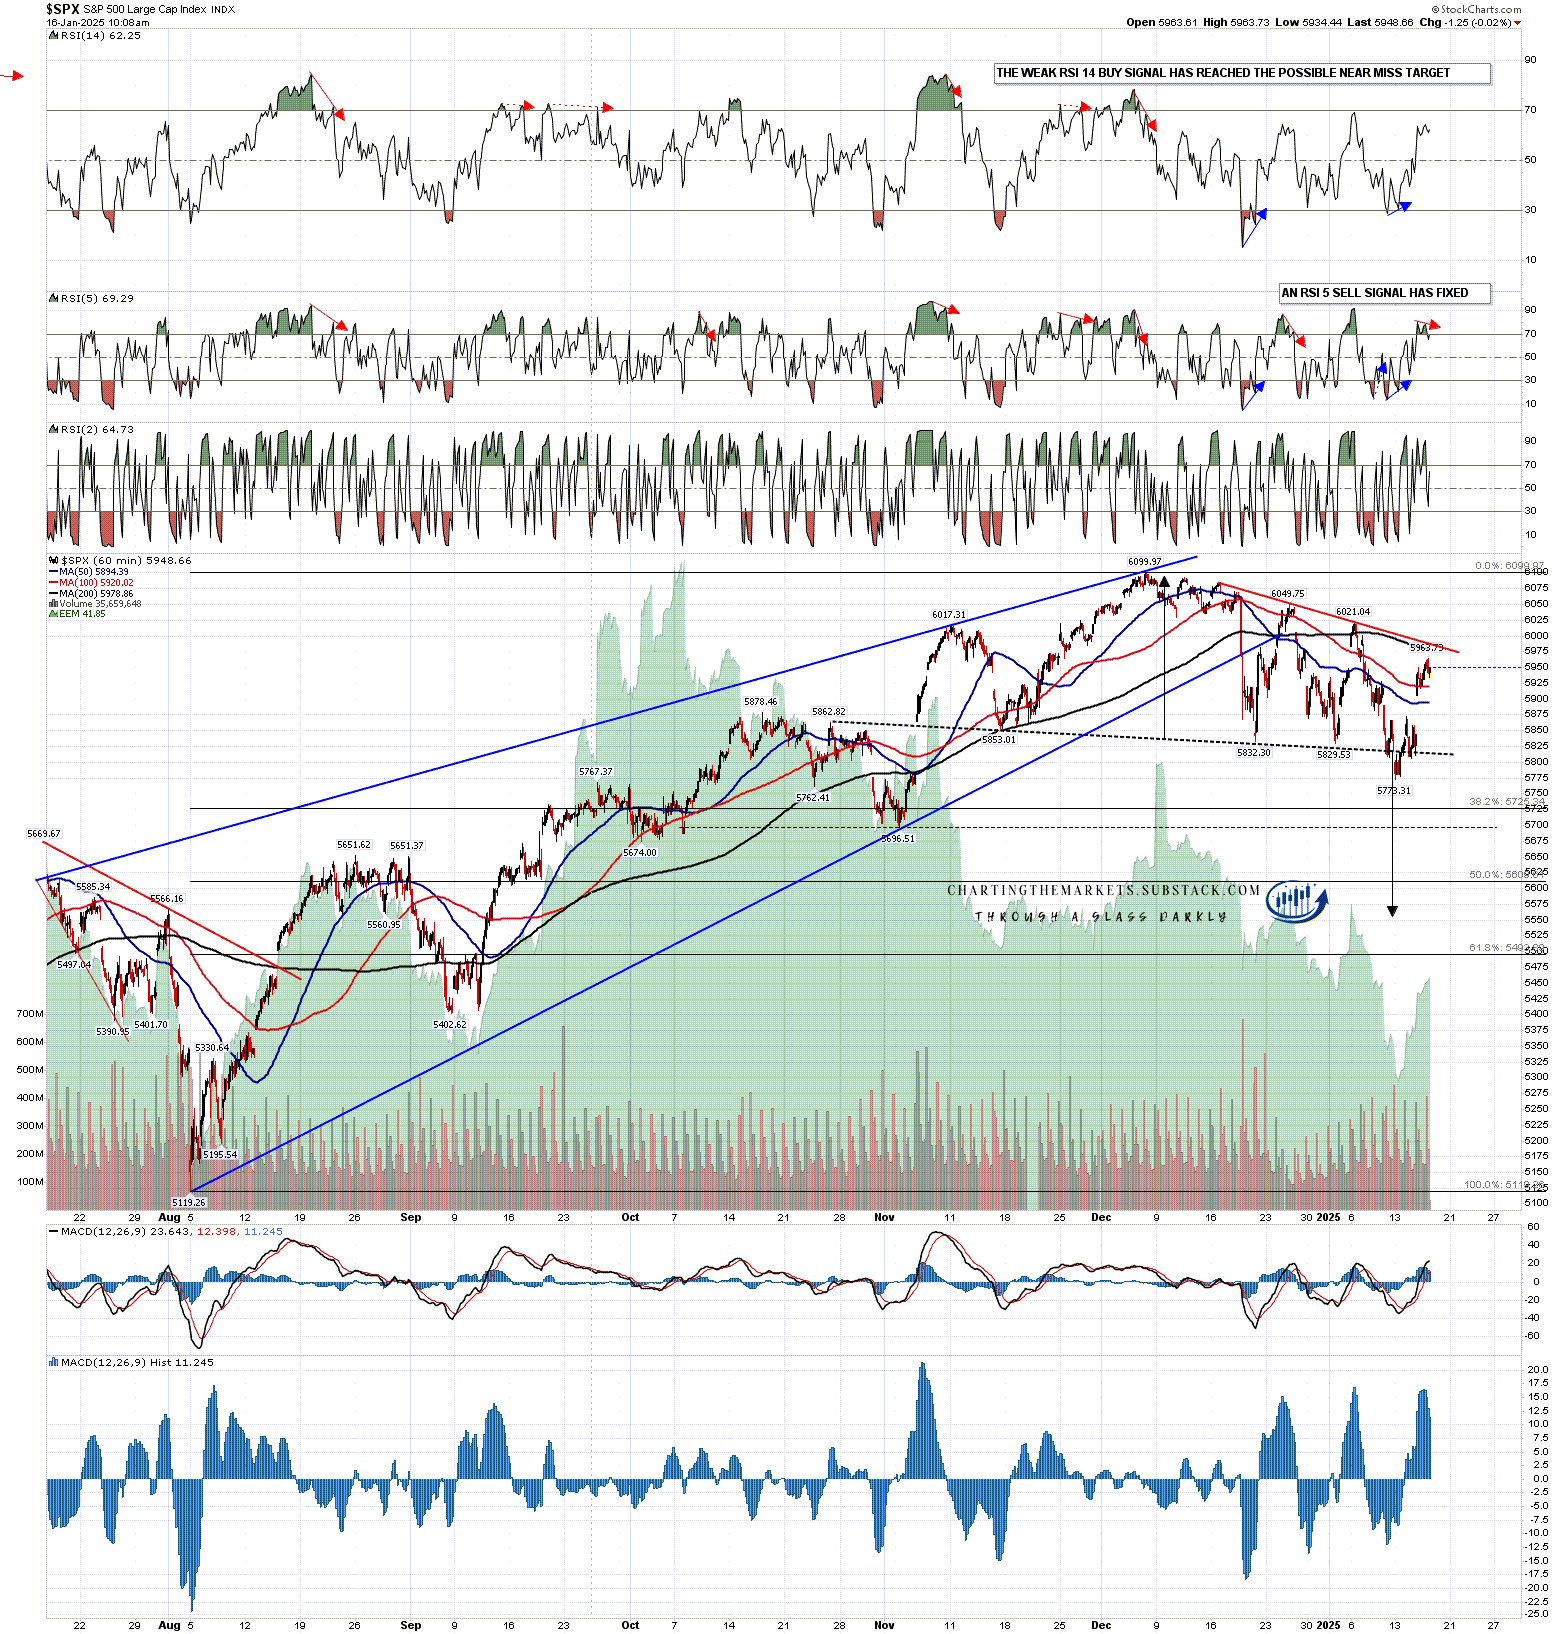
On the SPX hourly chart the weak RSI 14 buy signal I was looking at yesterday has made the possible near miss target and that could be it. An RSI 5 sell signal fixed this morning.
Beyond key resistance at the daily middle band the other, less important but still significant, levels on the SPX to be broken to clear the way to a retest of the all time high are possible bull flag resistance, currently in the 5990 area, and the H&S right shoulder high at 6049.75. Breaks above those each would individually fix a target at a retest of the all time high. They are less significant as if SPX can convert the daily middle band to support, then both of the others will likely break in turn after that.
SPX 60min chart:
The resistance level I have been watching with most interest in the SPX daily middle band. SPX failed there on the last two rallies and it is this level that really needs to be broken and converted to support to open the all time high retest.
If you look at the last two rallies that failed at the daily middle band you can see that the first of those, in late December to 6049.75, broke back above the middle band, retraced to backtest and close on it the next day, then failed hard. That’s normal as a break over (or under) the middle band that fails will generally do so the next day or (a bit less often) the day after that. The second rally in early January to 6021.04 only broke over the daily middle band intraday and failed to close above either day. The current instance is more like the first rally. A fail at the daily middle band like this will usually open a move back to the daily lower band, currently at 5796 and not a good place to return to for bulls here.
The challenge for the bulls at this obvious potential point of failure is to keep this retracement relatively modest and in the form of a bullish consolidation. The 15min RSI 14 sell signals would ideally reached their target by early afternoon and SPX would ideally close again today above the daily middle band, currently at 5927.27 and still declining, and then hold it again tomorrow. If we see that then the odds of a retest of the all time high are good in my view.
SPX daily chart:
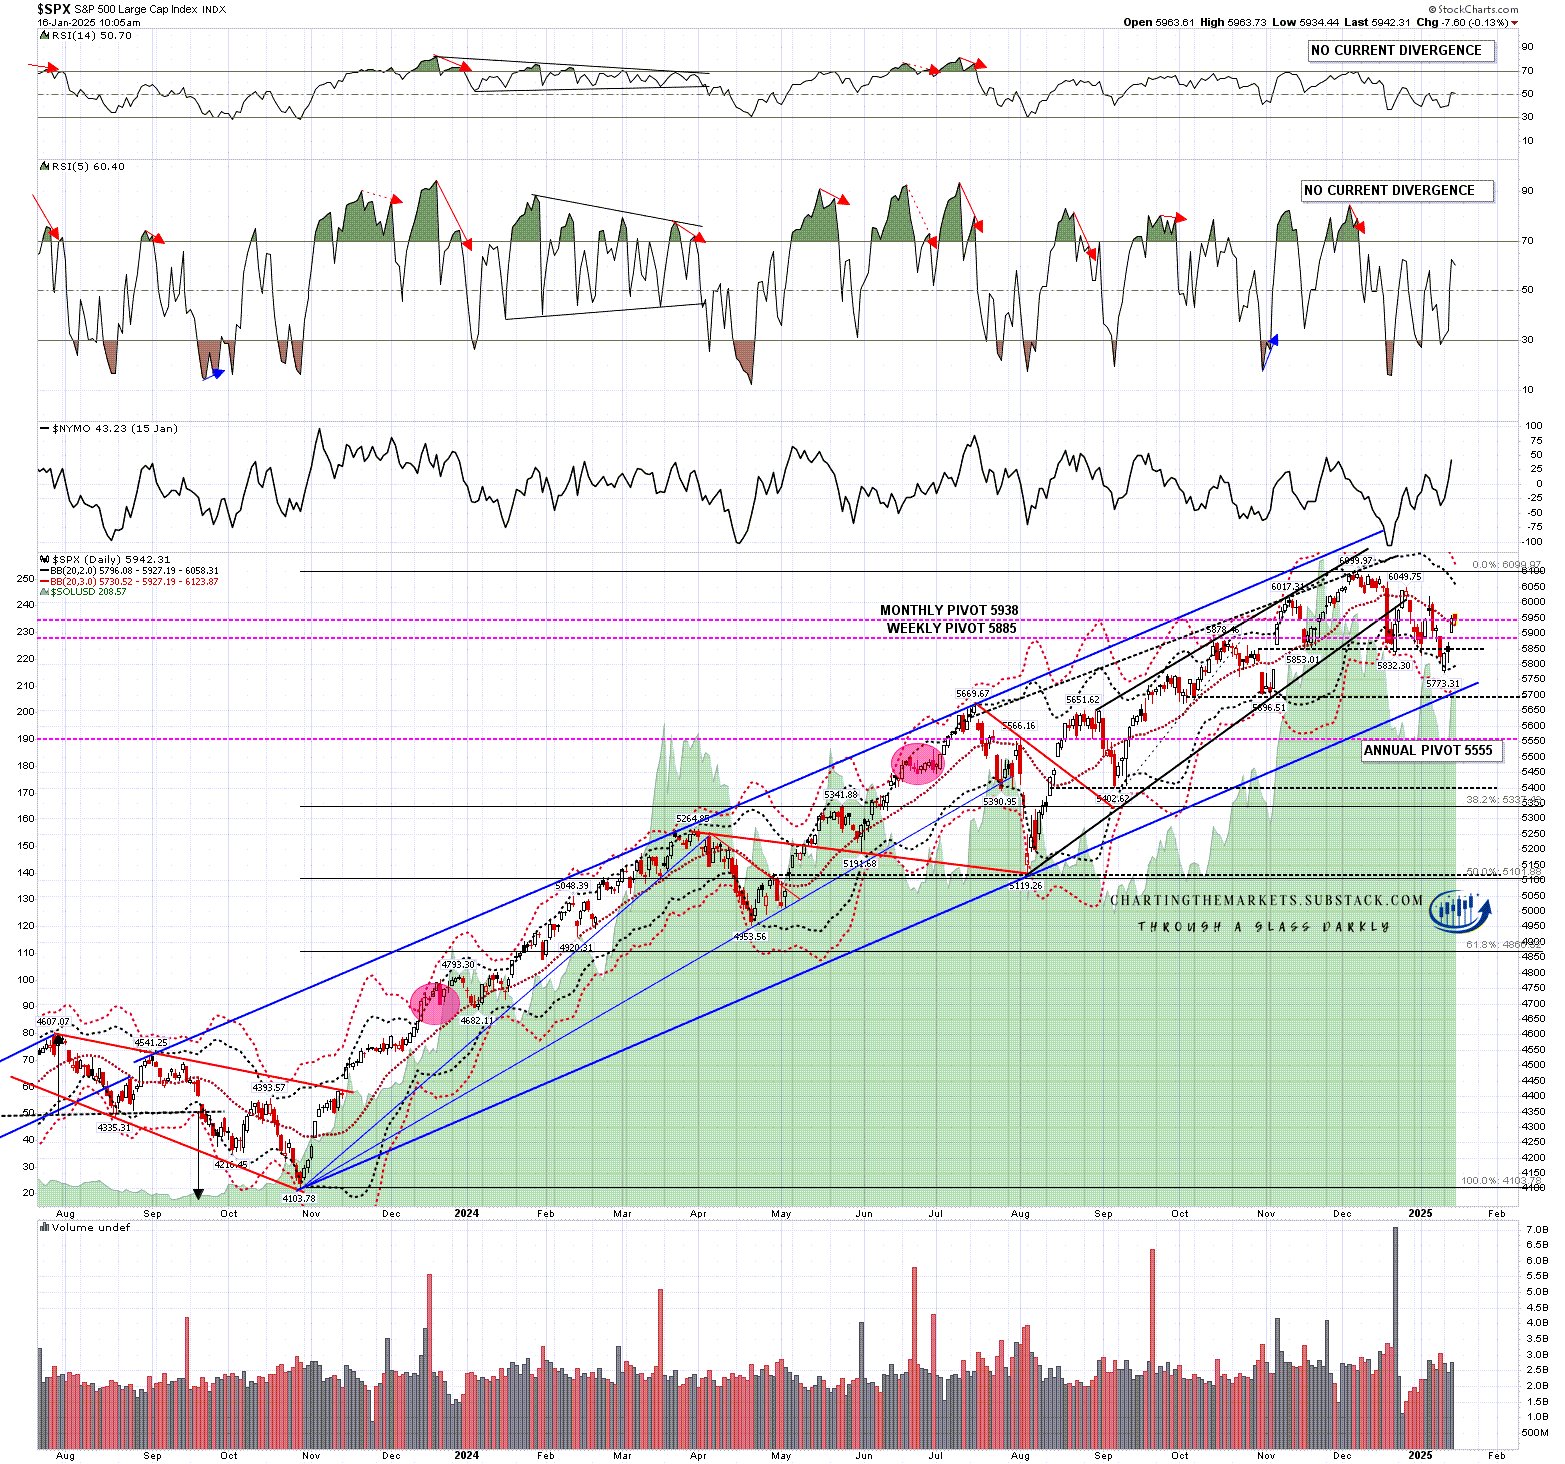
I’m leaning towards a weak first half of 2025 and new all time highs later in the year, very possibly as a topping process for a much more significant high. Whichever way this breaks would be fine for that scenario. One way or another I think we’ll be seeing lower soon and I’m not expecting this to be a good year for US equities. The last two years have been banner years for US equities. A third straight year of these kinds of gains looks like a big stretch.
If you like my analysis and would like to see more, please take a free subscription at my chartingthemarkets substack, where I publish these posts first.
I also do a premarket video every day on equity indices, bonds, currencies, energies, precious commodities and other commodities at 8.45am EST. If you’d like to see those I post the links every morning on my twitter, and the videos are posted shortly afterwards on my Youtube channel.
No comments:
Post a Comment