
In my last post on Wednesday 22nd Jan, I was looking at the various targets for the move up from the January lows on the US equity indices, the all time high retest on SPX, which had just be reached, and the all time high retests on QQQ and DIA, which are still outstanding. I was also noting that a retracement to set up less vertiginously steep rising support trendlines on all three of these was overdue.
There was some weakness on Friday that fixed an hourly RSI 14 sell signal on SPX and that followed through into a big gap down on Monday morning. What I was saying in my premarket video yesterday morning was that little serious technical damage had been done and that the obvious next move was a resumption of the uptrend. I said much the same this morning but with expanded comments on the decline being mostly tech, and considering the larger implications of the DeepSeek news that delivered the big gap down on Monday.
So what are those implications? The core of the matter seems not to be that DeepSeek offers anything more capable than current AI, but that the $5.6m cost of the computing power for DeepSeek is a tiny fraction of what the current US tech leaders have spent developing their equivalent AI models.
There are some questions, notably that as DeepSeek is very much a chinese company, it is hard to verify that the stated costs and process are correct, but if they are correct then DeepSeek has delivered a massive improvement in the costs of developing AI, even if that AI adds nothing particularly to the current models. That of course calls into question hundreds of billions of planned spending developing newer and better AI models, and that is why Nvidia lost a record-breaking $588.8 billion in market capitalisation yesterday.
Given that half of US equity market gains last year are attributed to AI, that raises a big question over whether Monday morning’s retracement may follow through into a much larger retracement in the near future, and I think that’s very possible. That also fits with the lean I have been stating over the last few weeks that 2025 is likely to be a tougher year for equities than 2024 or 2023, and that I was expecting to see weakness during the first half of 2025.
In the short term though what I have been saying in my premarket videos this week remains true, as little real technical damage has so far been done, and there are still open upside targets that I am expecting to see hit. Unless we see some real technical damage done then the obvious next move is a resumption of the uptrend from the January lows.
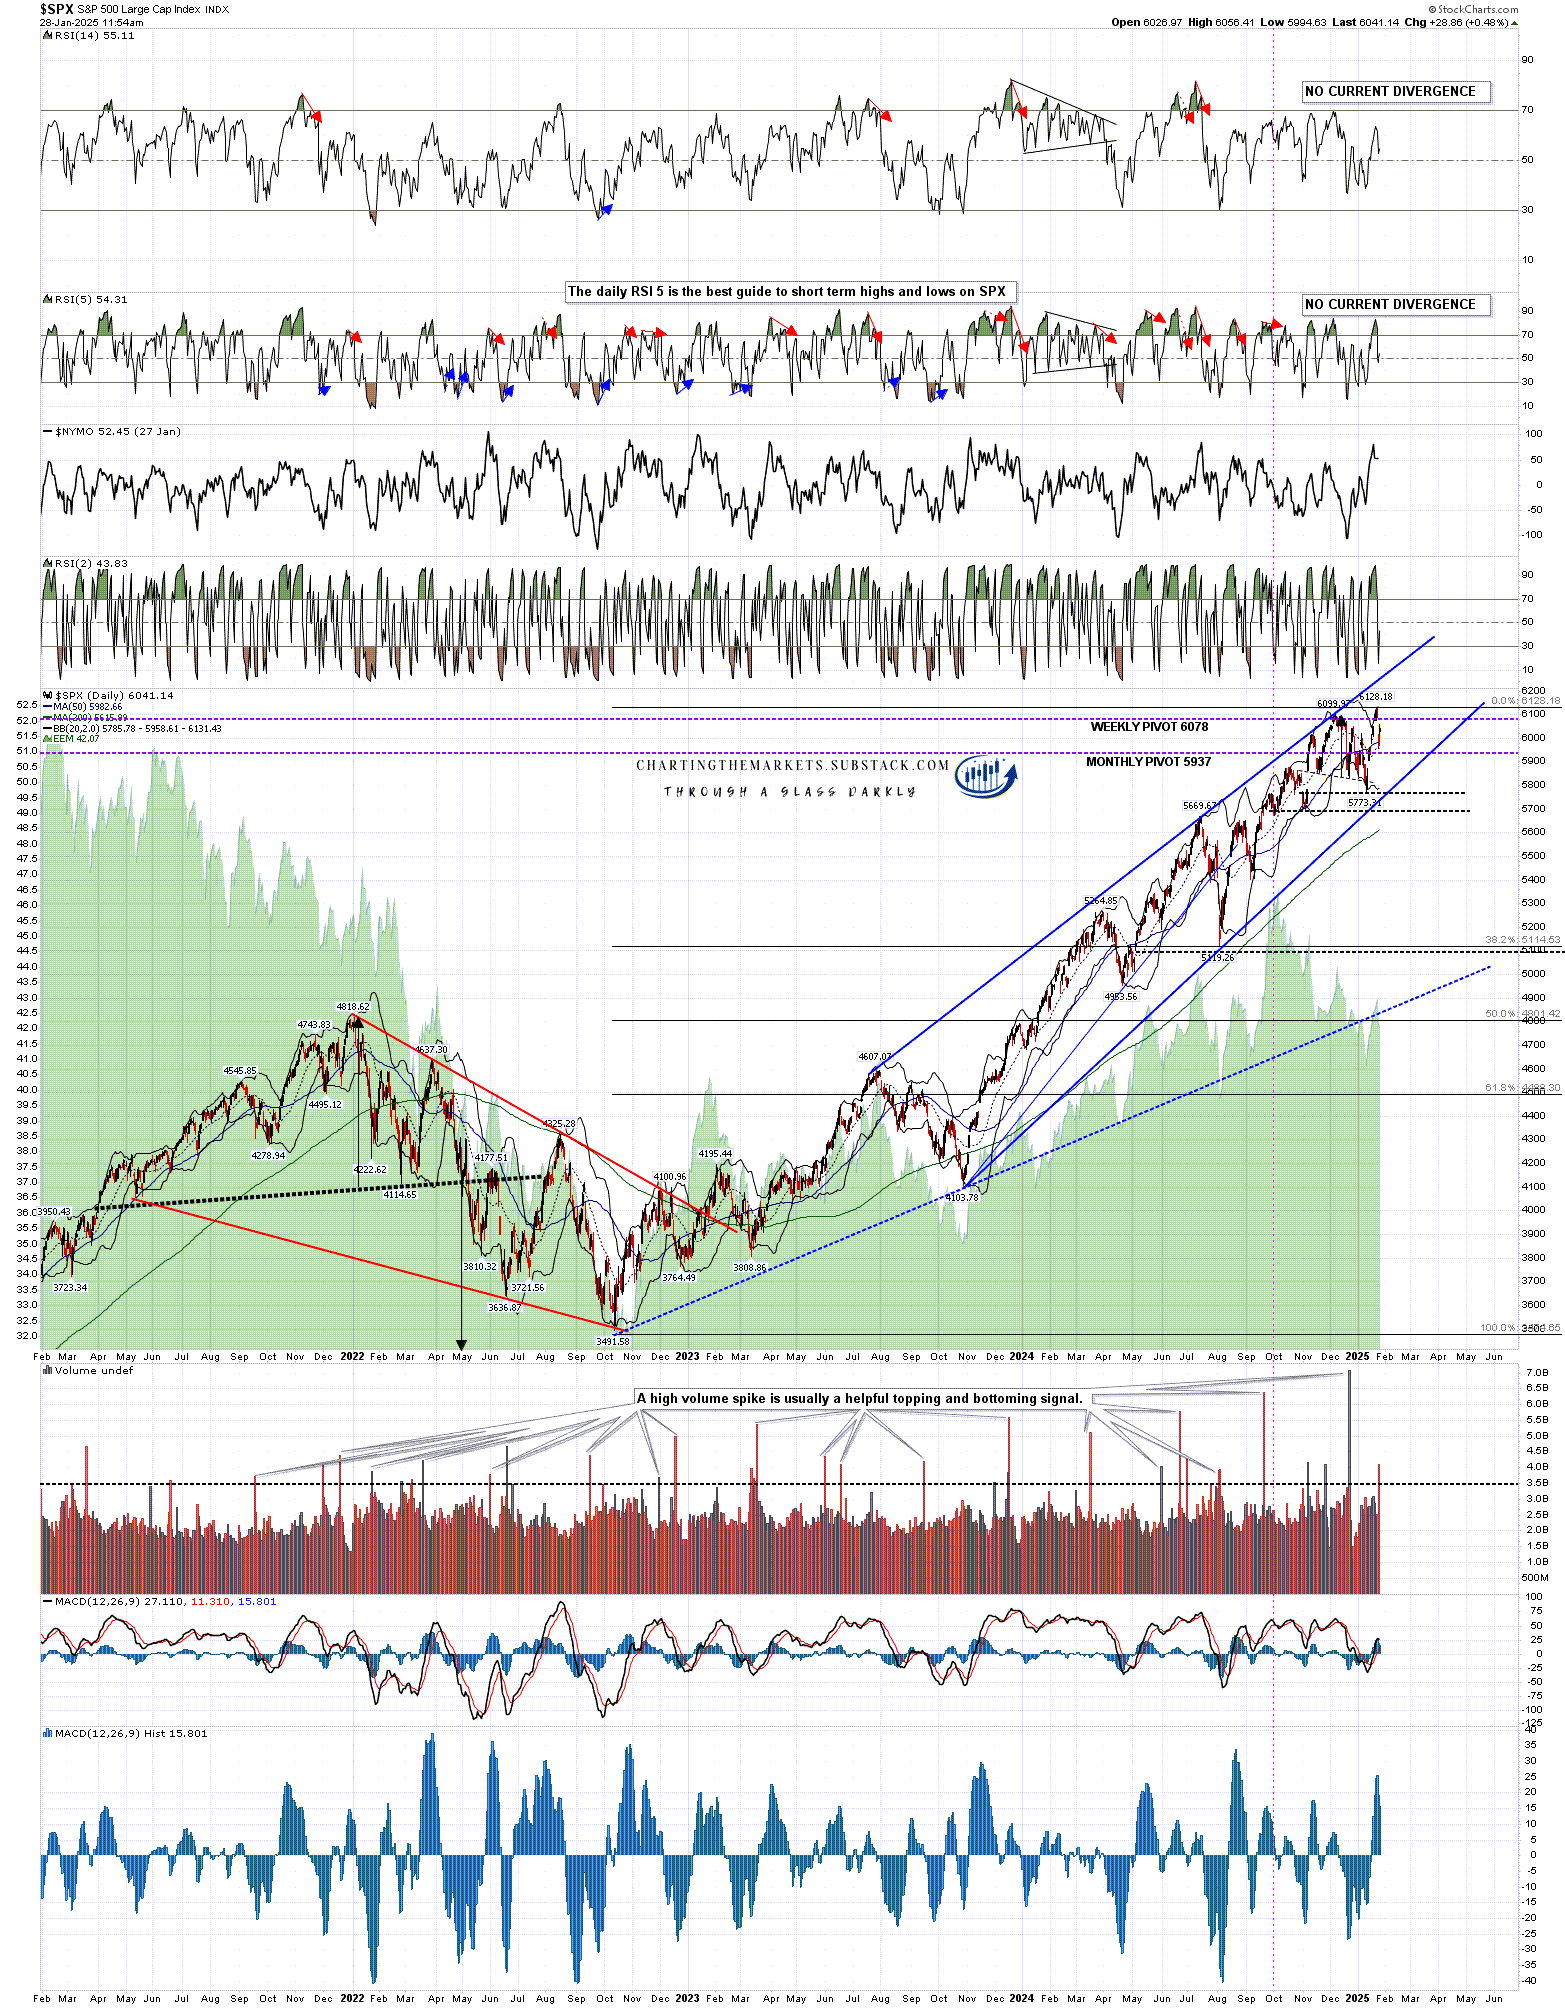
Looking at the SPX daily chart you can see that the retracement yesterday was a solid backtest of the daily middle band. So far there is nothing inherently bearish about a backtest of main uptrend support. If that support should break on a daily close basis and then follow through to the downside, that would change.
SPX daily chart:
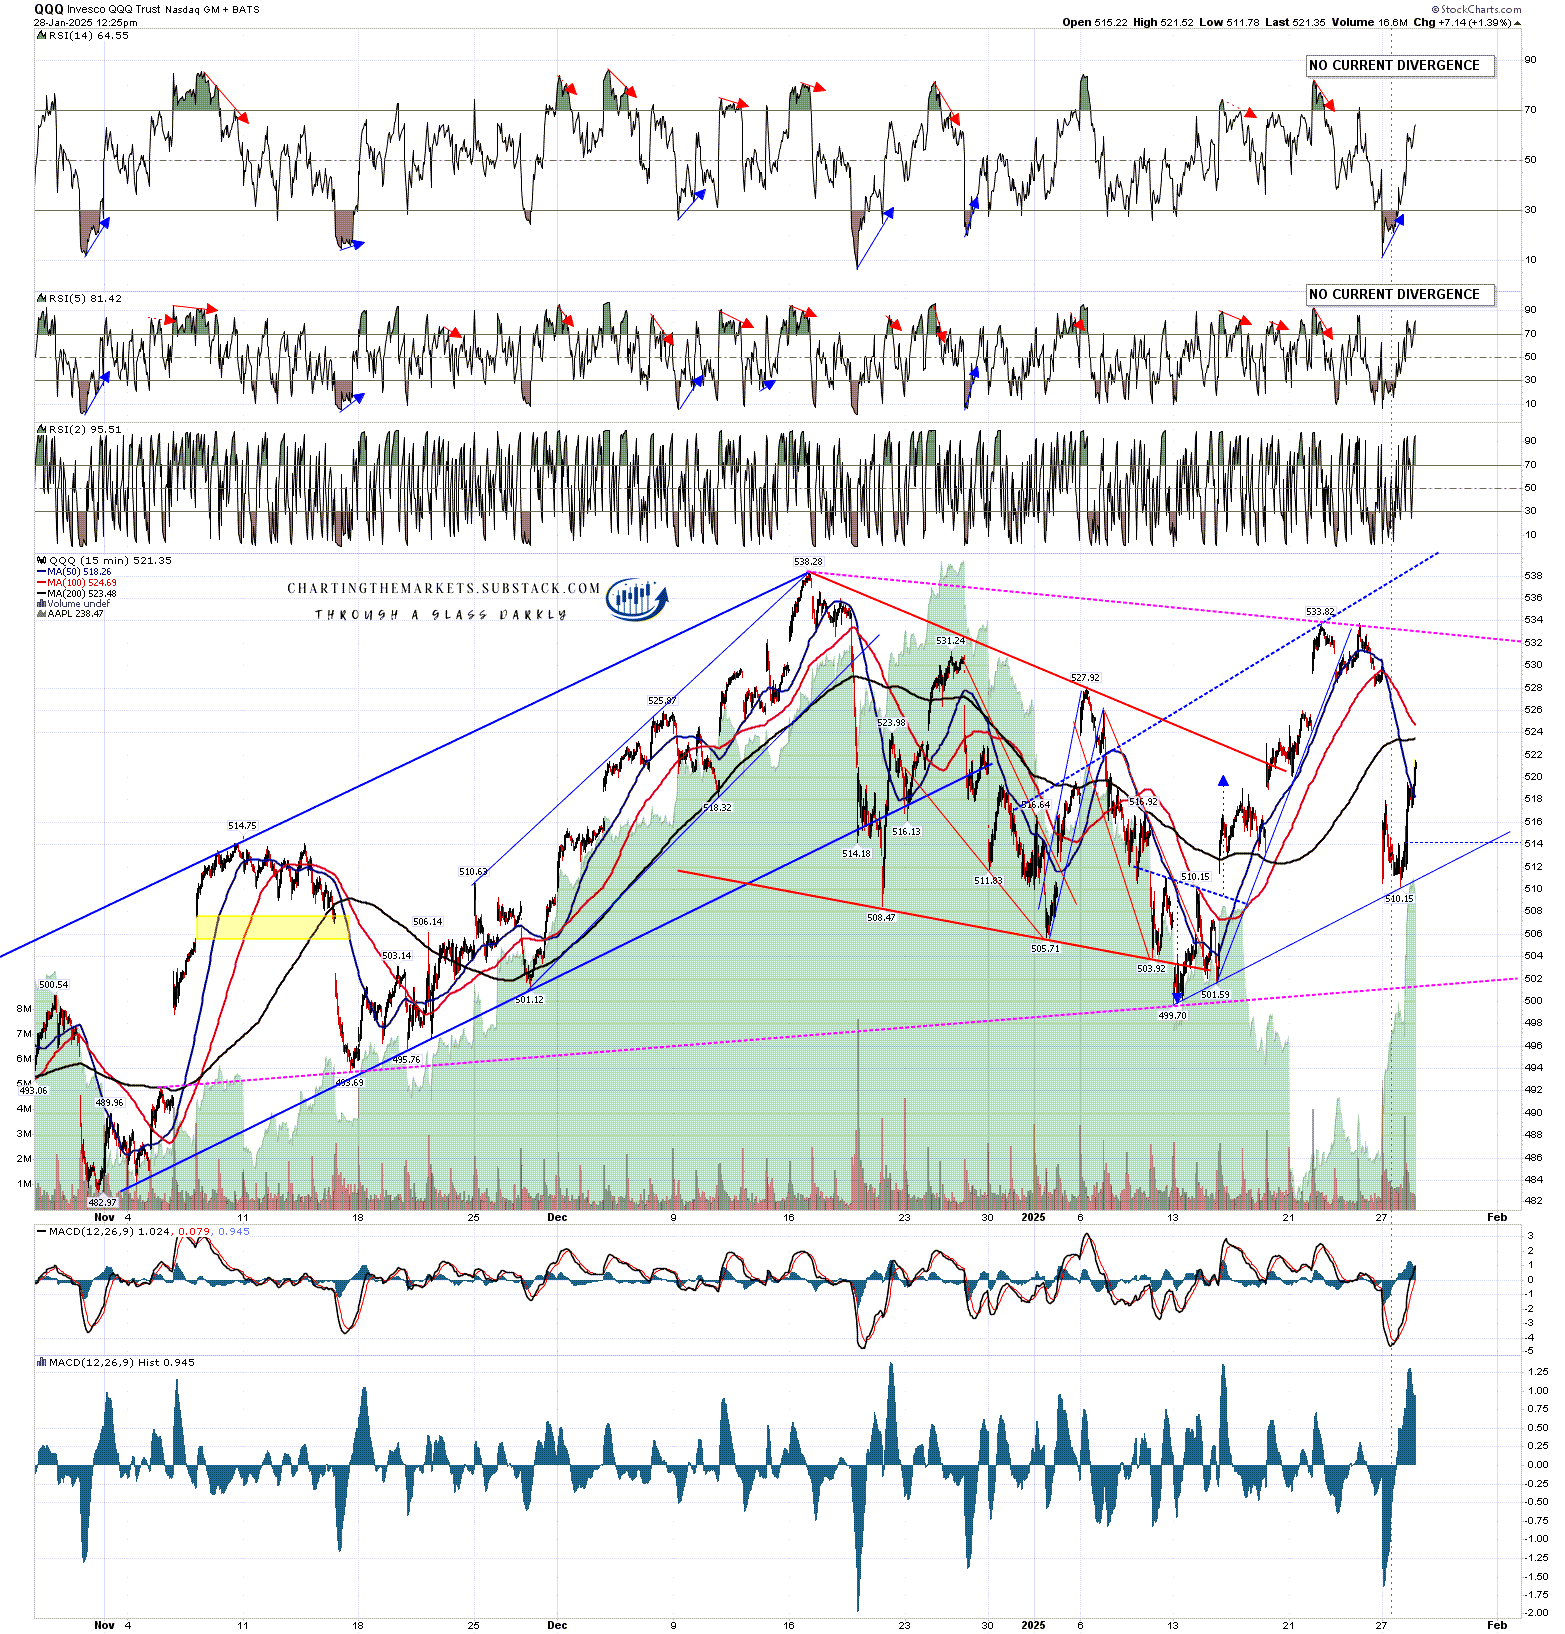
On QQQ, as you would expect, the retracement was sharpest, and QQQ broke back below the daily middle band. If SPX breaks that support too I would start taking a serious continuation downwards a lot more seriously.
There remains however a very nice looking bull flag that has broken up with a target at a retest of the all time high. That’s not the only possibility as I do have an option where the flag could expand into a triangle on the chart below, but that triangle support isn’t a lot lower.
QQQ 15min chart:
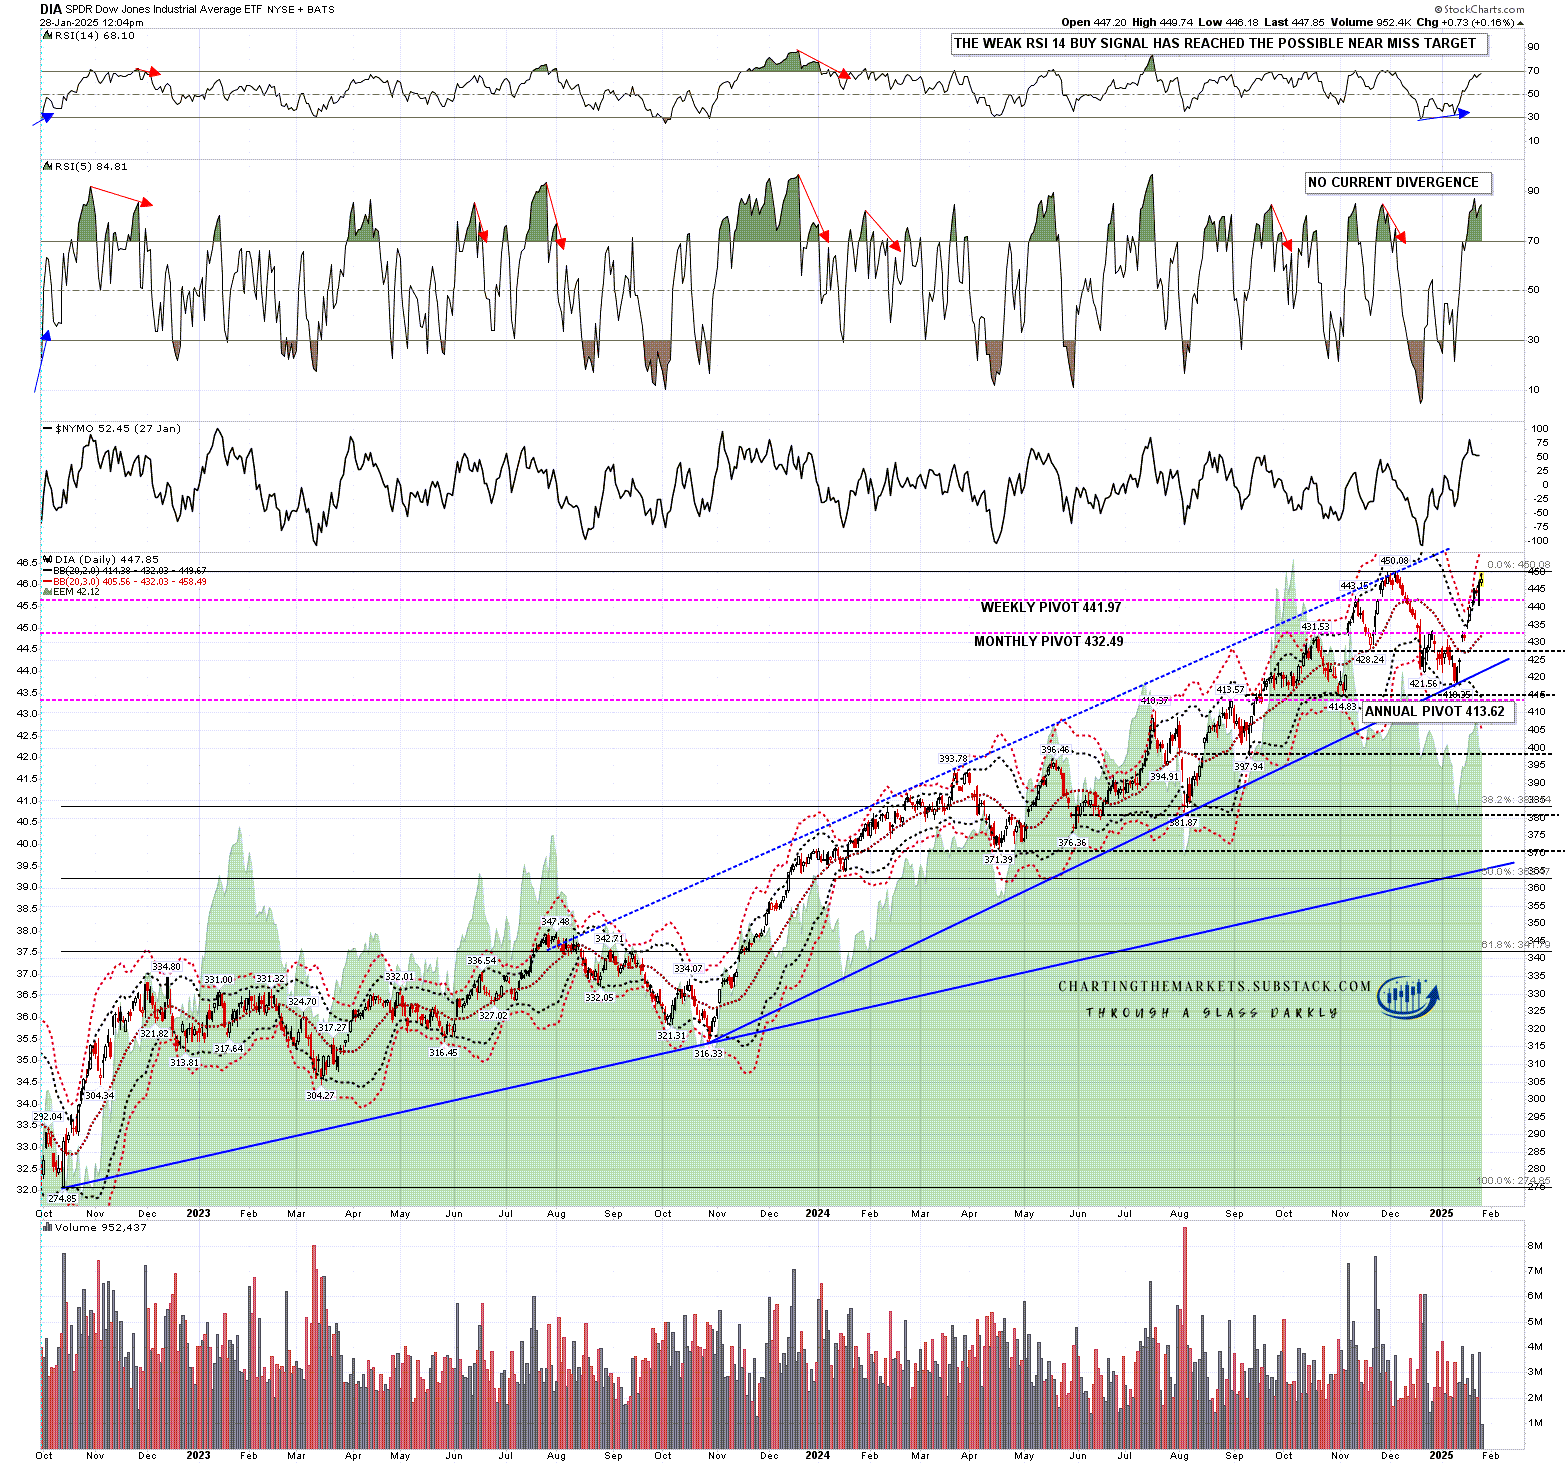
There is one big thing that has changed since my premarket video today and that is on DIA, where there was a target at a retest of the all time high that was still some distance away, and it is now close. The all time high is at 450.08 and the high so far today is at 449.74. That could be close enough for government work but I’m expecting to see a new all time high soon. At that point I will only have one big upside target outstanding, and that will be on QQQ.
I would also note that there is now a weak daily RSI 5 sell signal brewing on DIA as the existing weak RSI 14 buy signal is reaching target.
DIA daily chart:
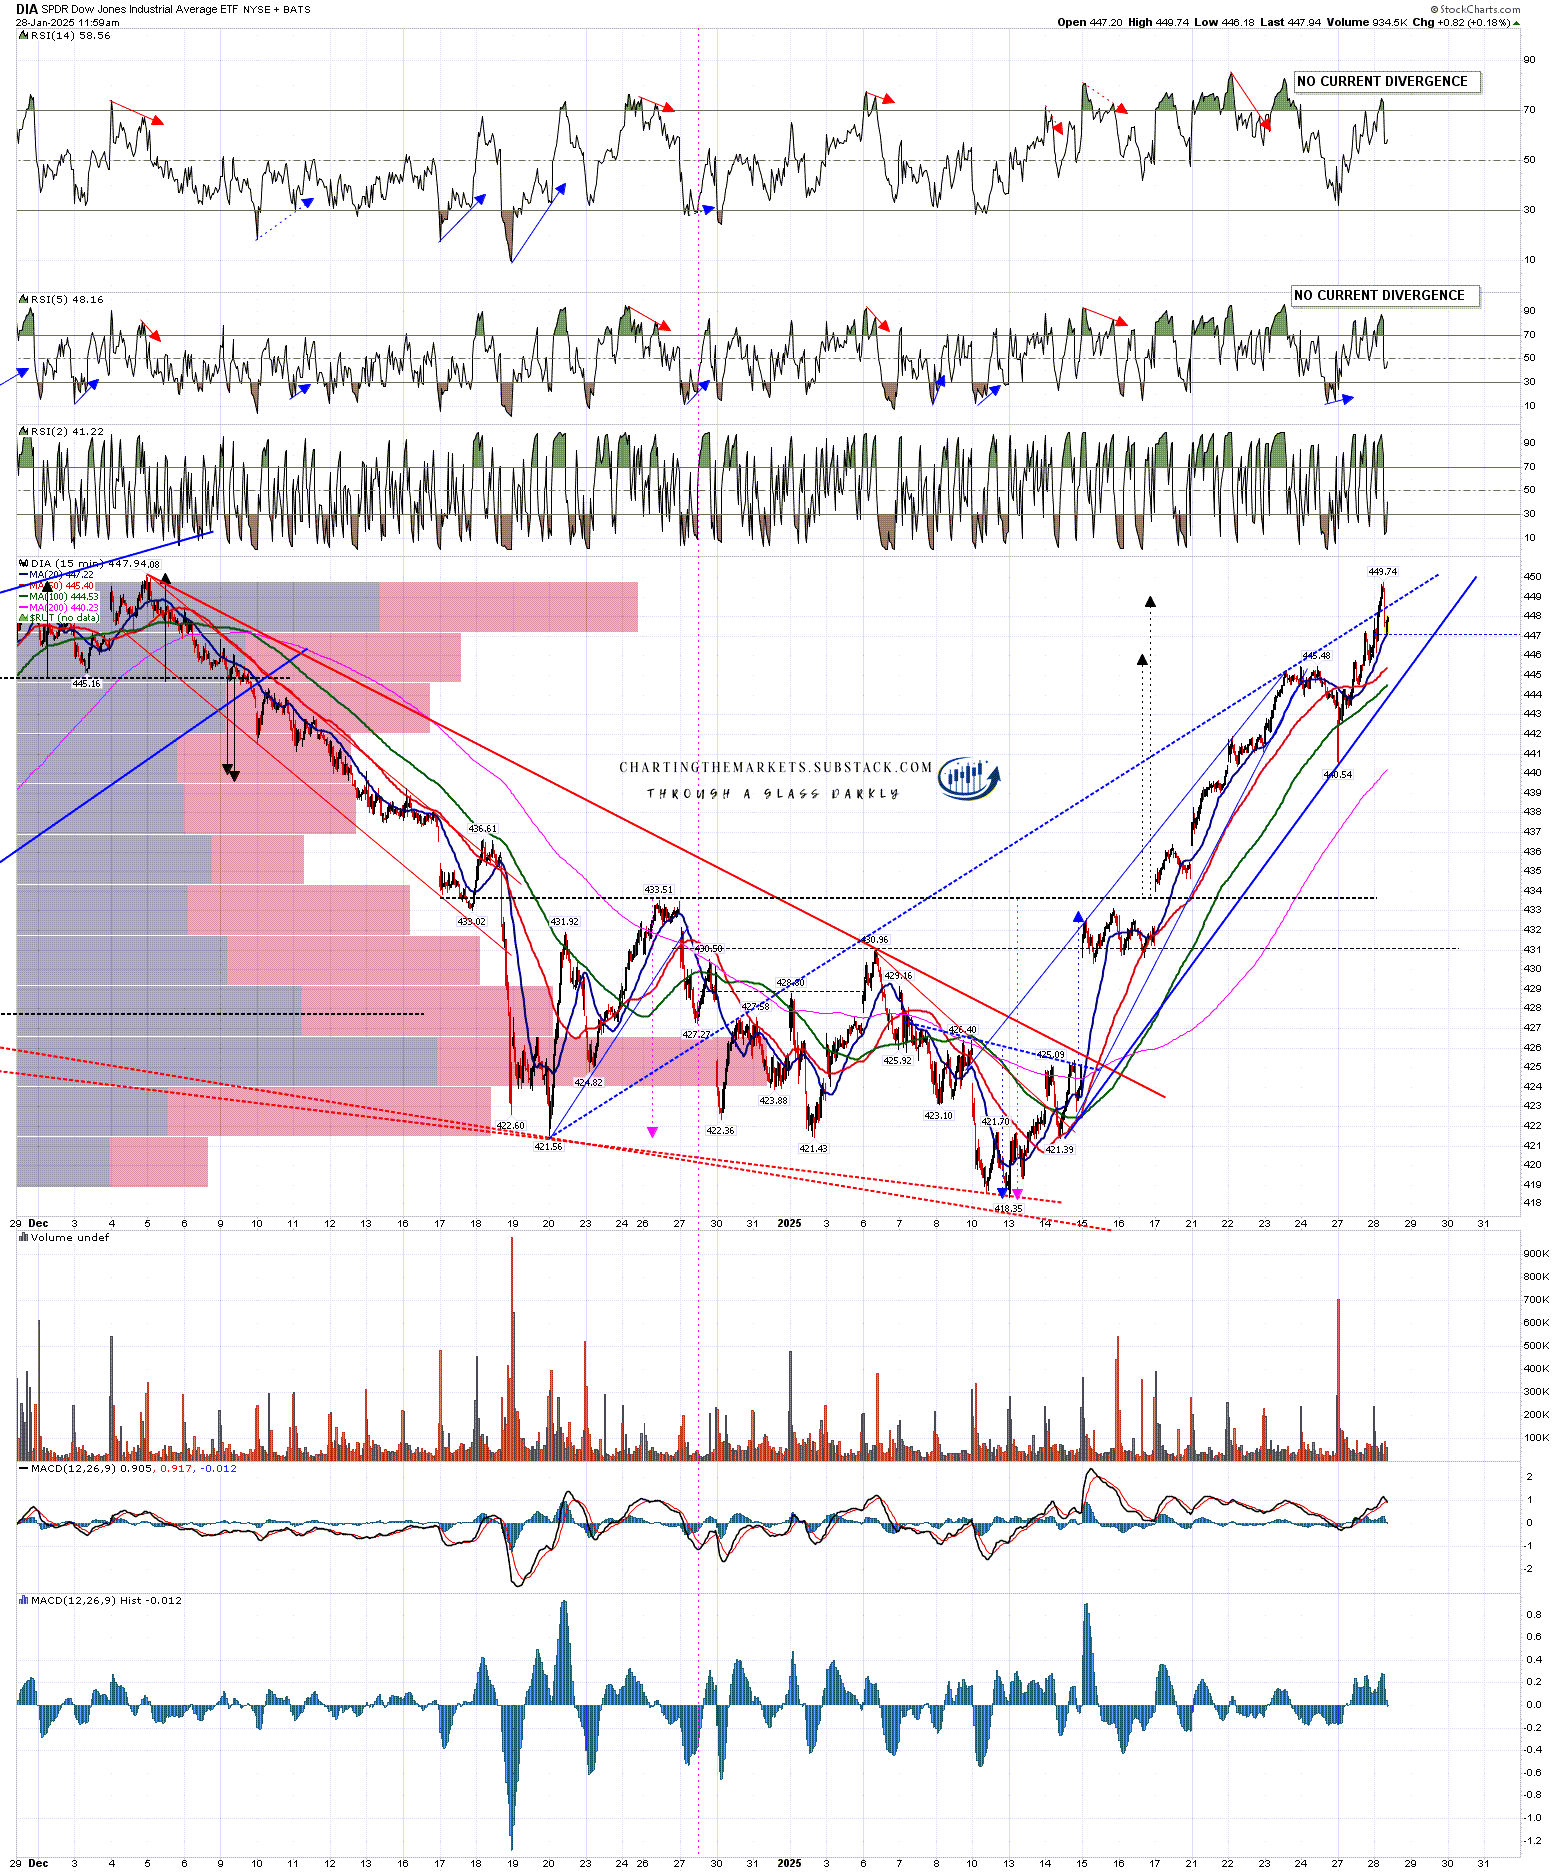
On the DIA hourly chart a possible RSI 14 sell signal has also started brewing and on the 15min chart below you can see that there is a decent quality rising wedge option from the January lows that may have been overthrowing the highs today. With the double bottom target from the low having made the full target today, and the bull flag target at the retest of the all time high almost hit today, DIA no longer has any meaningful further upside targets. That doesn’t mean that it is topping out, but it is no longer supporting an overall bull case either.
DIA 15min chart:
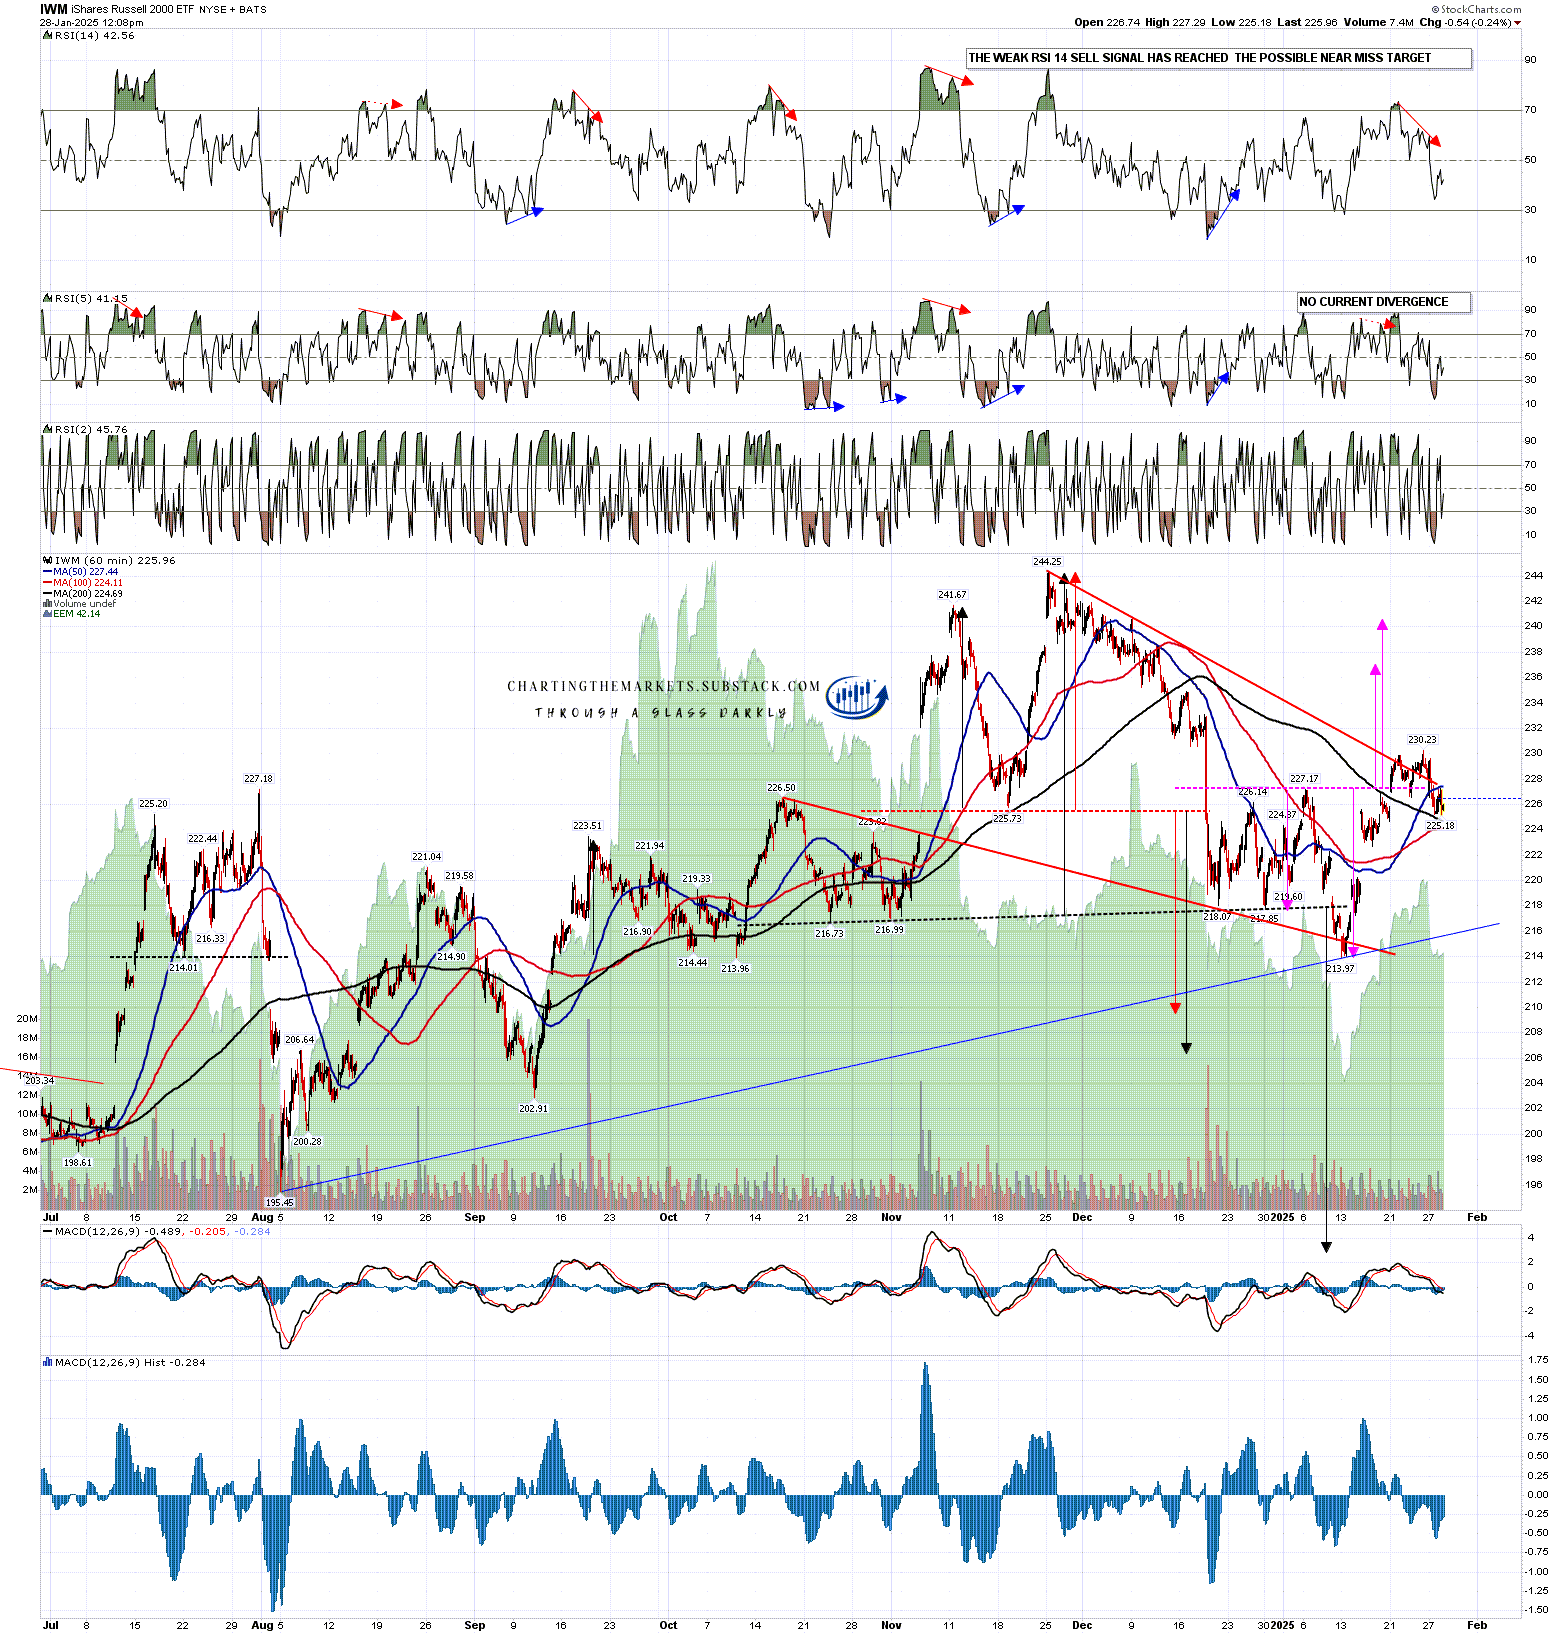
IWM has been a tougher call from the January lows, with the rally from there having been so weak that the double top target in the 207-9 area is still looking very credible.
There is a decent bull flag setup on IWM too though, which is trying to break up, but until it breaks up with more force this could be a bearish overthrow before the bull flag breaks down, as they do about 30% of the time.
IWM 60min chart:
The setup here is less bullish than the one I was looking at before the open this morning, but until SPX breaks below the daily middle band I’m still leaning towards retests of the all time highs on SPX and probably QQQ. DeepSeek is casting a potentially very large shadow over Tech however and even if we do see those retests, the odds of a much larger retracement after that have increased considerably.
I’m still leaning towards a weak first half of 2025 and new all time highs later in the year, very possibly as a topping process for a much more significant high. One way or another I think we’ll be seeing lower soon and I’m not expecting this to be a good year for US equities. The last two years have been banner years for US equities. A third straight year of these kinds of gains looks like a big stretch. I could of course however be mistaken. :-)
If you like my analysis and would like to see more, please take a free subscription at my chartingthemarkets substack, where I publish these posts first. I also do a premarket video every day on equity indices, bonds, currencies, energies, precious commodities and other commodities at 8.45am EST. If you’d like to see those I post the links every morning on my twitter, and the videos are posted shortly afterwards on my Youtube channel.
No comments:
Post a Comment