
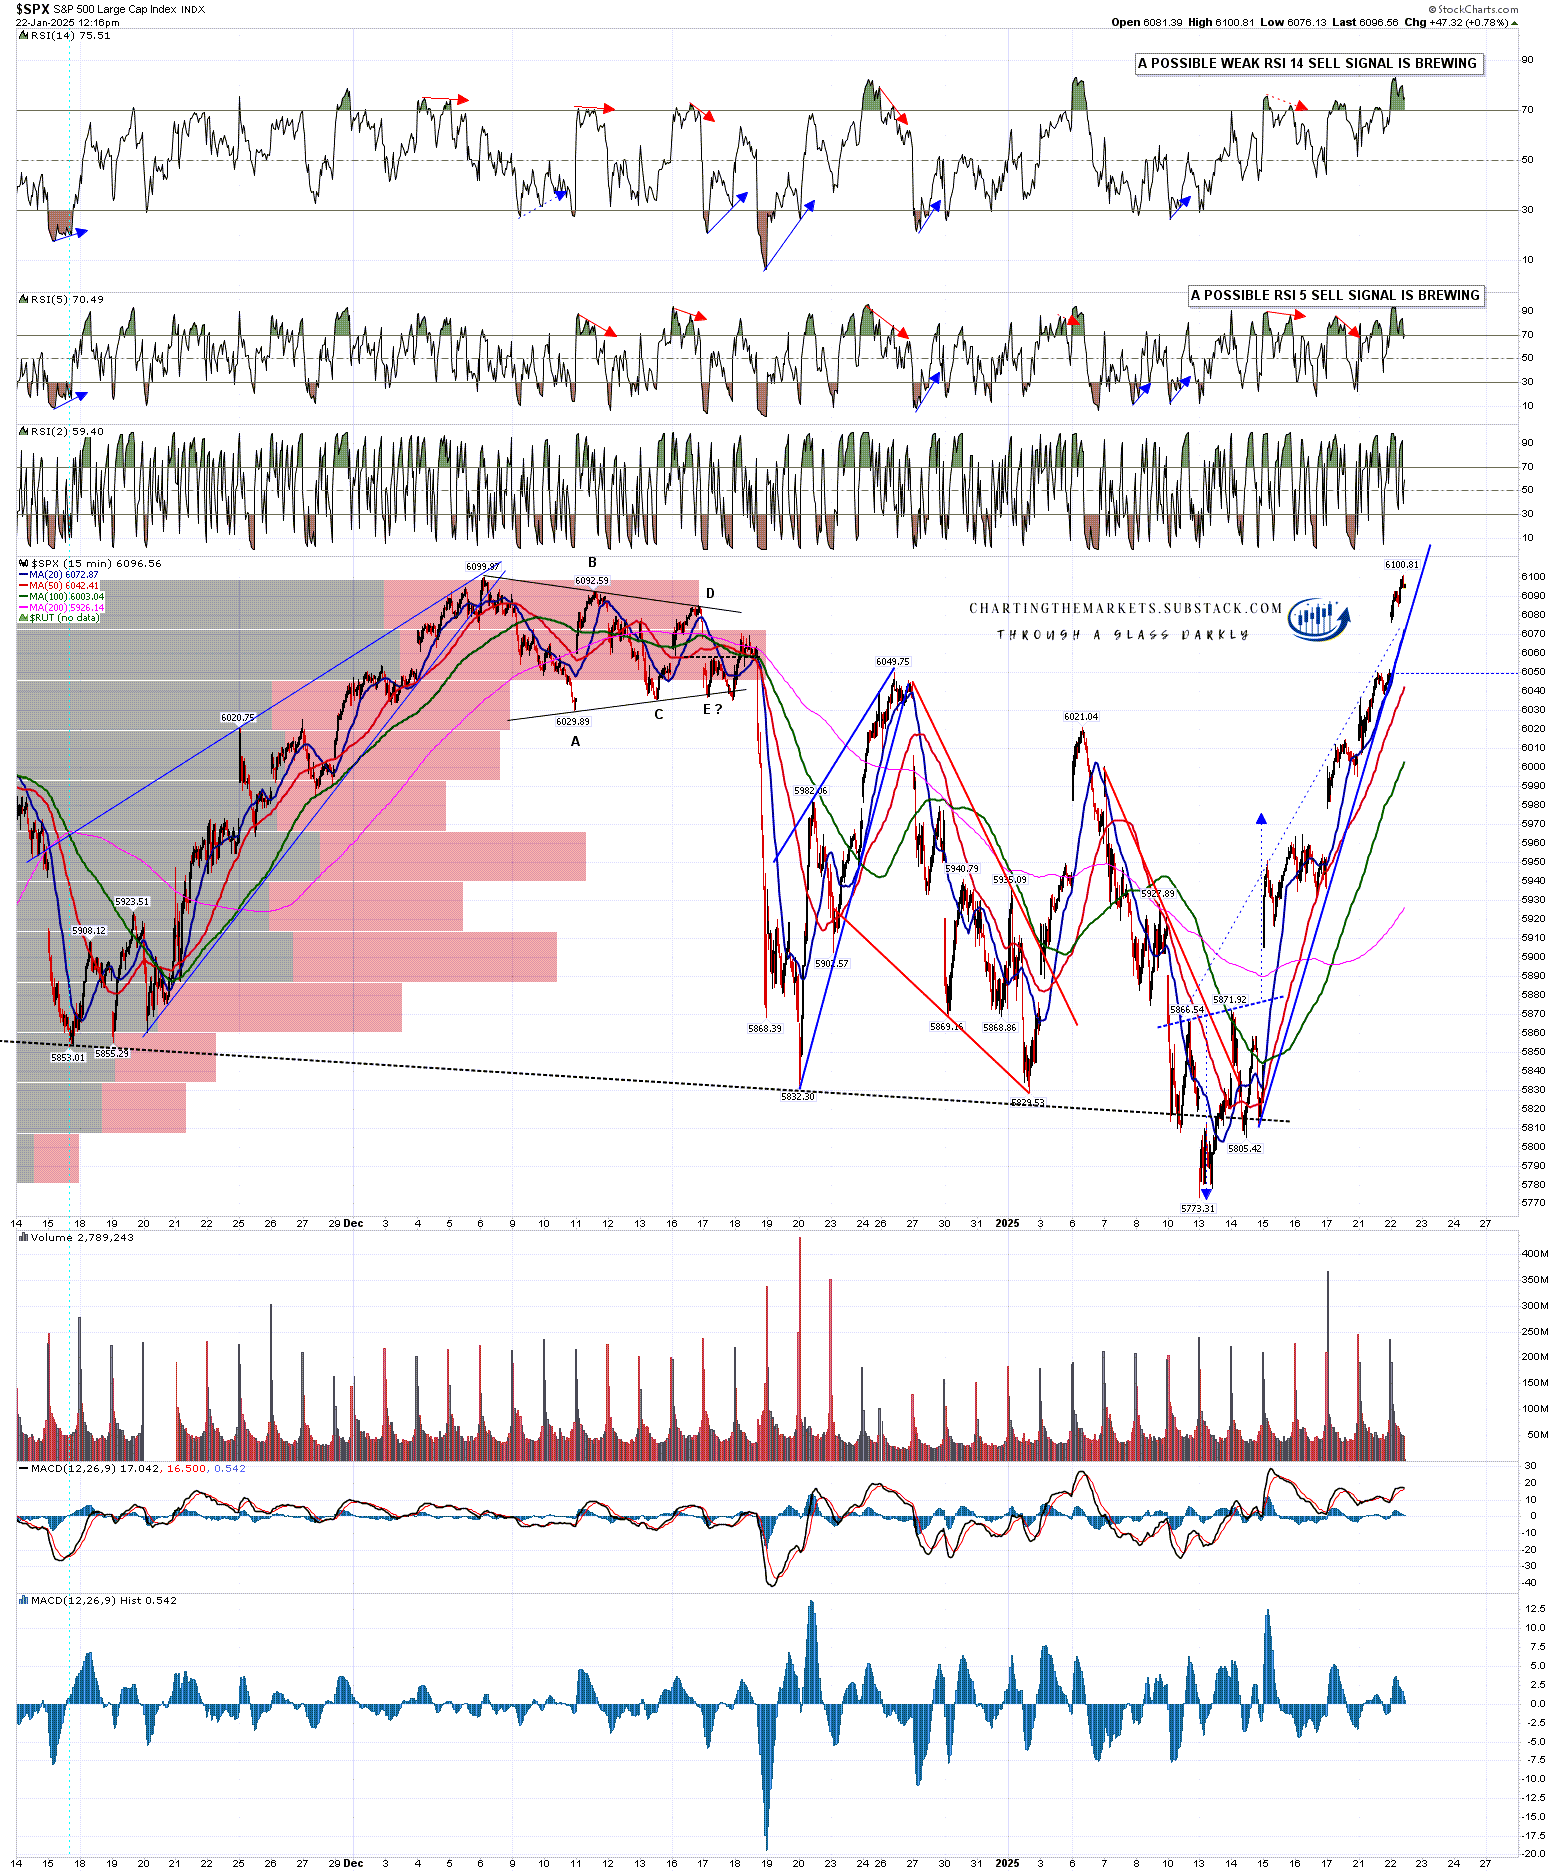
SPX retested the all time high today, and so the first, though not the only, upside target of the upside scenario that I laid out at the start of next week has been reached.
In my post on Monday 13th Jan I was stating that SPX was at the bottom of the big inflection point that has been forming, and that we were likely to see either a serious break down or a rejection back into the highs, showing the possible bull flag setups on SPX, QQQ, DIA and IWM.
In my post on Wednesday 15th Jan I was looking at the rally from Monday’s low, with the bullish reversal patterns forming on SPX, QQQ and DIA that would likely take them higher, and on SPX should open the test of the main resistance level at the daily middle band That would then need to be broken and converted to support to open the retest of the all time high.
In my last post on Thursday 16th Jan I was looking at the test of the daily middle band on SPX and noting again that this needed to break and be established as support and, if done, that would open the retest of the all time high that we saw today.
That all went well and it has really been a very nice rally from the lows into this new all time high today. So what now?
I was suggesting at the lows that these high retests might be part of an overall topping pattern, but there’s little sign of that so far. We should see a retracement soon, as the rising support trendline on SPX is unsustainably steep, but it is only at that retracement that we should establish a support trendline that might be of a larger pattern that might then suggest reversal.
At this stage this move does not look in any way cooked, and the setup is suggesting strongly that SPX has higher to go. Any significant retracement here is likely to be a buy.
SPX 15min chart:
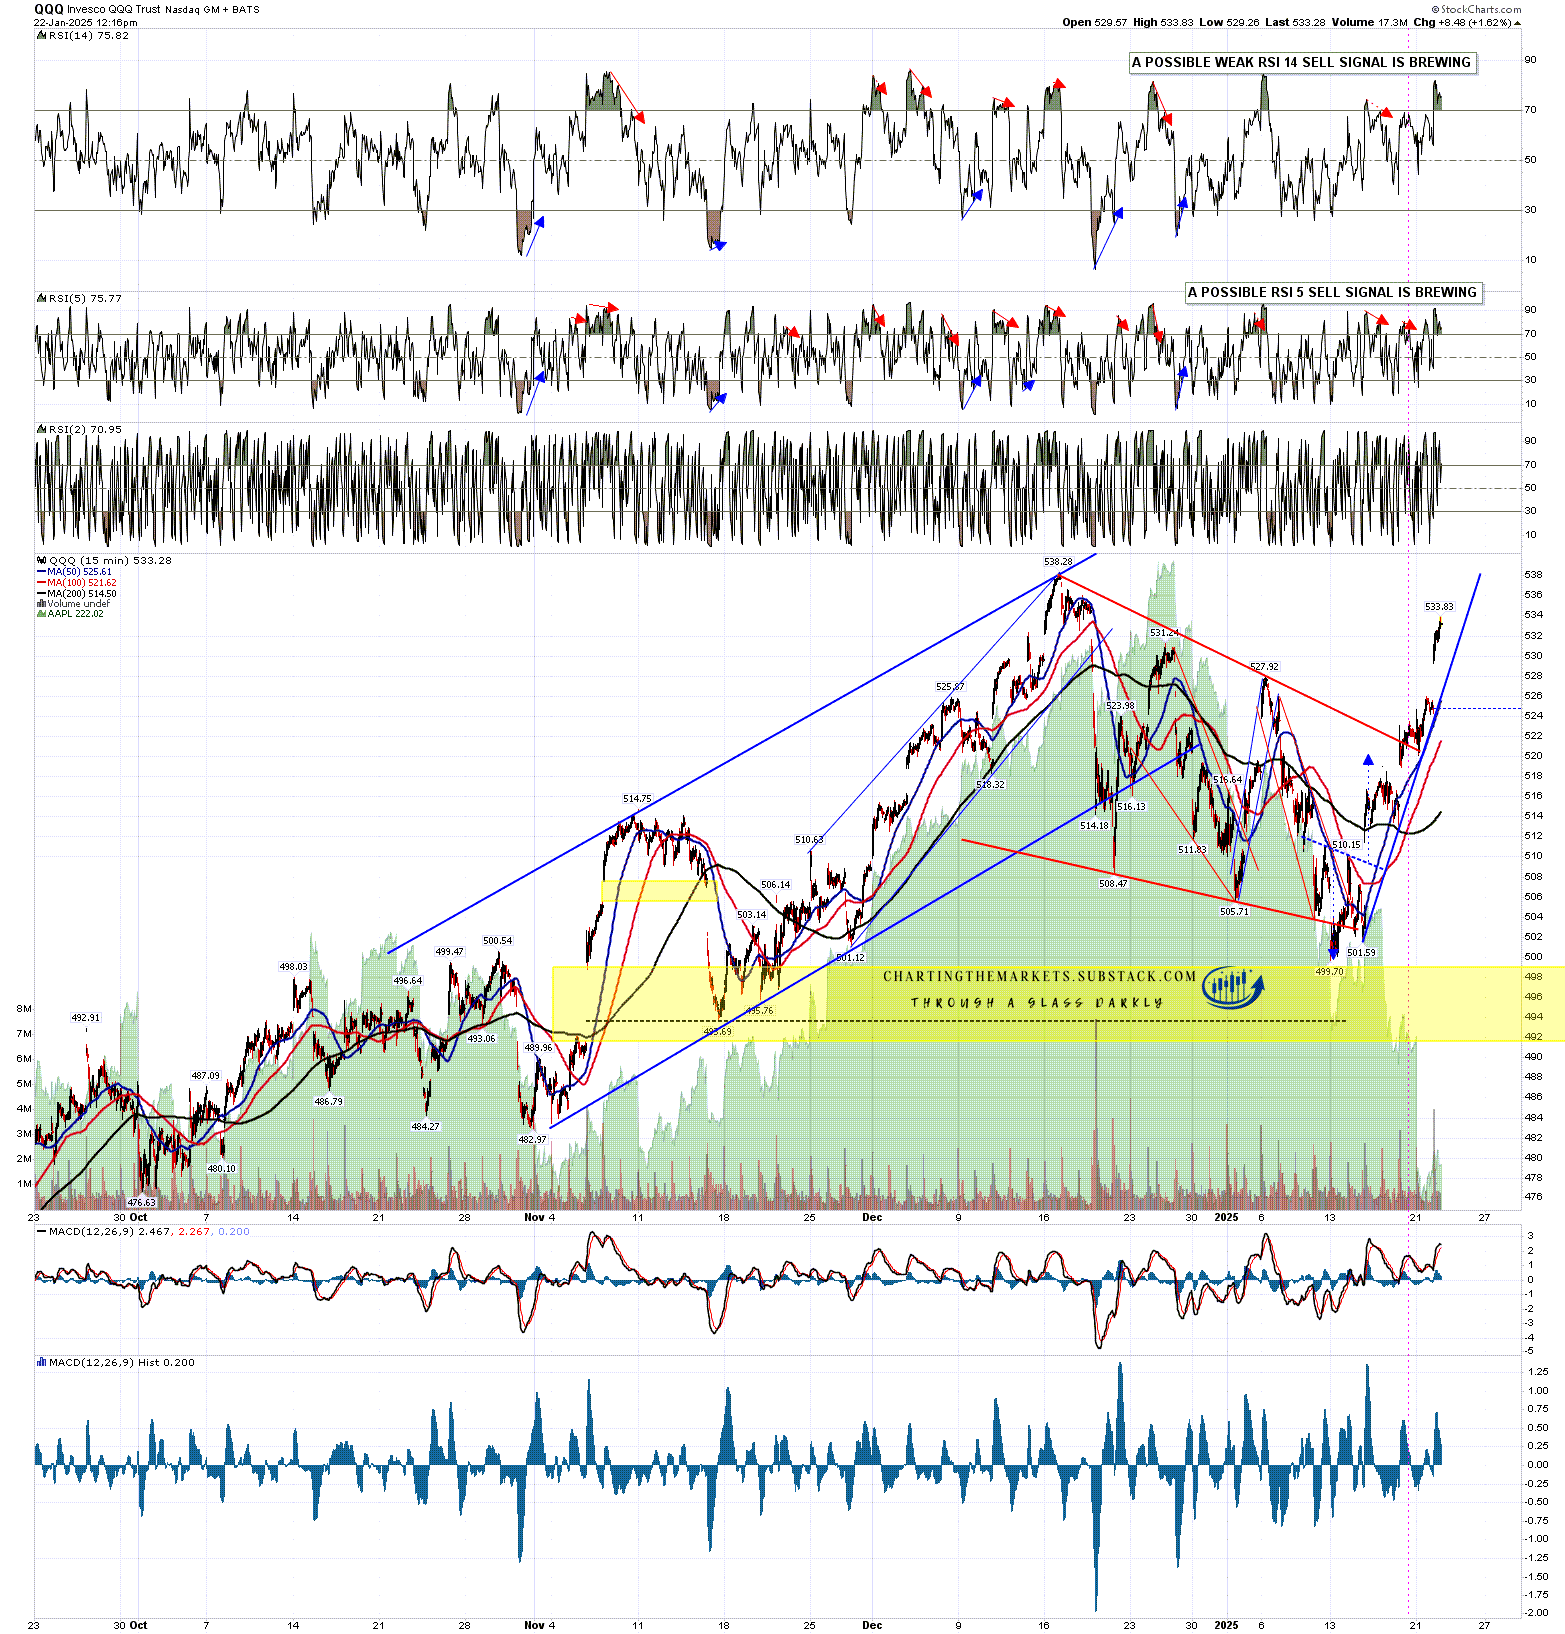
That’s just as well on QQQ, where the good quality bull flag setup I was looking at last week broke up with a similar target at a retest of the all time high. The rising support trendline is also very steep, and we might see a retracement on the way, but that all time high retest is now close and we’ll likely see that soon.
QQQ 15min chart:
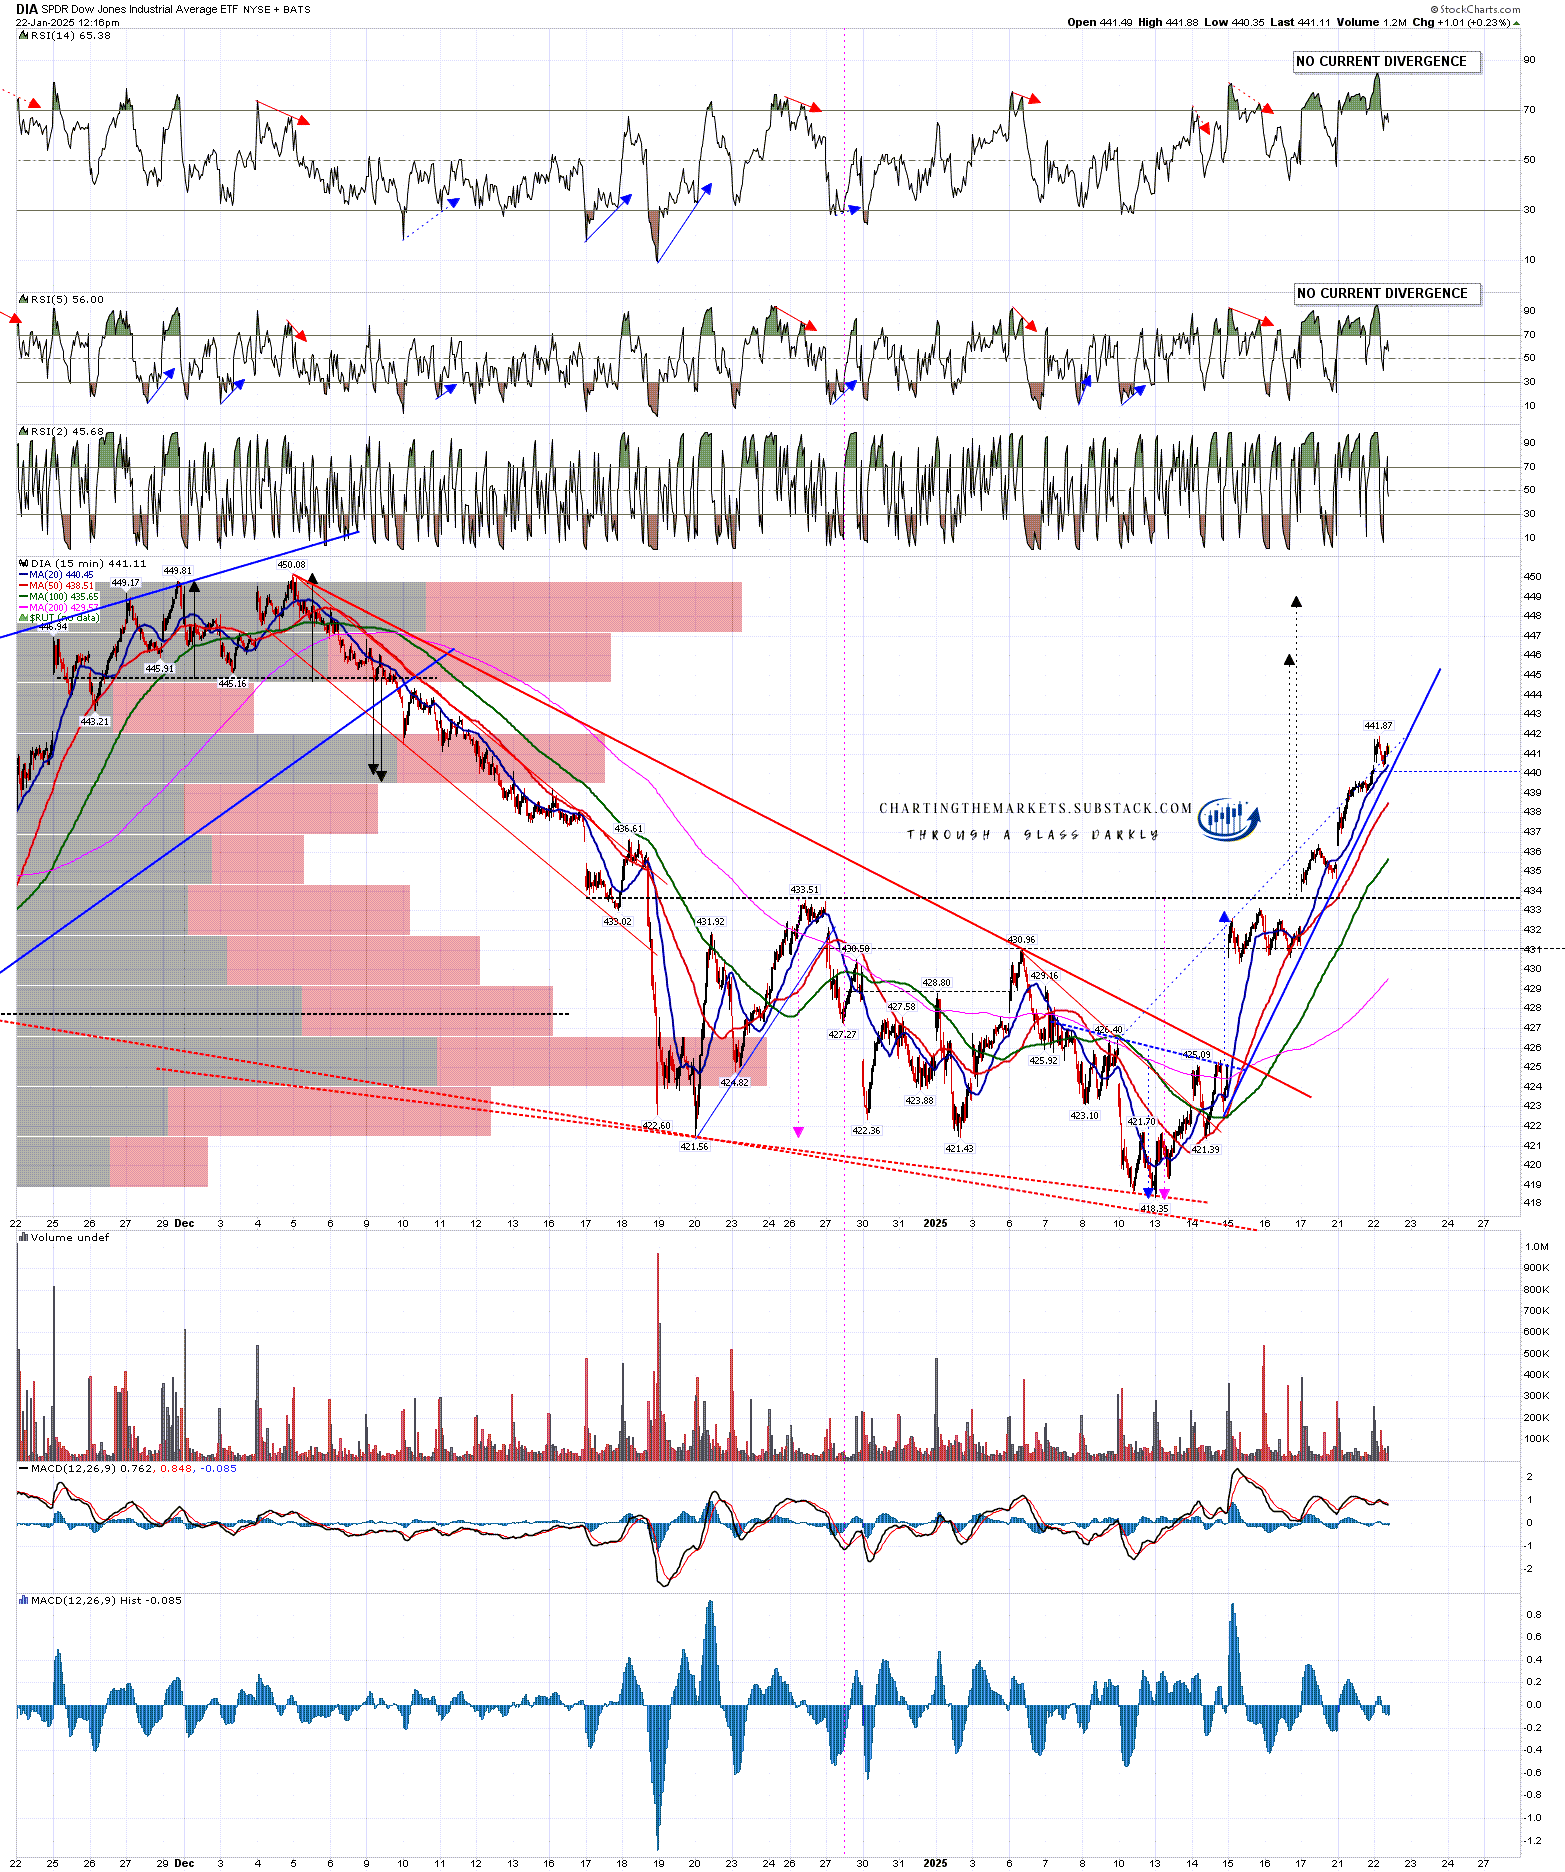
DIA had another good quality bull flag setup and a possible decent looking double bottom setup that has broken up with targets in the 446-9 range. That would put DIA within easy range of the all time high and that is of course the target of the bull flag that broke up. I’m am also thinking DIA should make a new all time high.
DIA 15min chart:
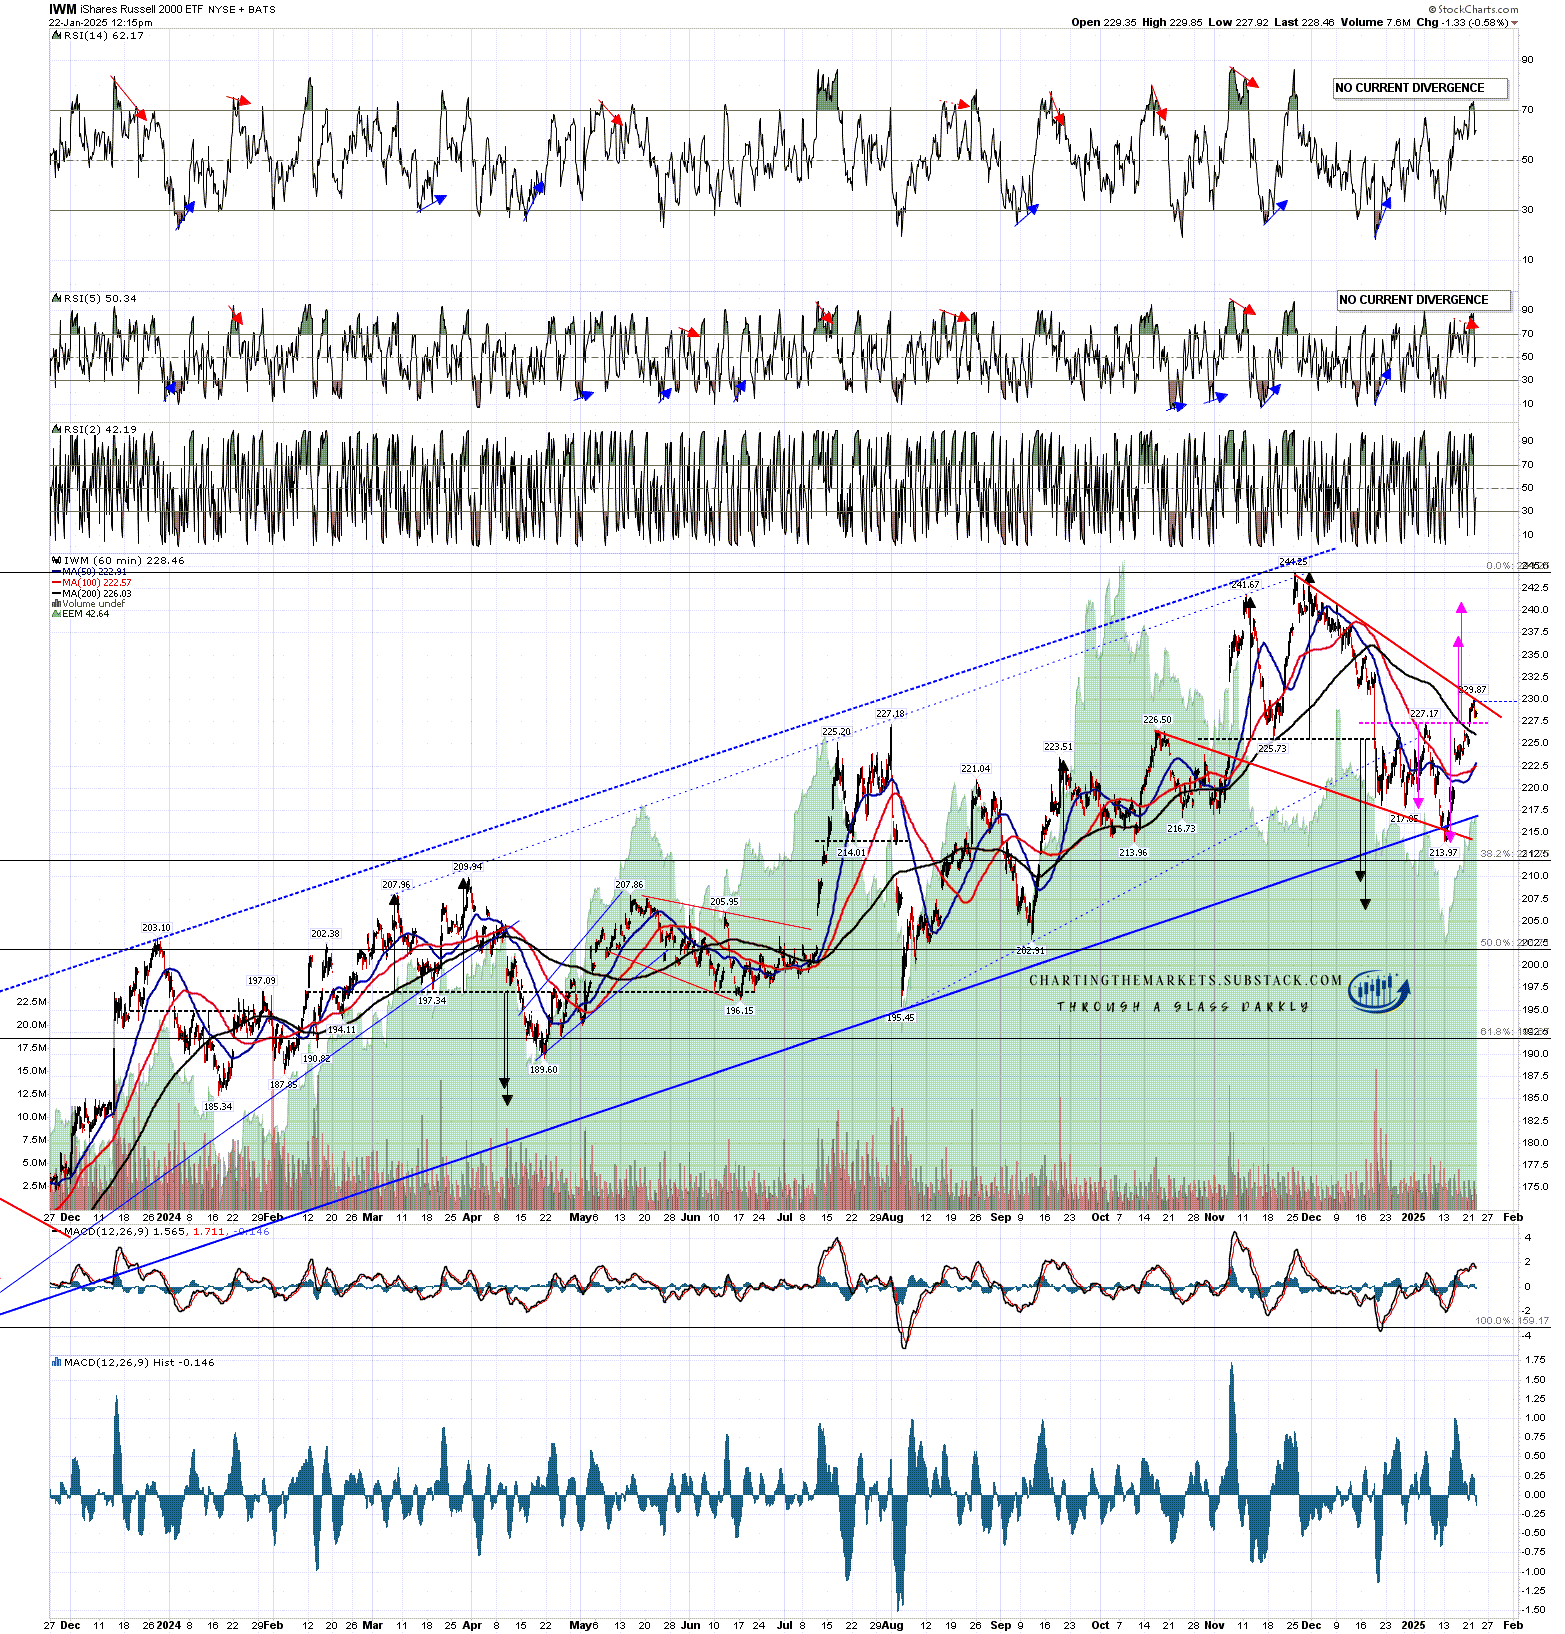
IWM is a tougher call. There is a decent bull flag setup on IWM too, which has a promising bearish underthrow but is only now testing bull flag wedge resistance. A strong break up would again look for a retest of the all time high but obviously IWM has been a bit slower off the low and is the only one of the four that has not yet broken this key resistance level.
I’m leaning towards this breaking up too, but I would note that this wouldn’t be a bad time to see some retracement before IWM does that.
IWM 60min chart:
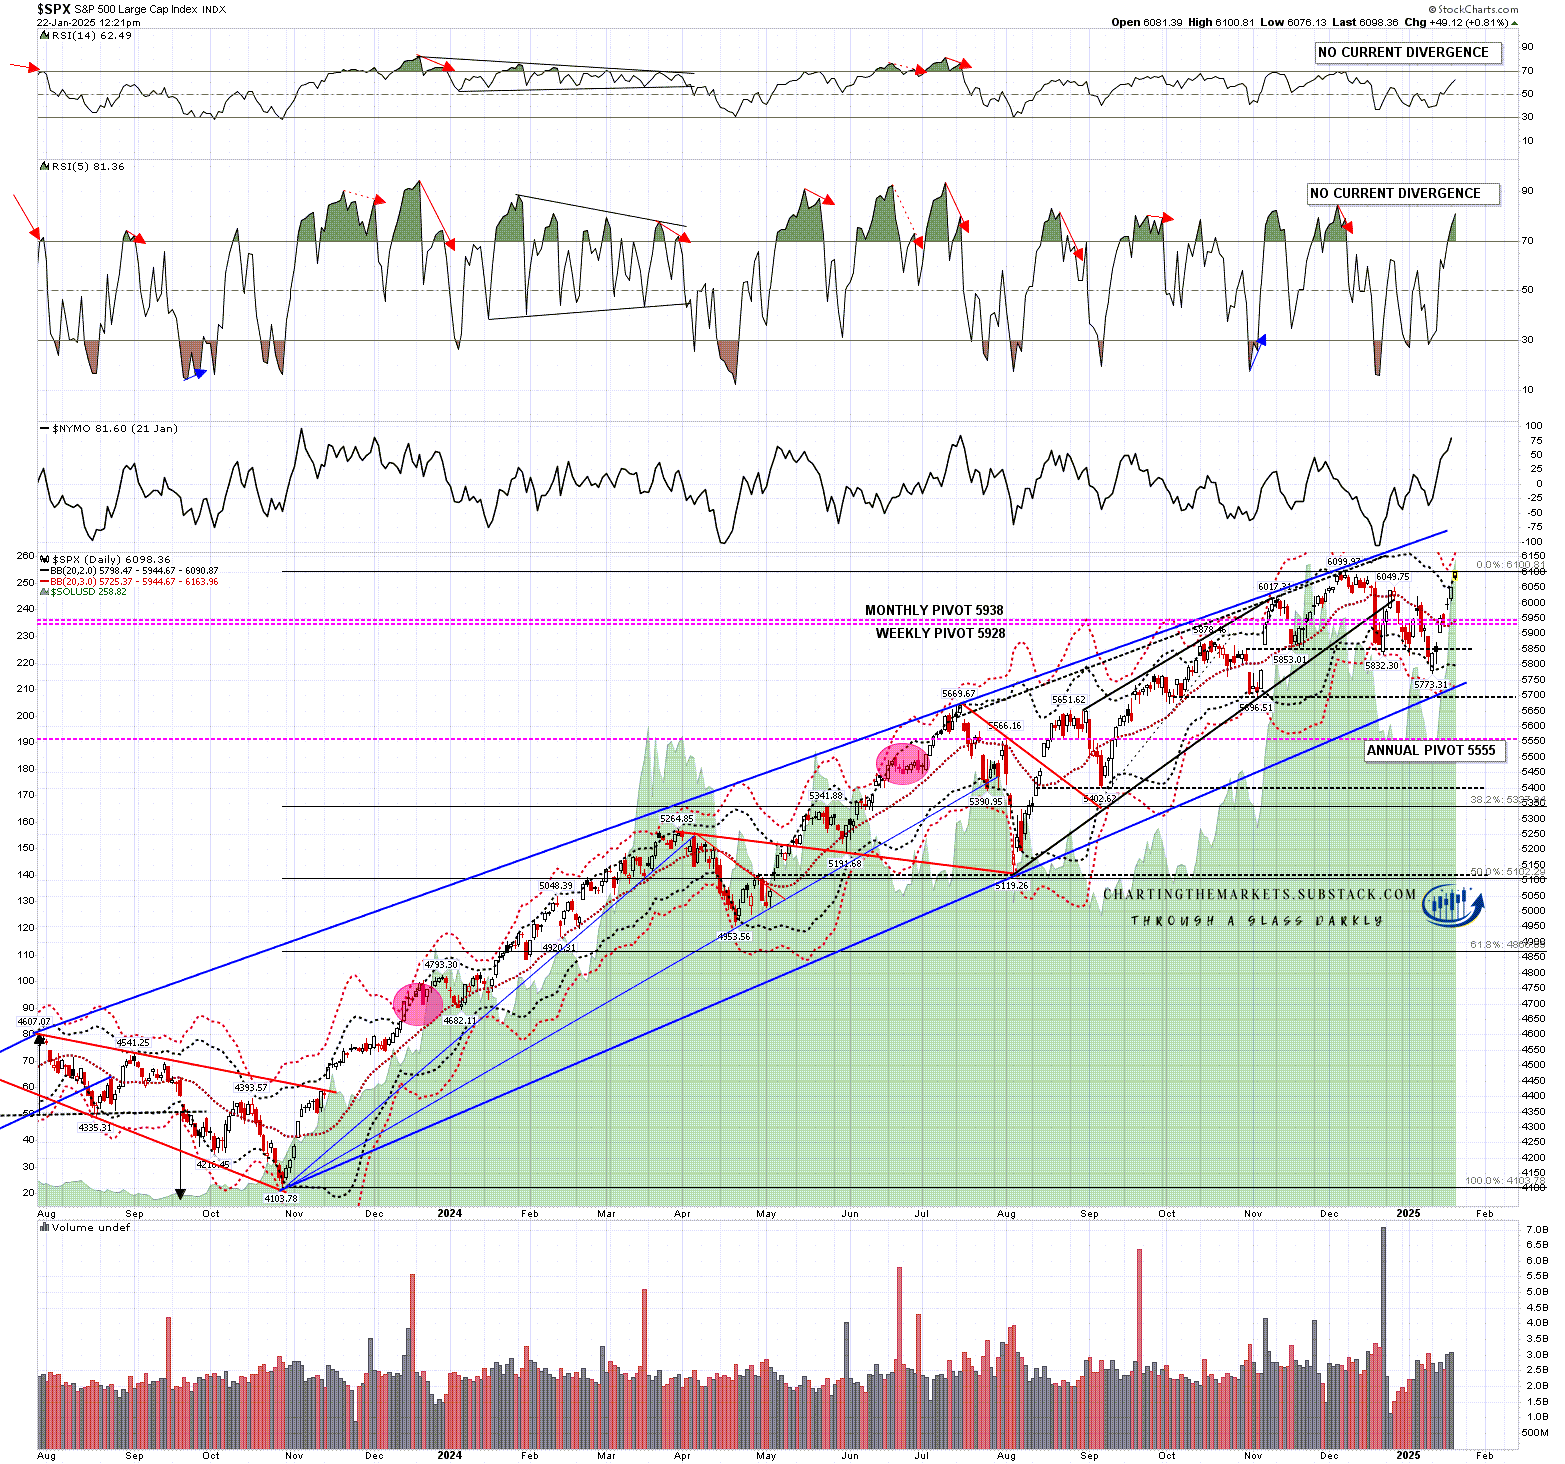
On the SPX daily chart there is now obviously a possible double top setup which at this stage I am noting but consider a low probability pattern. SPX is on a daily upper band ride and the bands are now expanding which will give more range to the upside.
No current negative RSI divergence and I’m seeing this as a setup where bears should just step aside until this move runs out of steam, and there is currently little sign of that happening.
SPX daily chart:
Overall this move up has gone well and likely will go significantly higher from here. There is a decent chance that we will see new all time highs on all of SPX, QQQ, DIA and IWM. I’ll be watching for signs that we might see a strong reversal but, so far at least, I’m not seeing anything to suggest that here.
I’m leaning towards a weak first half of 2025 and new all time highs later in the year, very possibly as a topping process for a much more significant high. One way or another I think we’ll be seeing lower soon and I’m not expecting this to be a good year for US equities. The last two years have been banner years for US equities. A third straight year of these kinds of gains looks like a big stretch. I could of course however be mistaken. :-)
If you like my analysis and would like to see more, please take a free subscription at my chartingthemarkets substack, where I publish these posts first.
I also do a premarket video every day on equity indices, bonds, currencies, energies, precious commodities and other commodities at 8.45am EST. If you’d like to see those I post the links every morning on my twitter, and the videos are posted shortly afterwards on my Youtube channel.
No comments:
Post a Comment