- WE'RE JUST RANDOM SPECKS OF DUST IN A TORNADO TO THE MARKETS .......
- CHARTISTS MUST PUT ALL BIAS ASIDE AND LET THE CHARTS DO THE TALKING OR WE'LL SEE ONLY WHAT WE WANT TO SEE
- This blog has a copy of all header posts that I publish anywhere, so that those interested in seeing what my thoughts are on the markets can find them easily.
- I will be answering questions and responding to comments, so feel free to respond to any posts and I will see your comment even if it is not on the most recent post.
- If you're interested in seeing any intraday charts I post, I do that on twitter, and my twitter handle is @shjackcharts.
- The charts in the posts are as large as I can practically make them. if you would like to look at one more closely, click on it, and the link will take you to a larger version at screencast. If you click on that again, you will get a full page version, and can use the resizing function on your browser to enlarge parts of interest further.

Wednesday, 30 July 2025

So Here We Are Again

Every so often I talk about the way chart patterns form and how they can evolve, and I have some very good illustrations of what I mean by that to show you today.

When rising wedges form in a trend and break down, sometimes they are just expanding as they rise and, when we saw breaks down the initial rising wedges from the April lows on SPX and QQQ a few weeks ago, I was talking about how if further levels above were reached then the wedges were just expanding and I would redraw the support trendlines as unbroken. That would create a new inflection point as those new patterns broke down.

What I am looking for in these cases are high quality resistance trendlines to form, either extensions of the initial wedge resistance trendlines or new trendlines, and I have three very high quality examples of the latter to show you today.

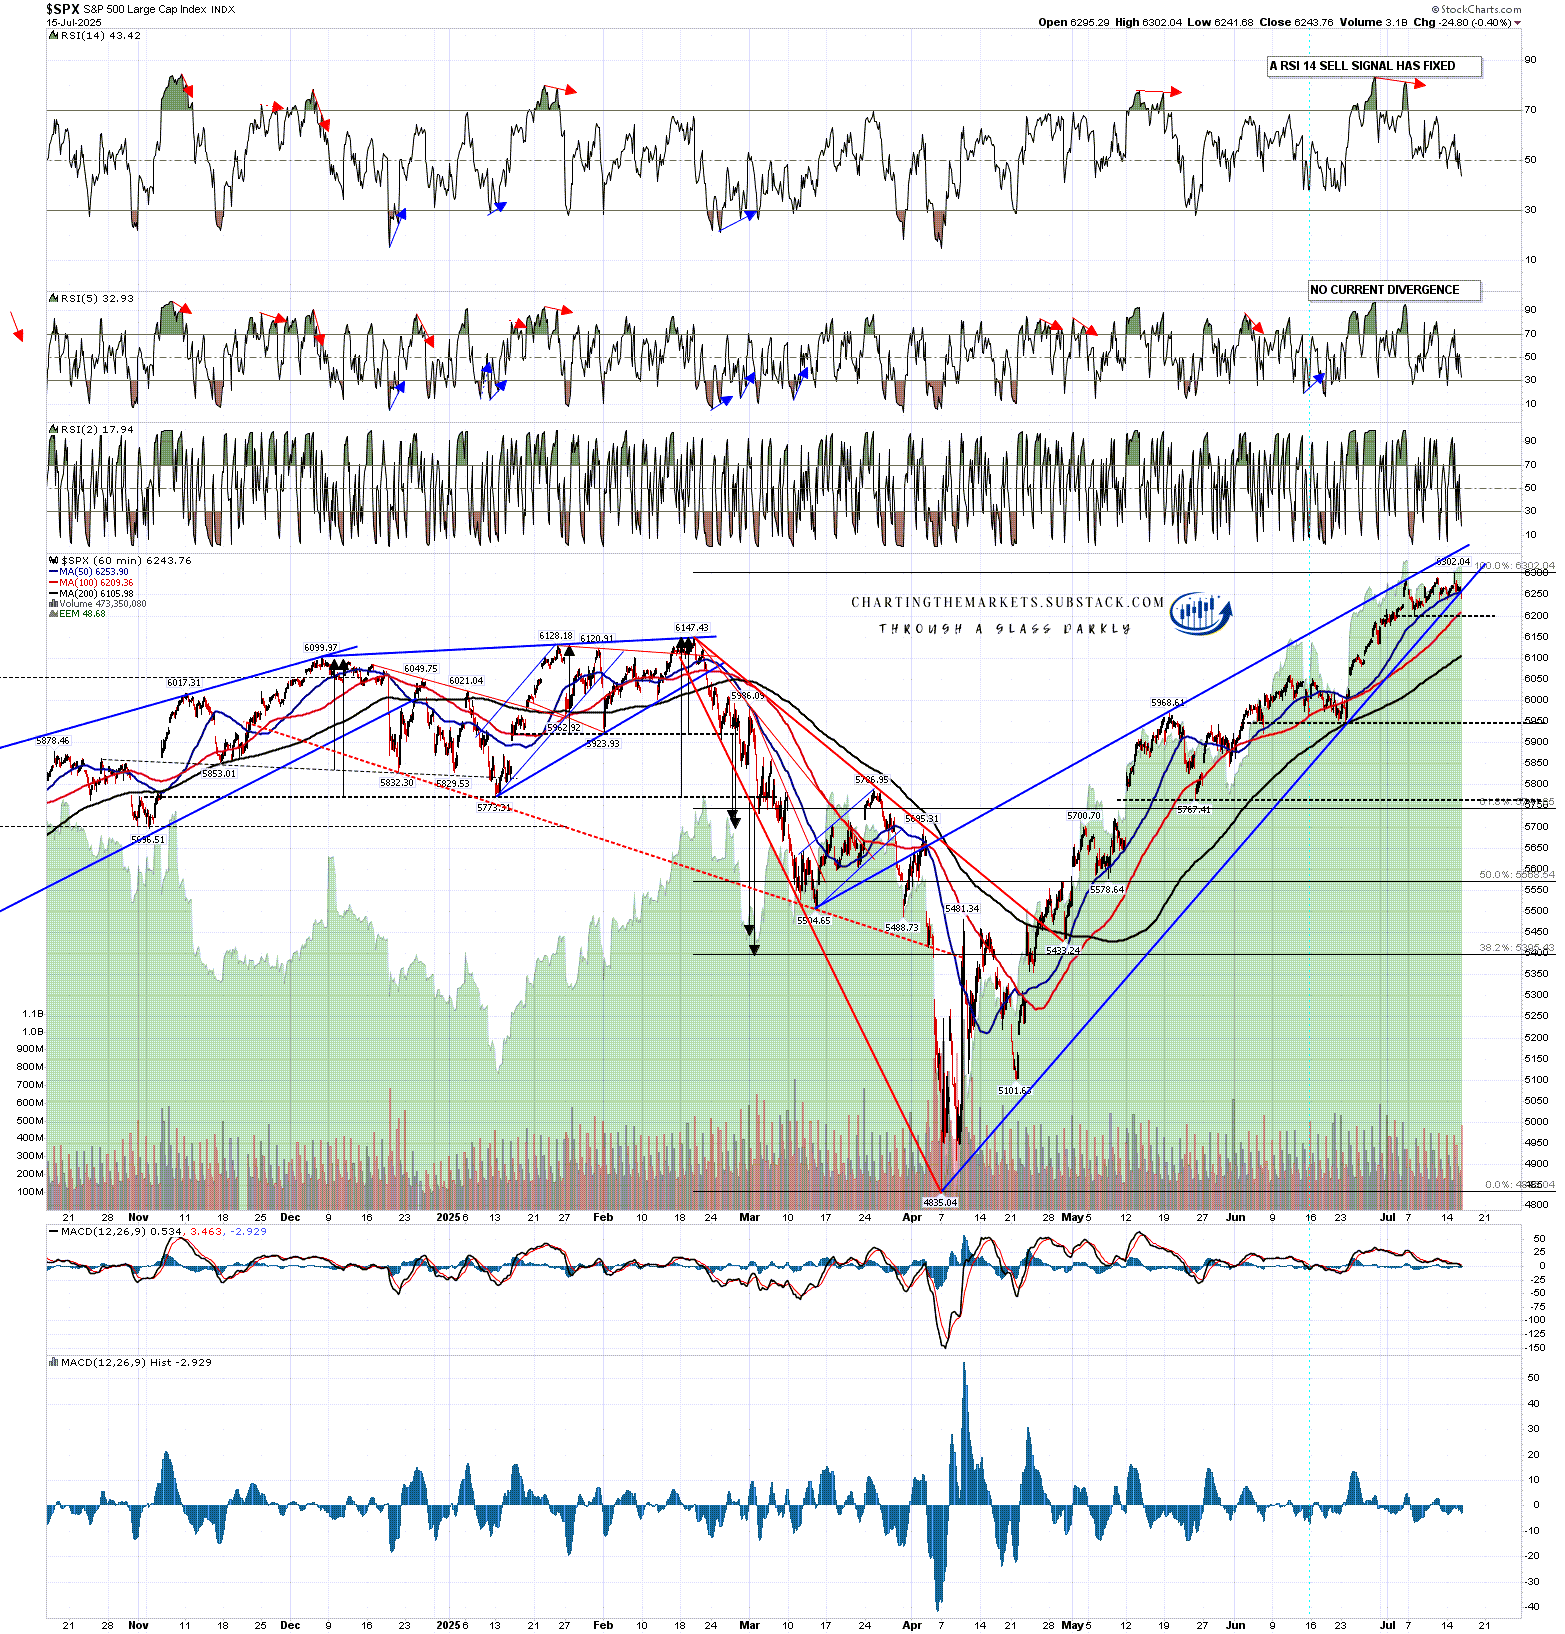
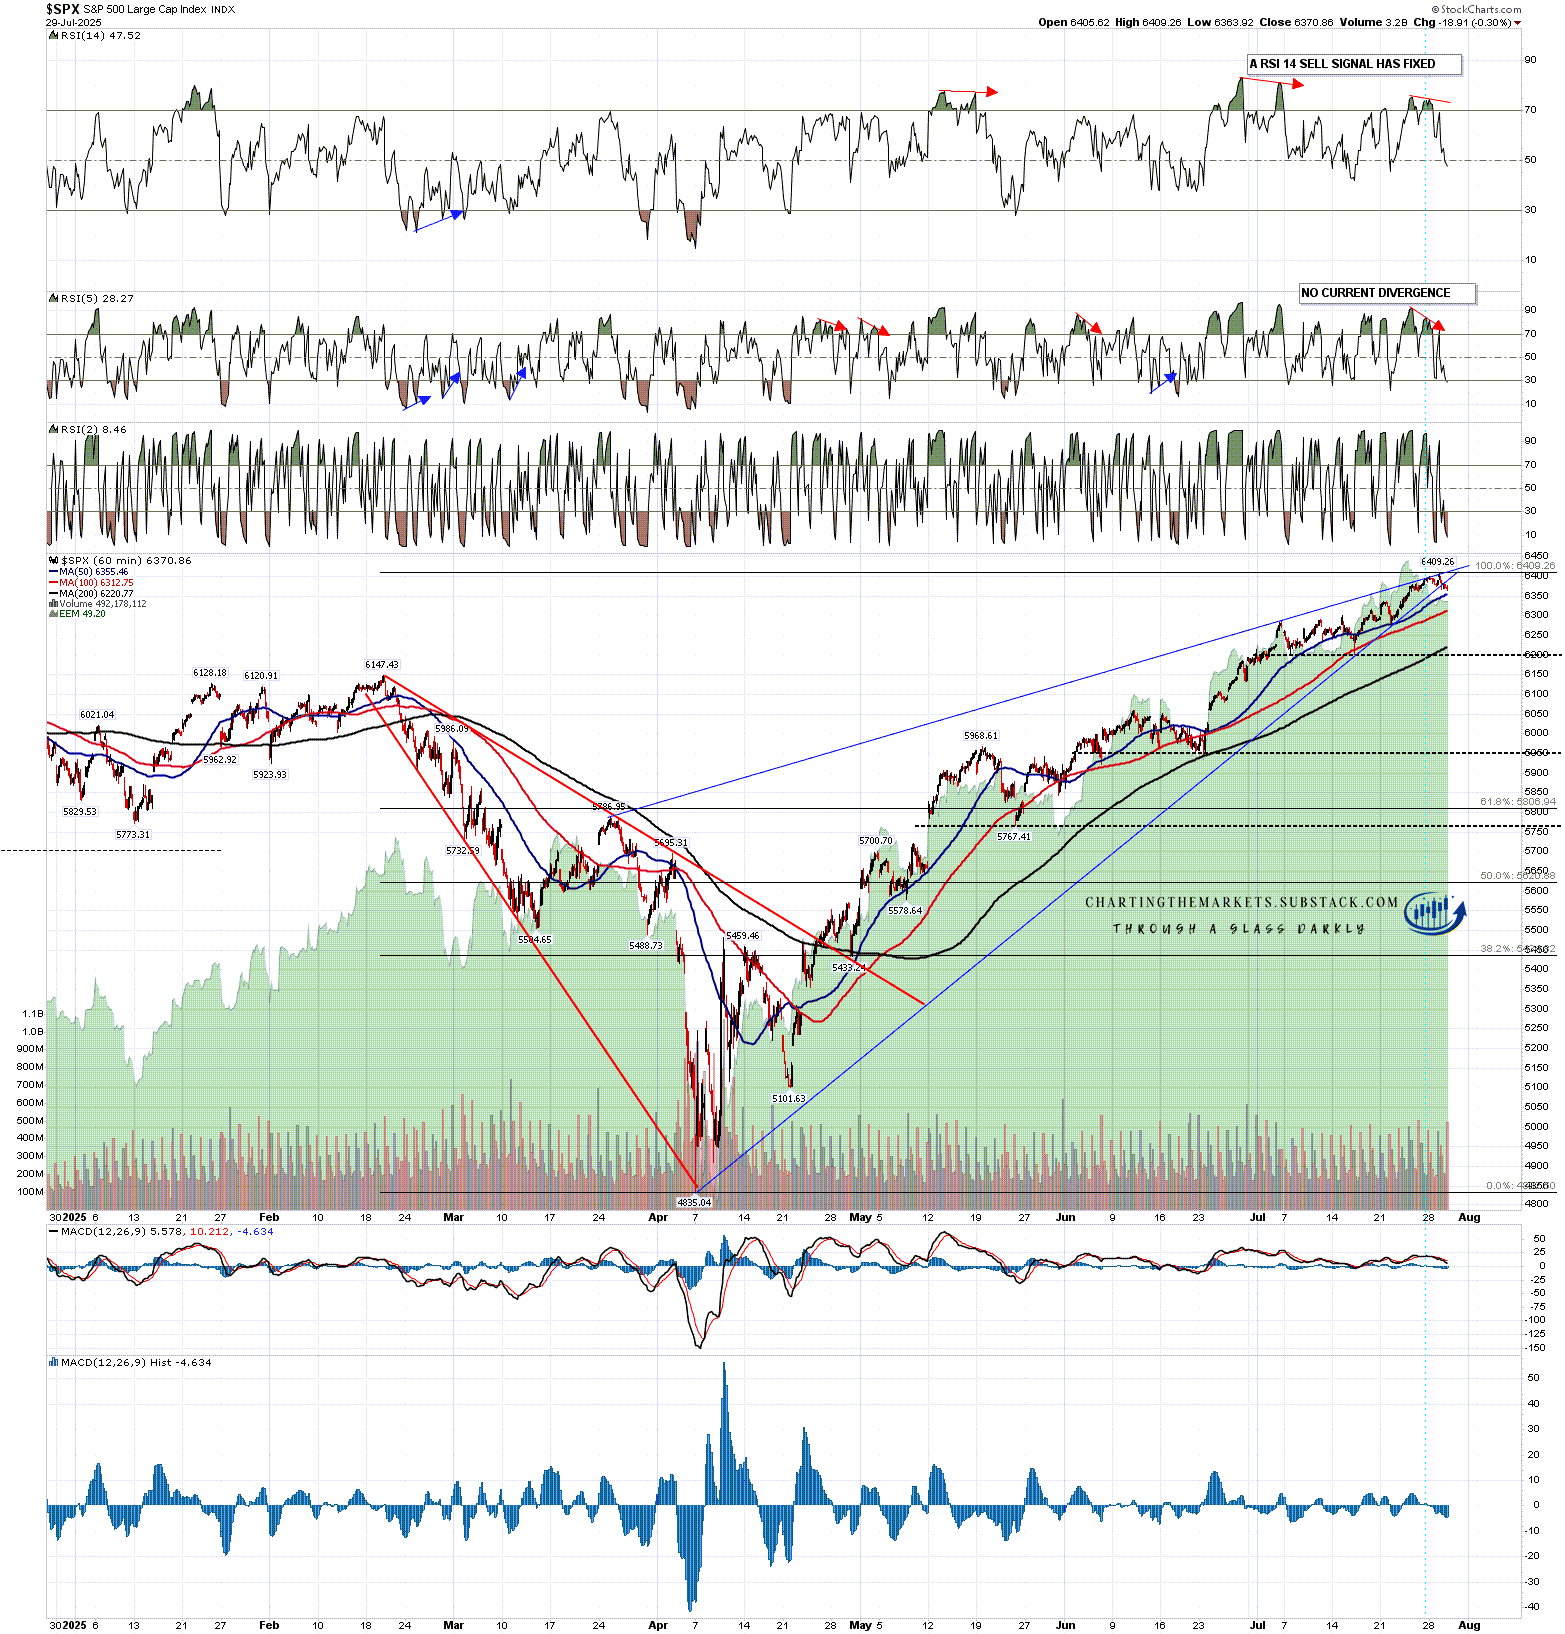
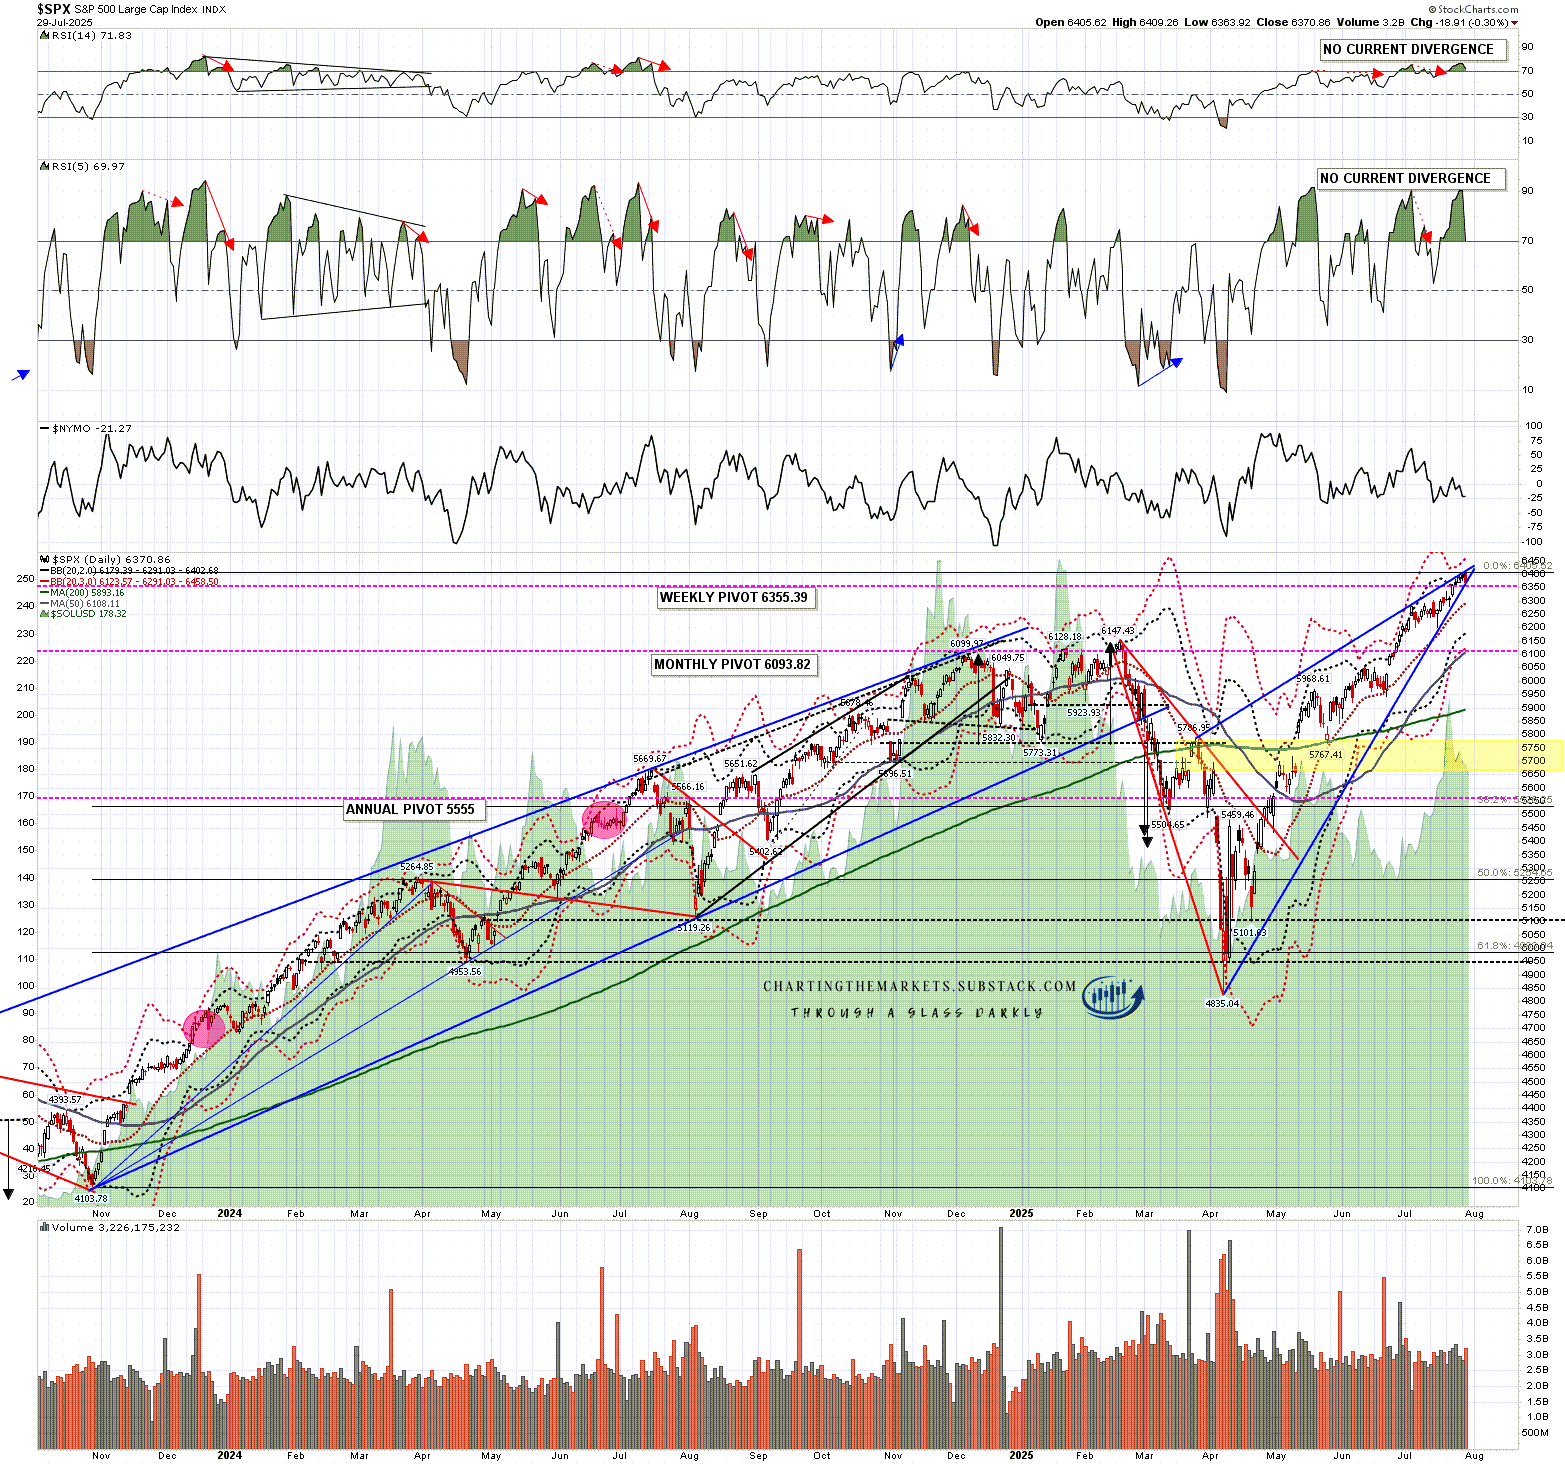
The first of those today is on SPX where there is a lovely three touch resistance trendline established at the last high coming from the late March rally high. This updated rising wedge has broken down this week.

SPX 60min chart:

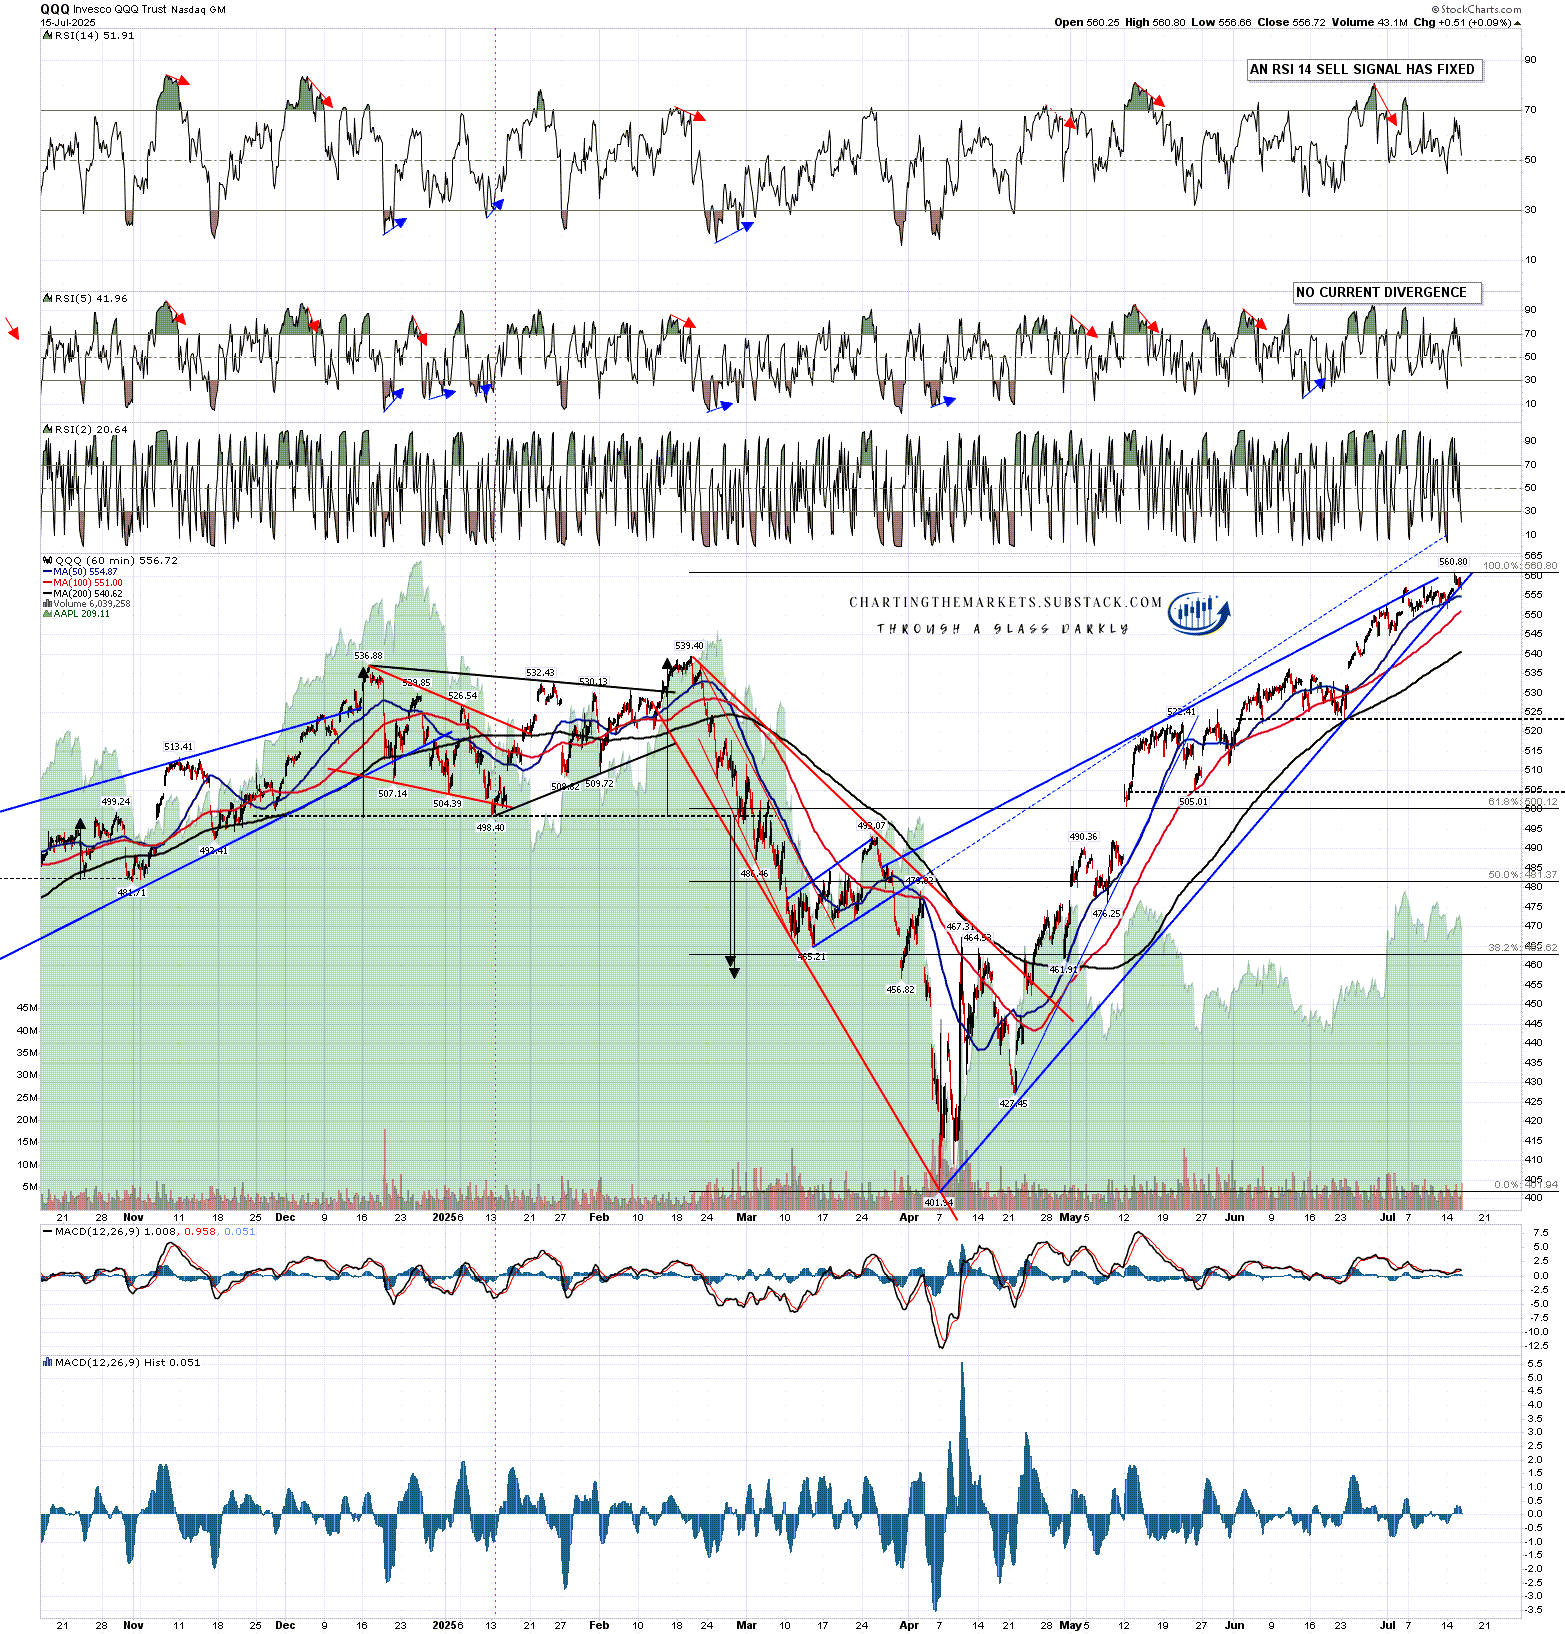
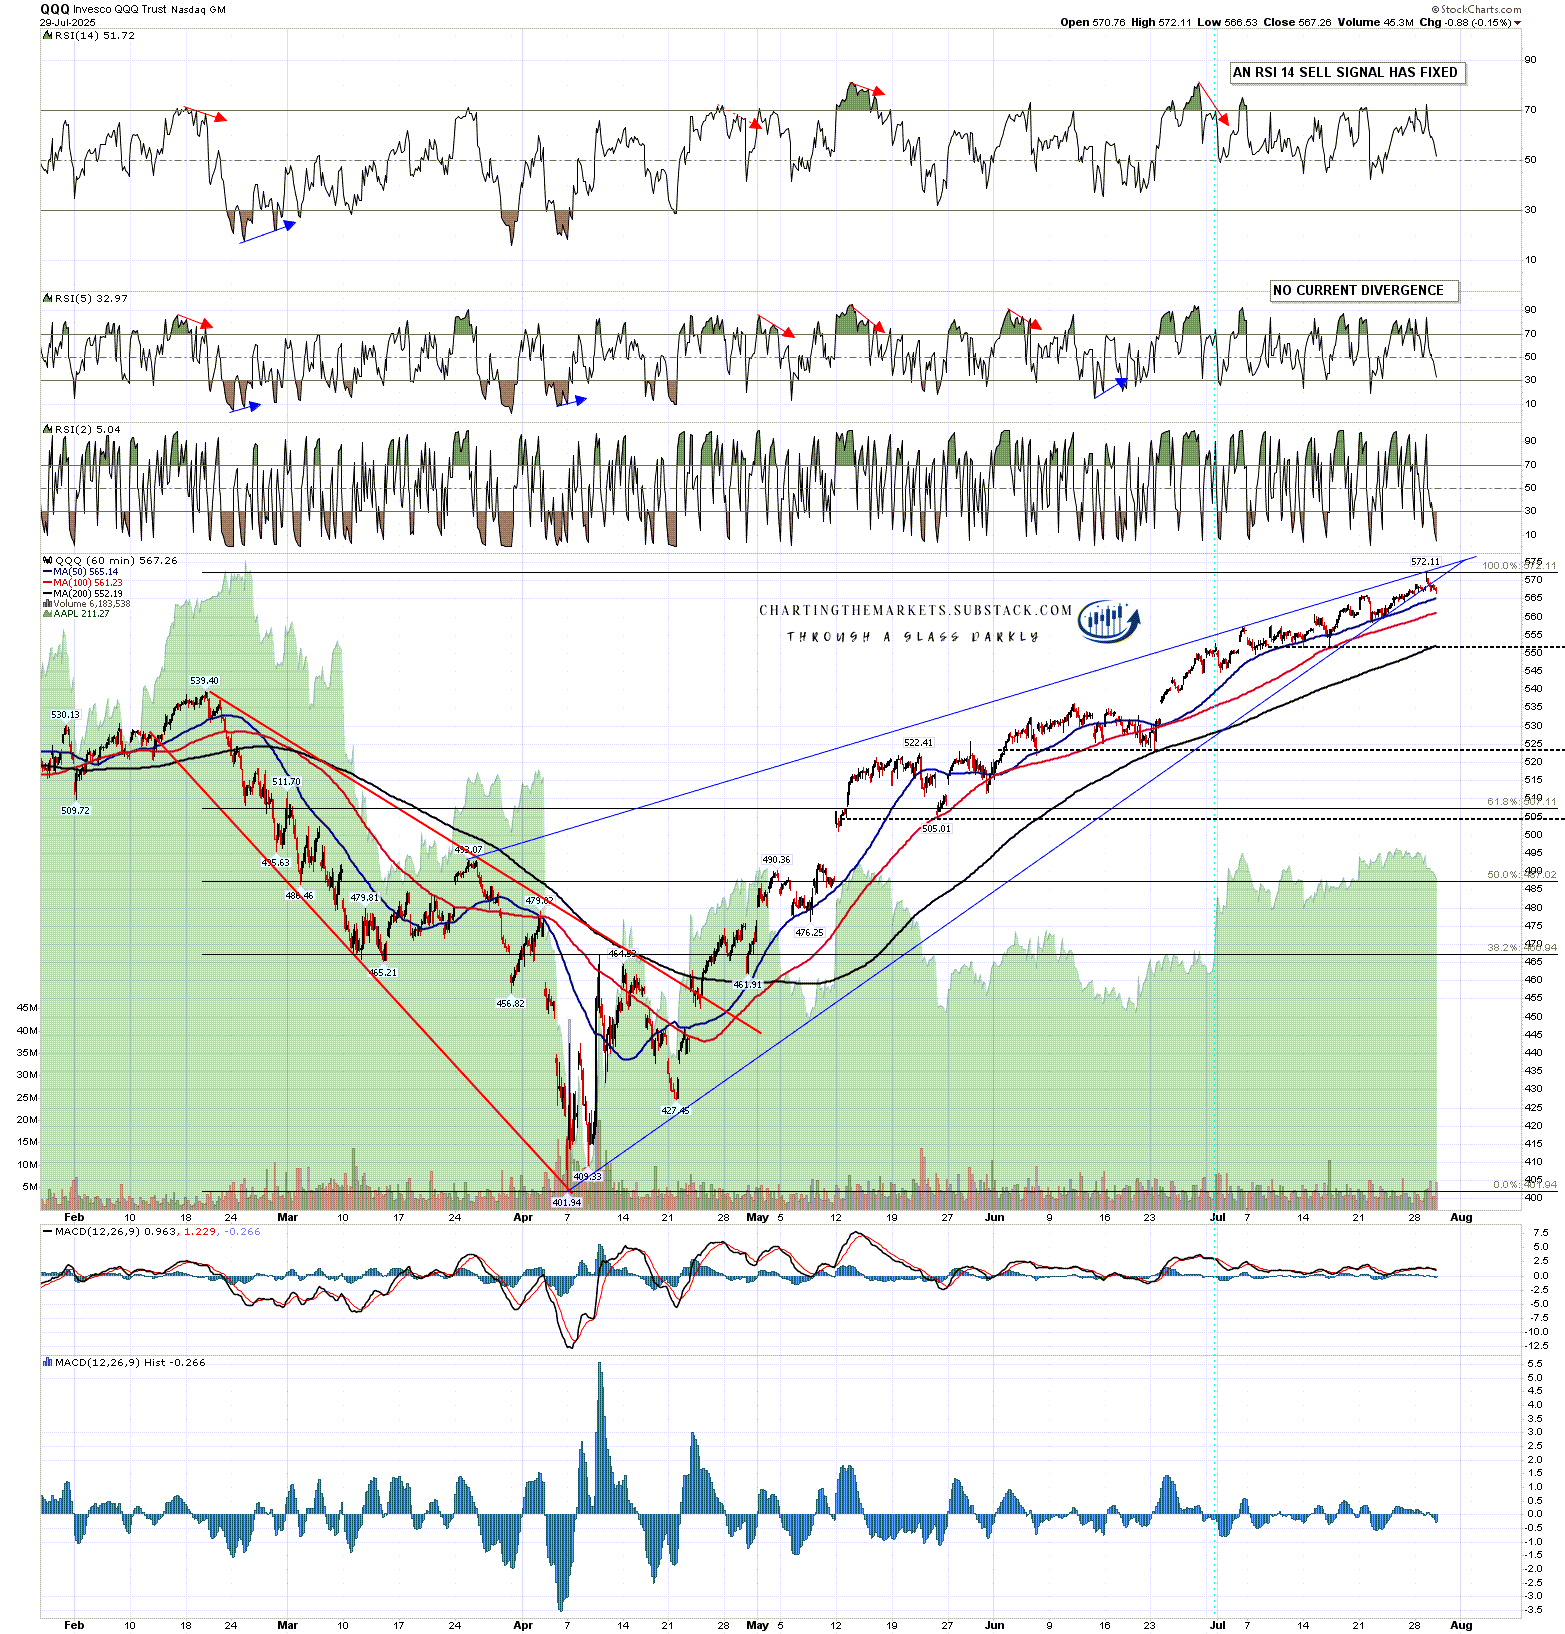
The second of those today is on QQQ where there is a lovely three touch resistance trendline established at the last high again coming from the late March rally high. This updated rising wedge has also broken down this week.

QQQ 60min chart:

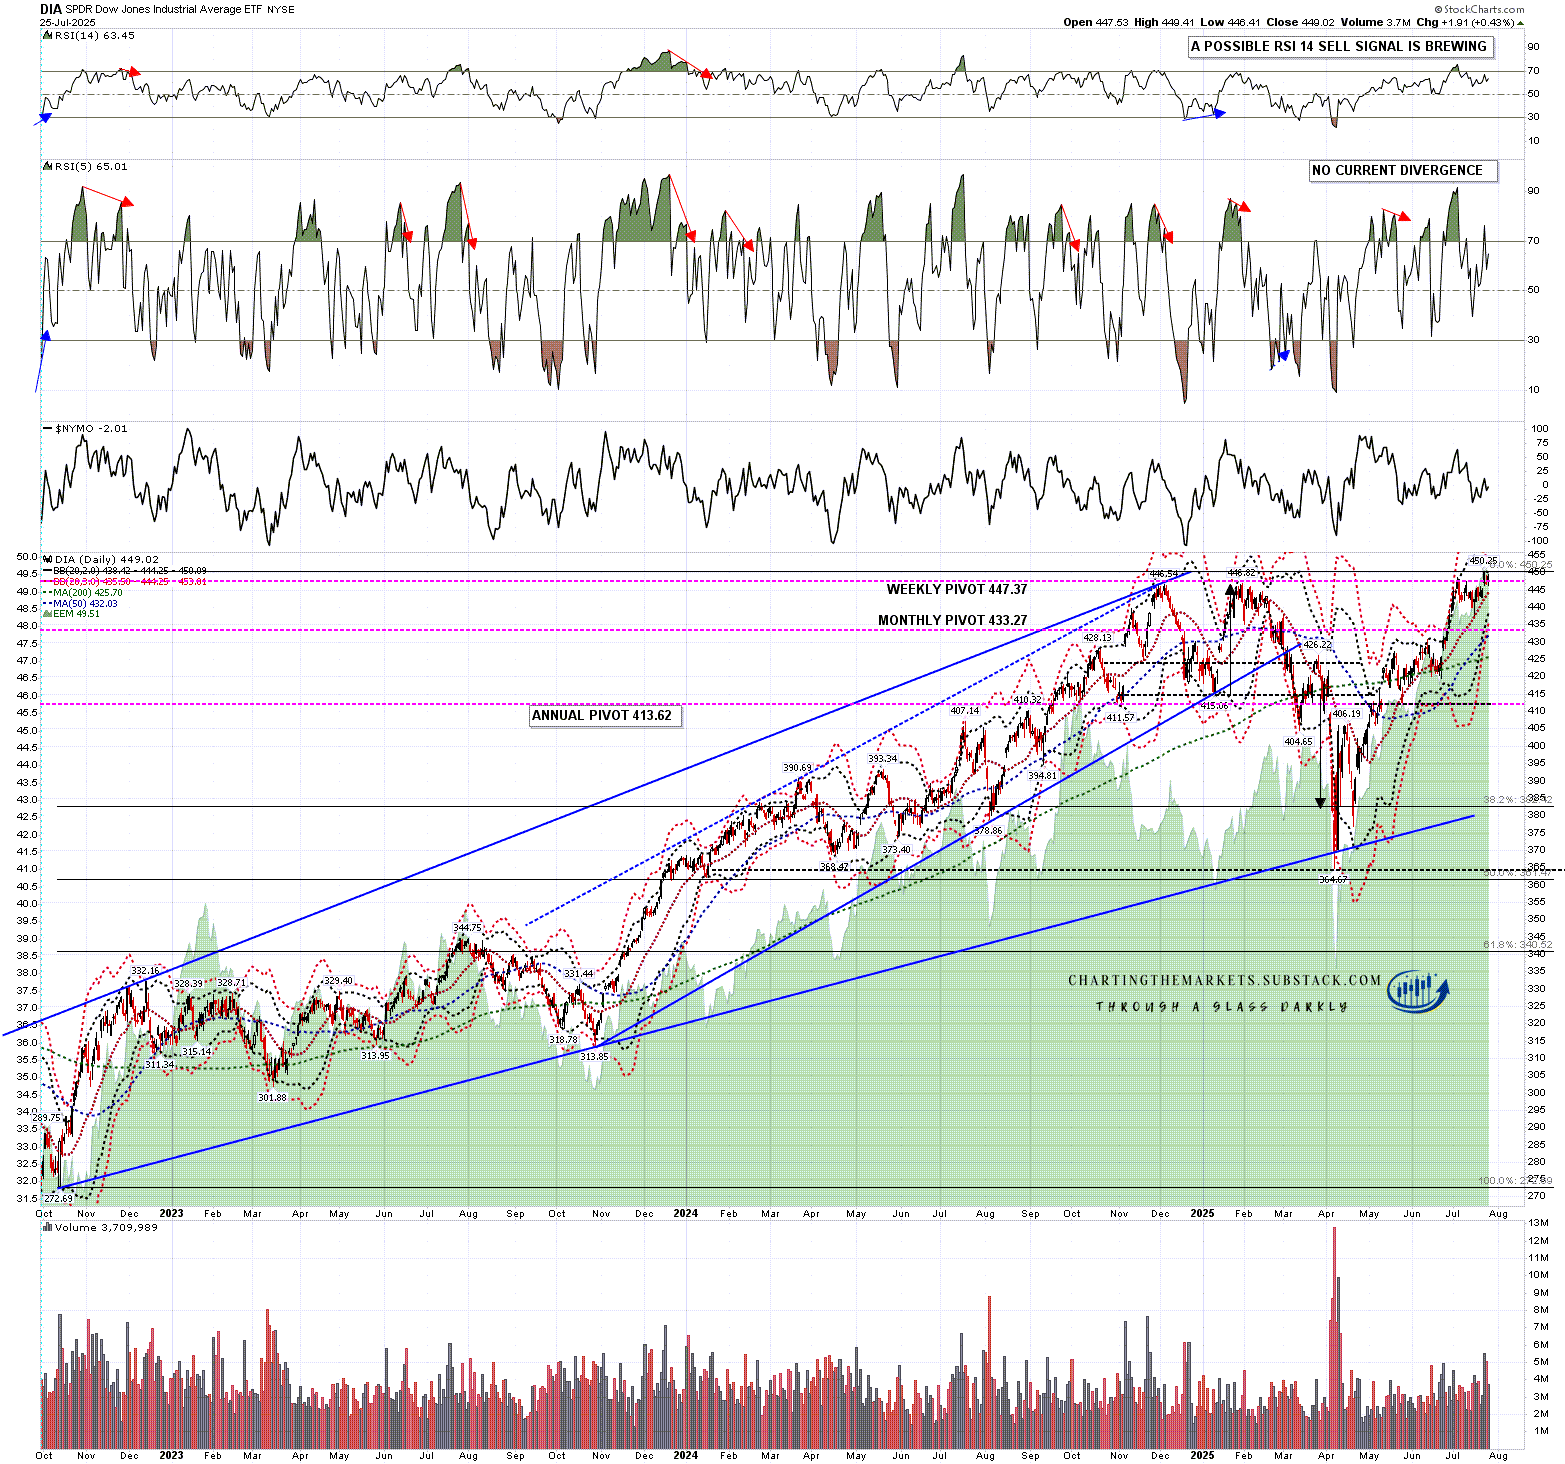
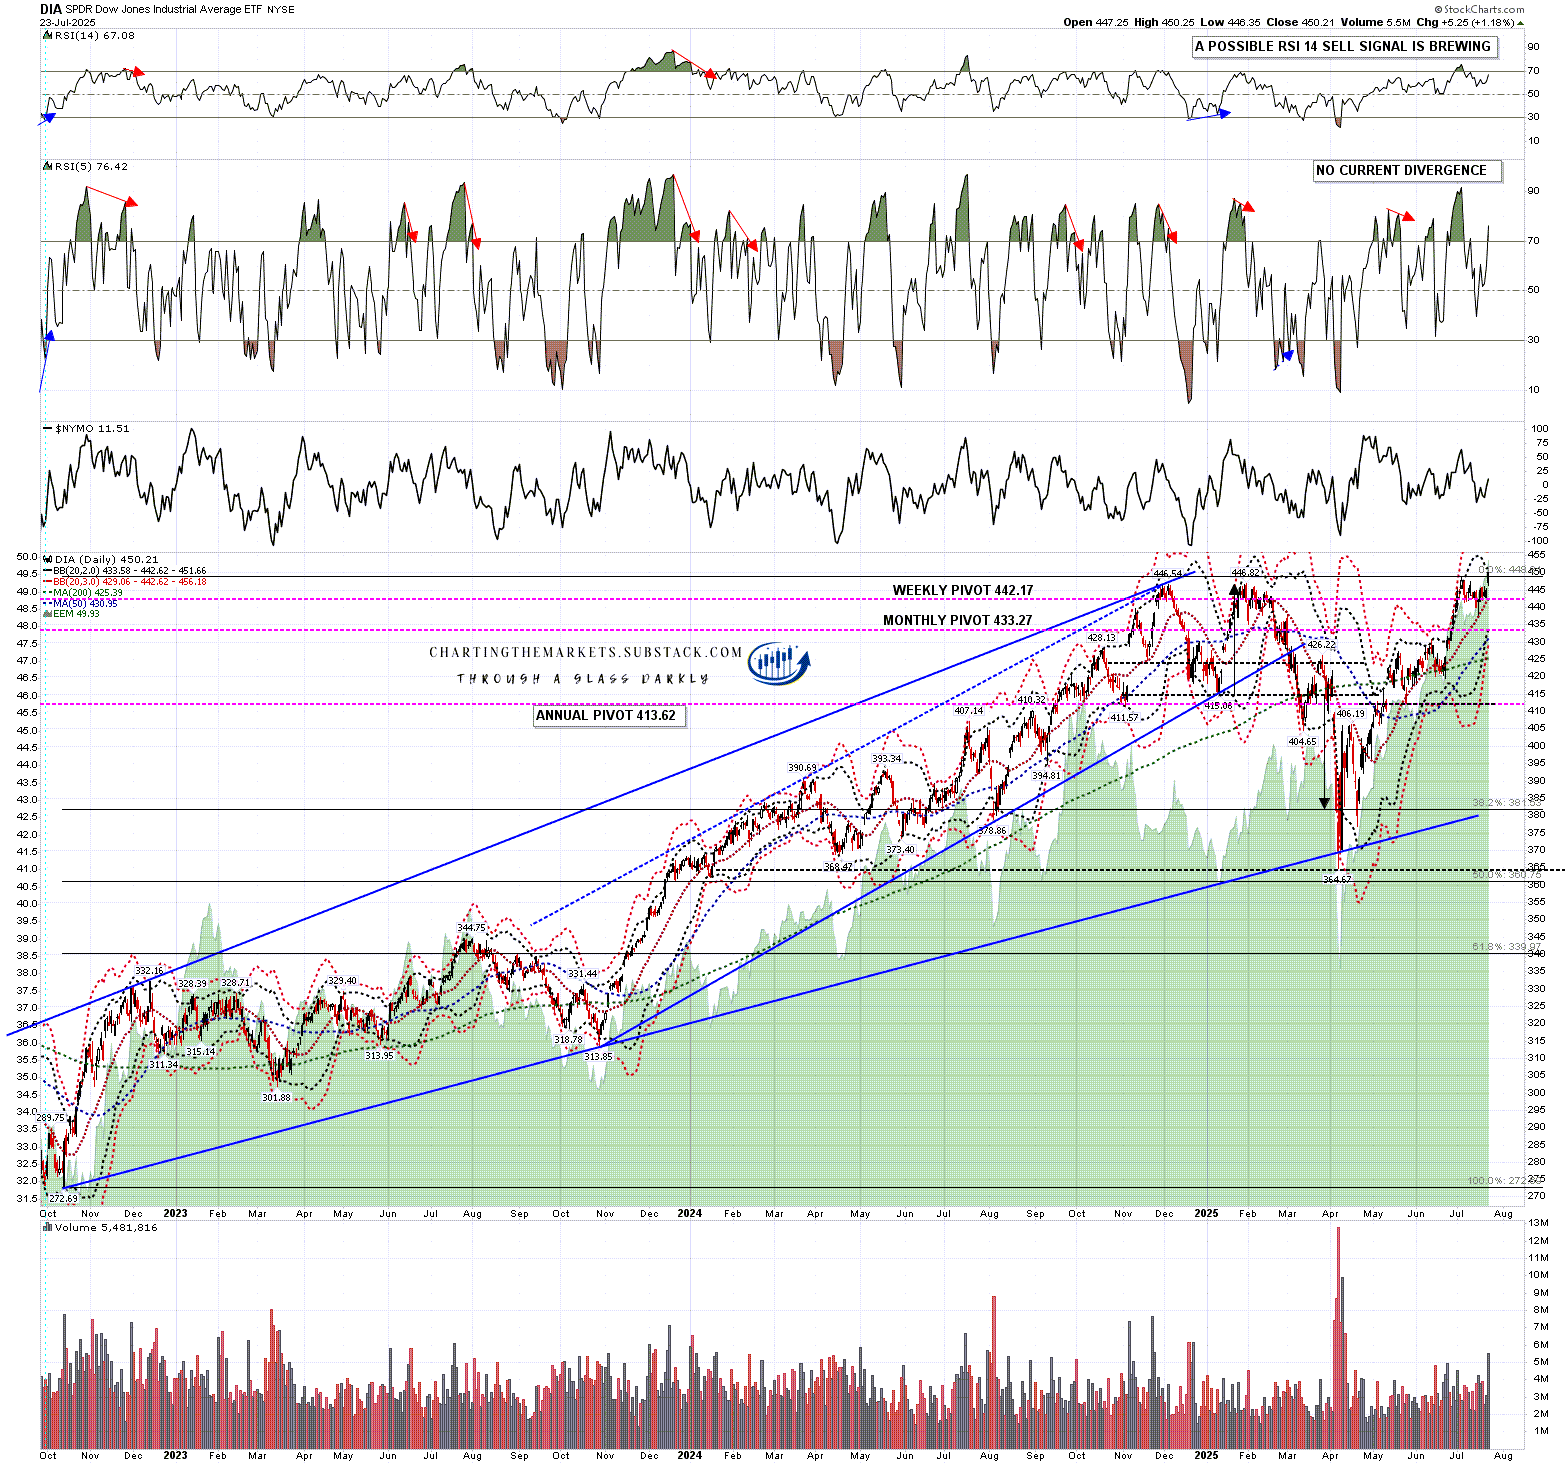
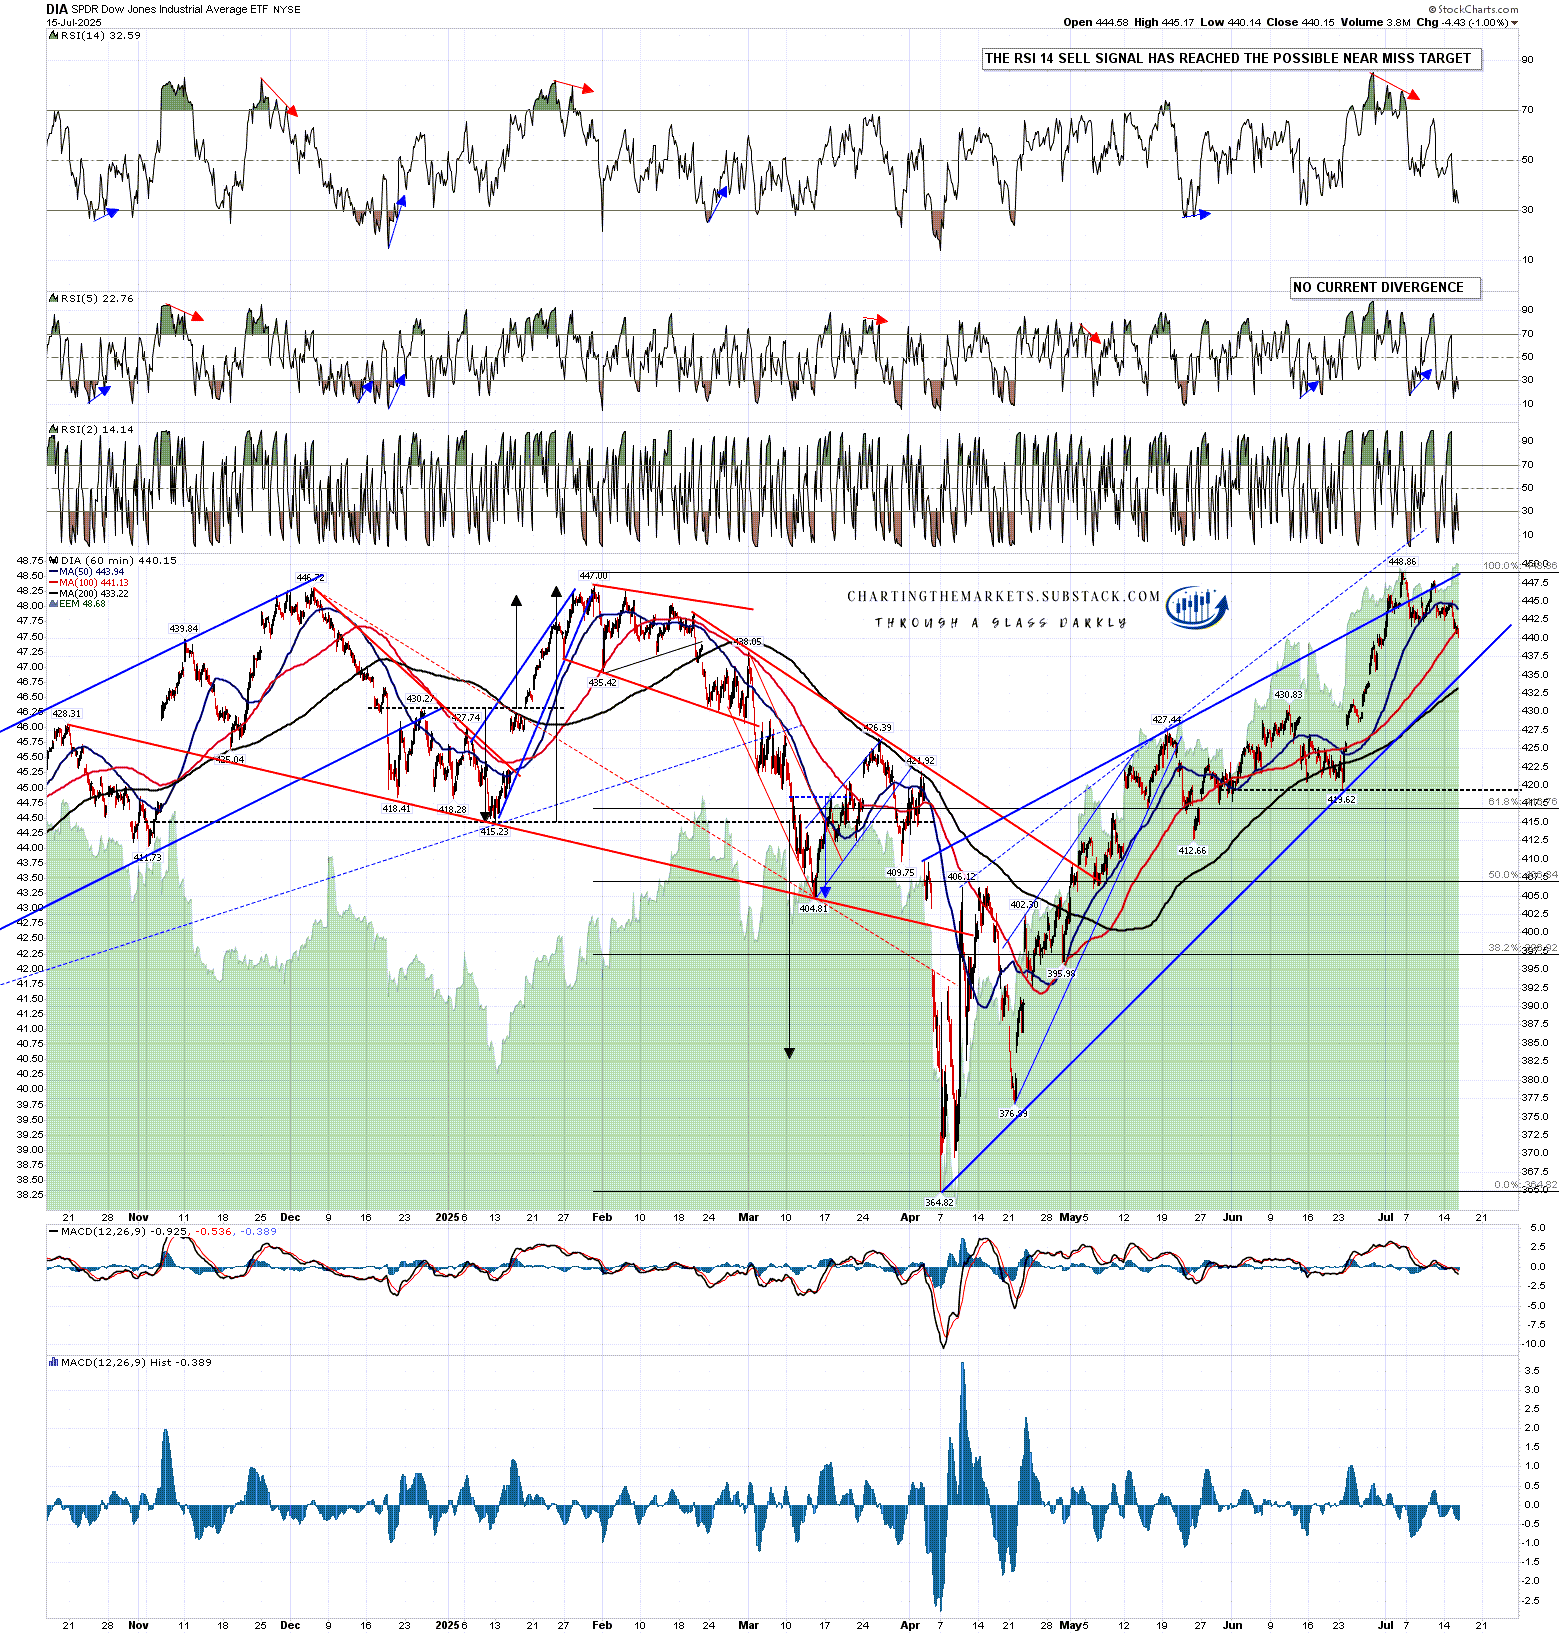
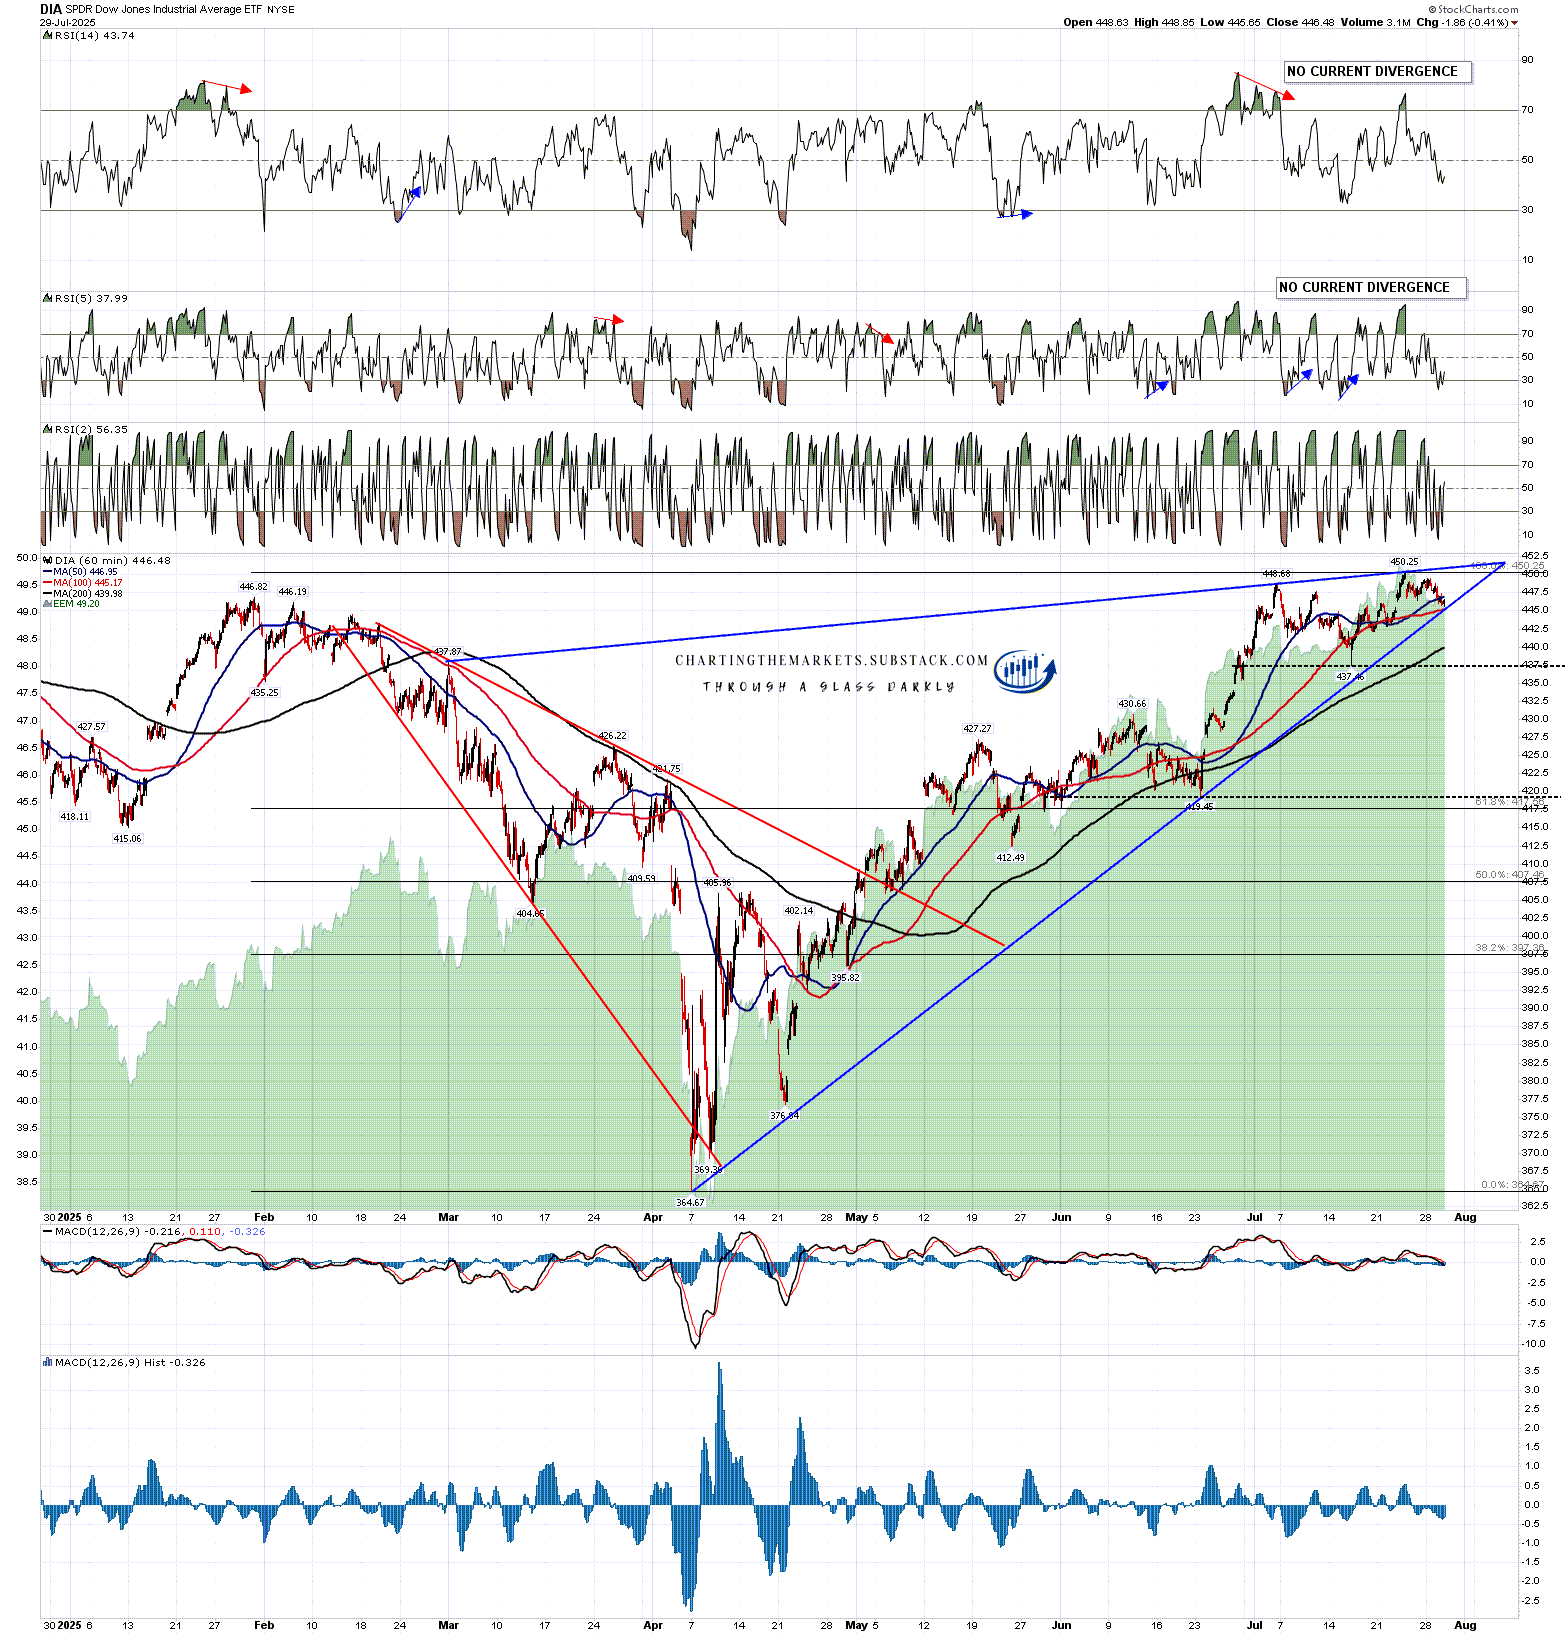
The third of those today is on DIA where there is a lovely three touch resistance trendline established at the last high coming from the late February rally high. This rising wedge has not yet broken down but delivered a third touch on wedge support at the low yesterday.

DIA 60min chart:

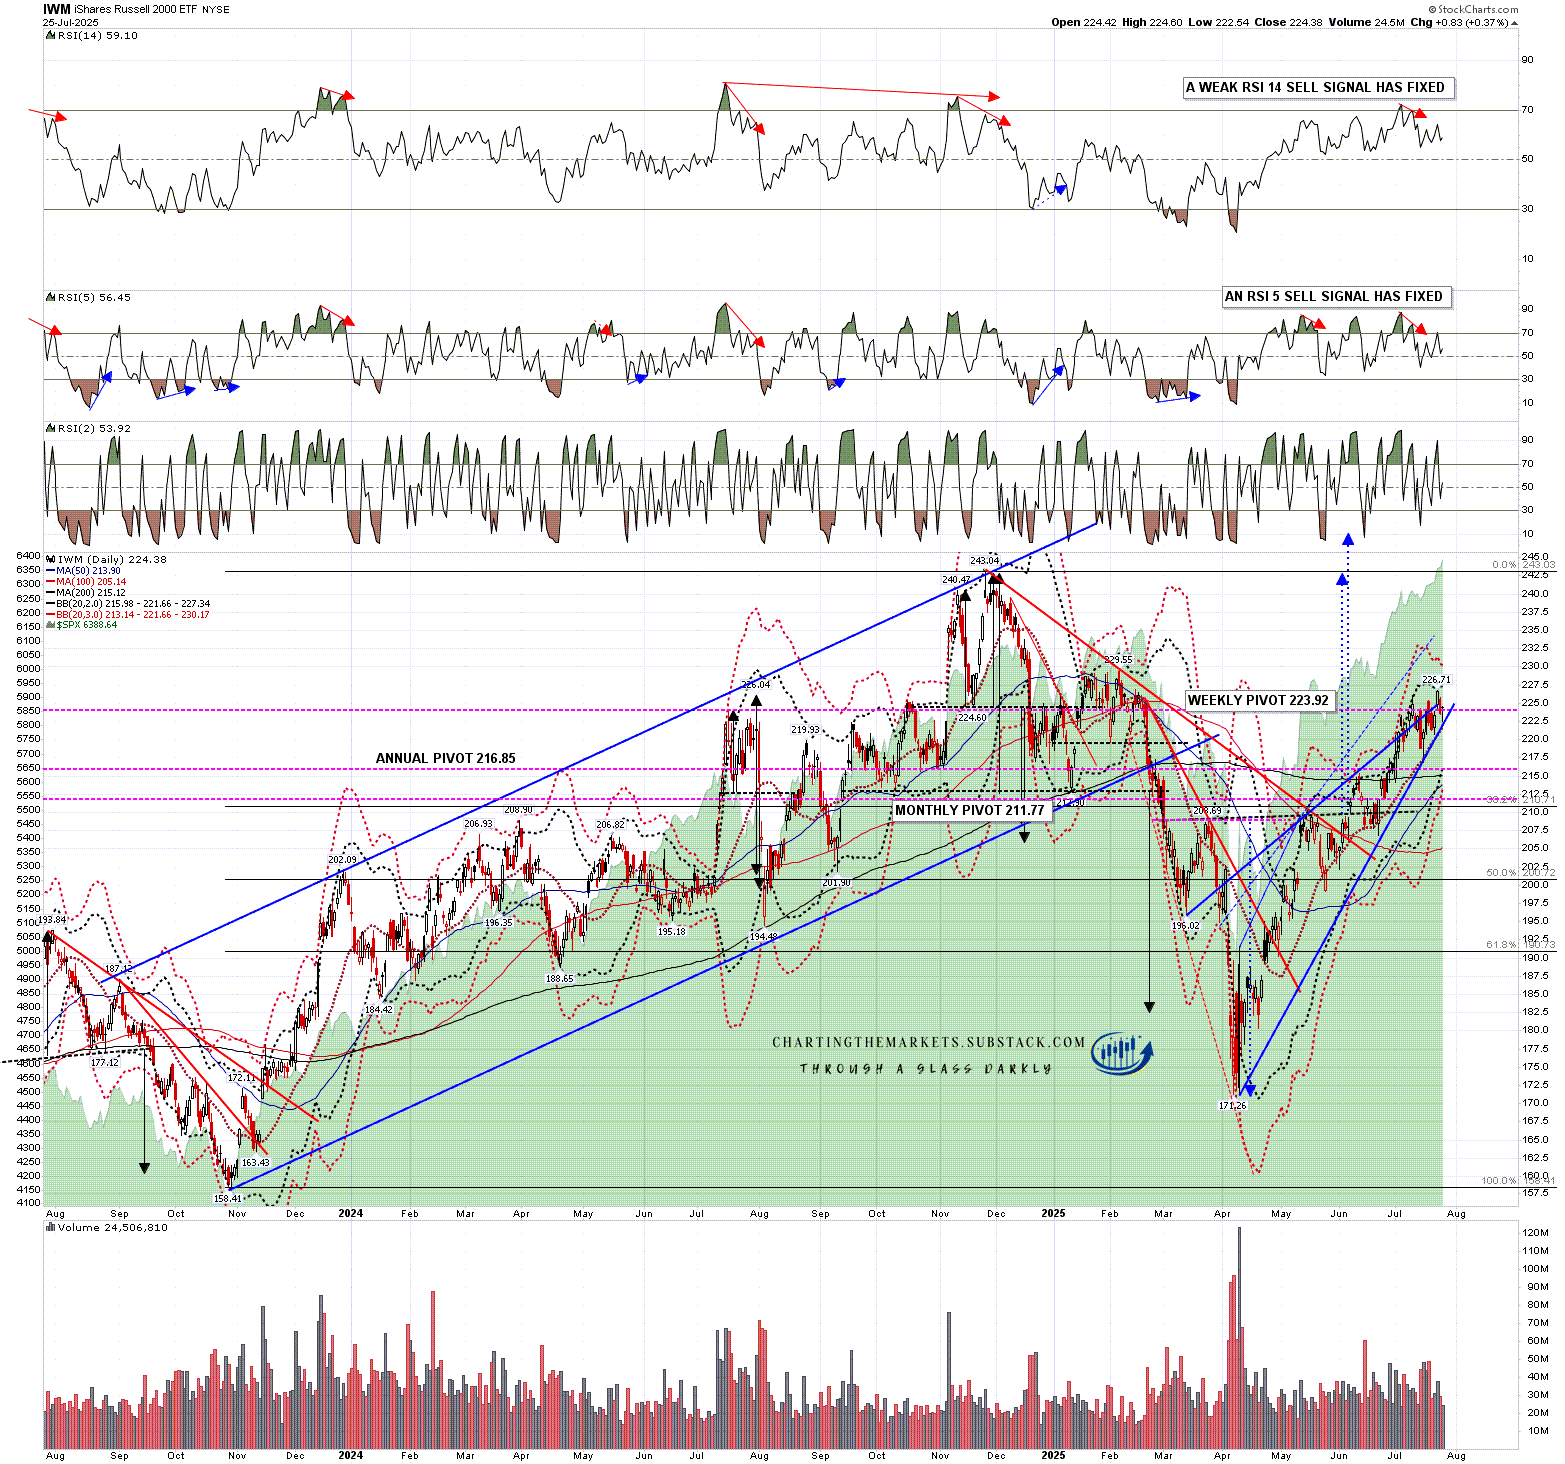
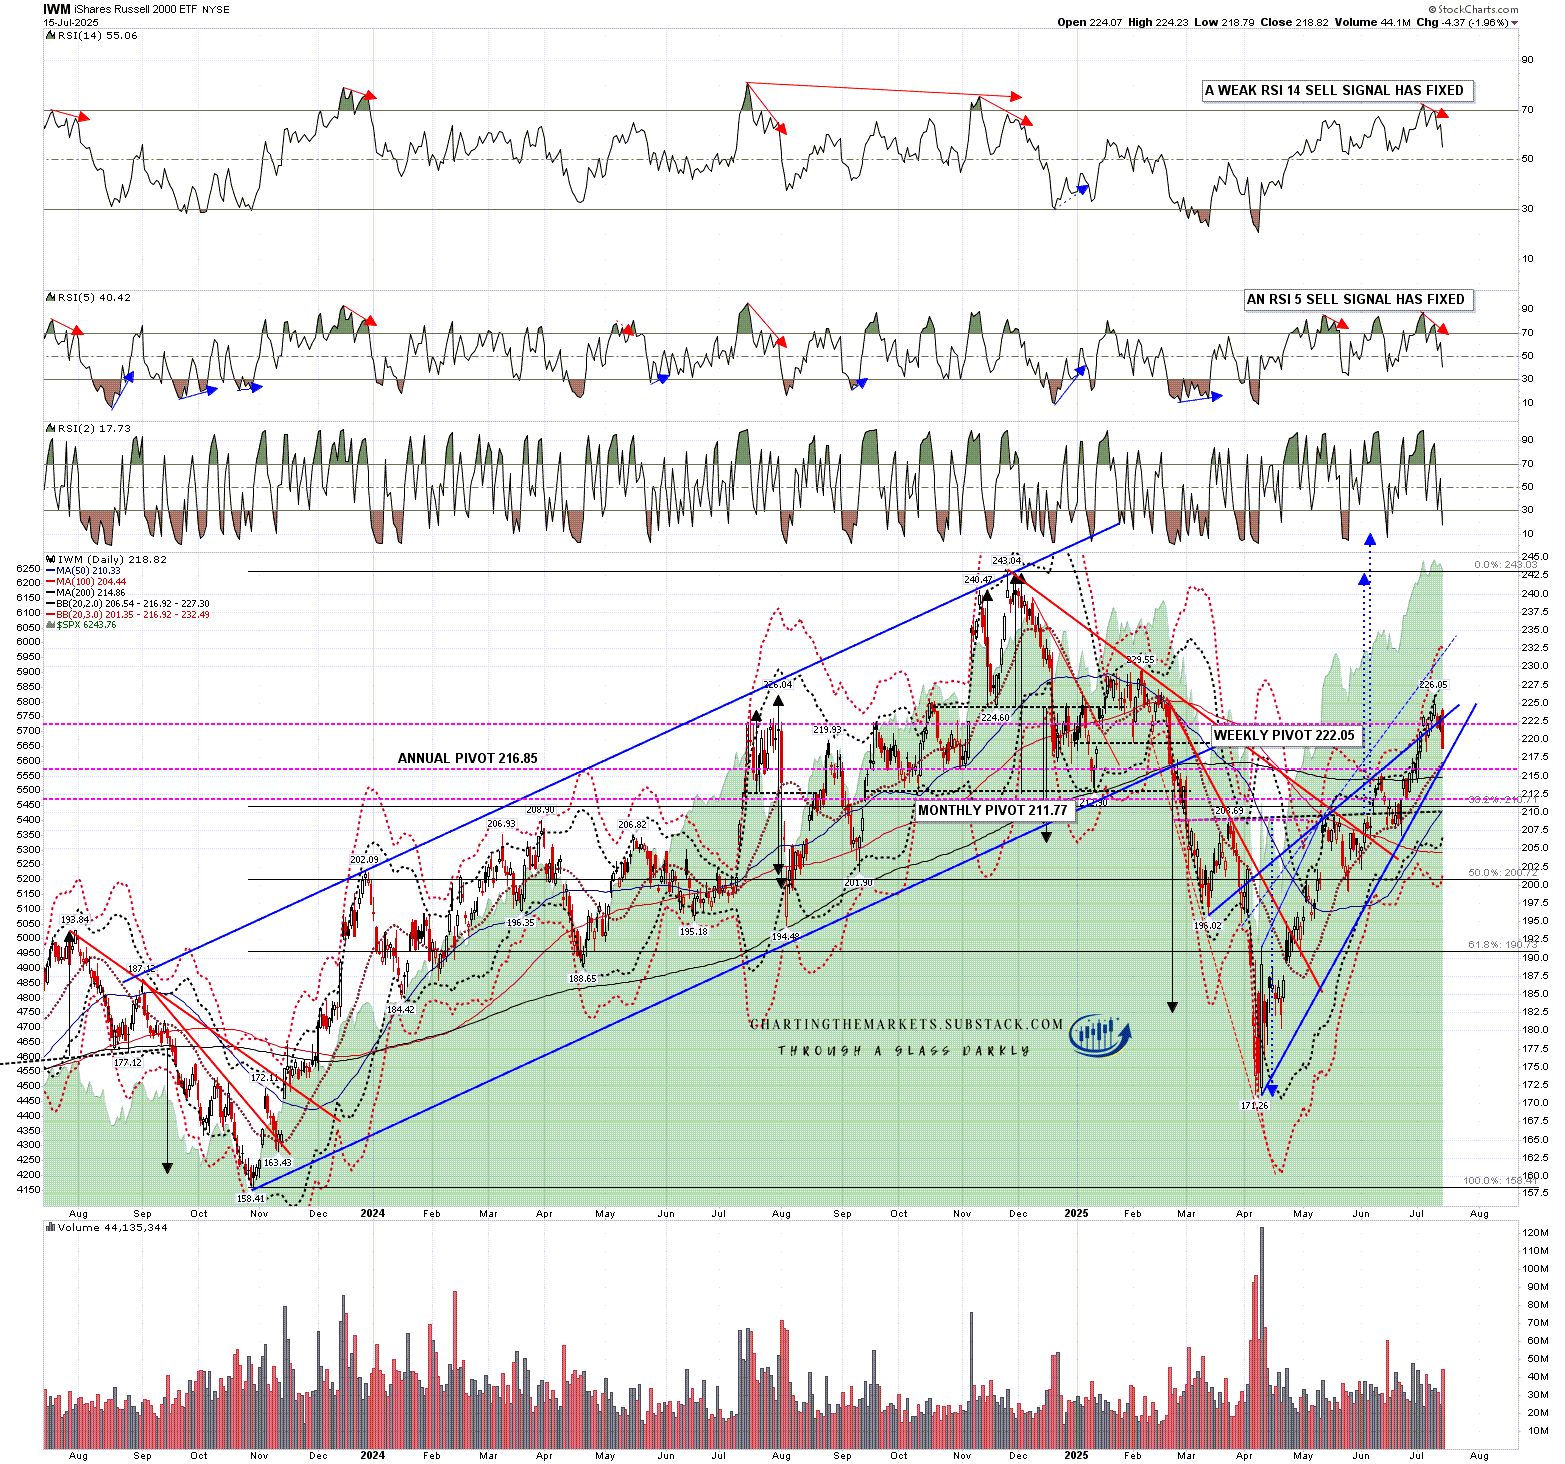
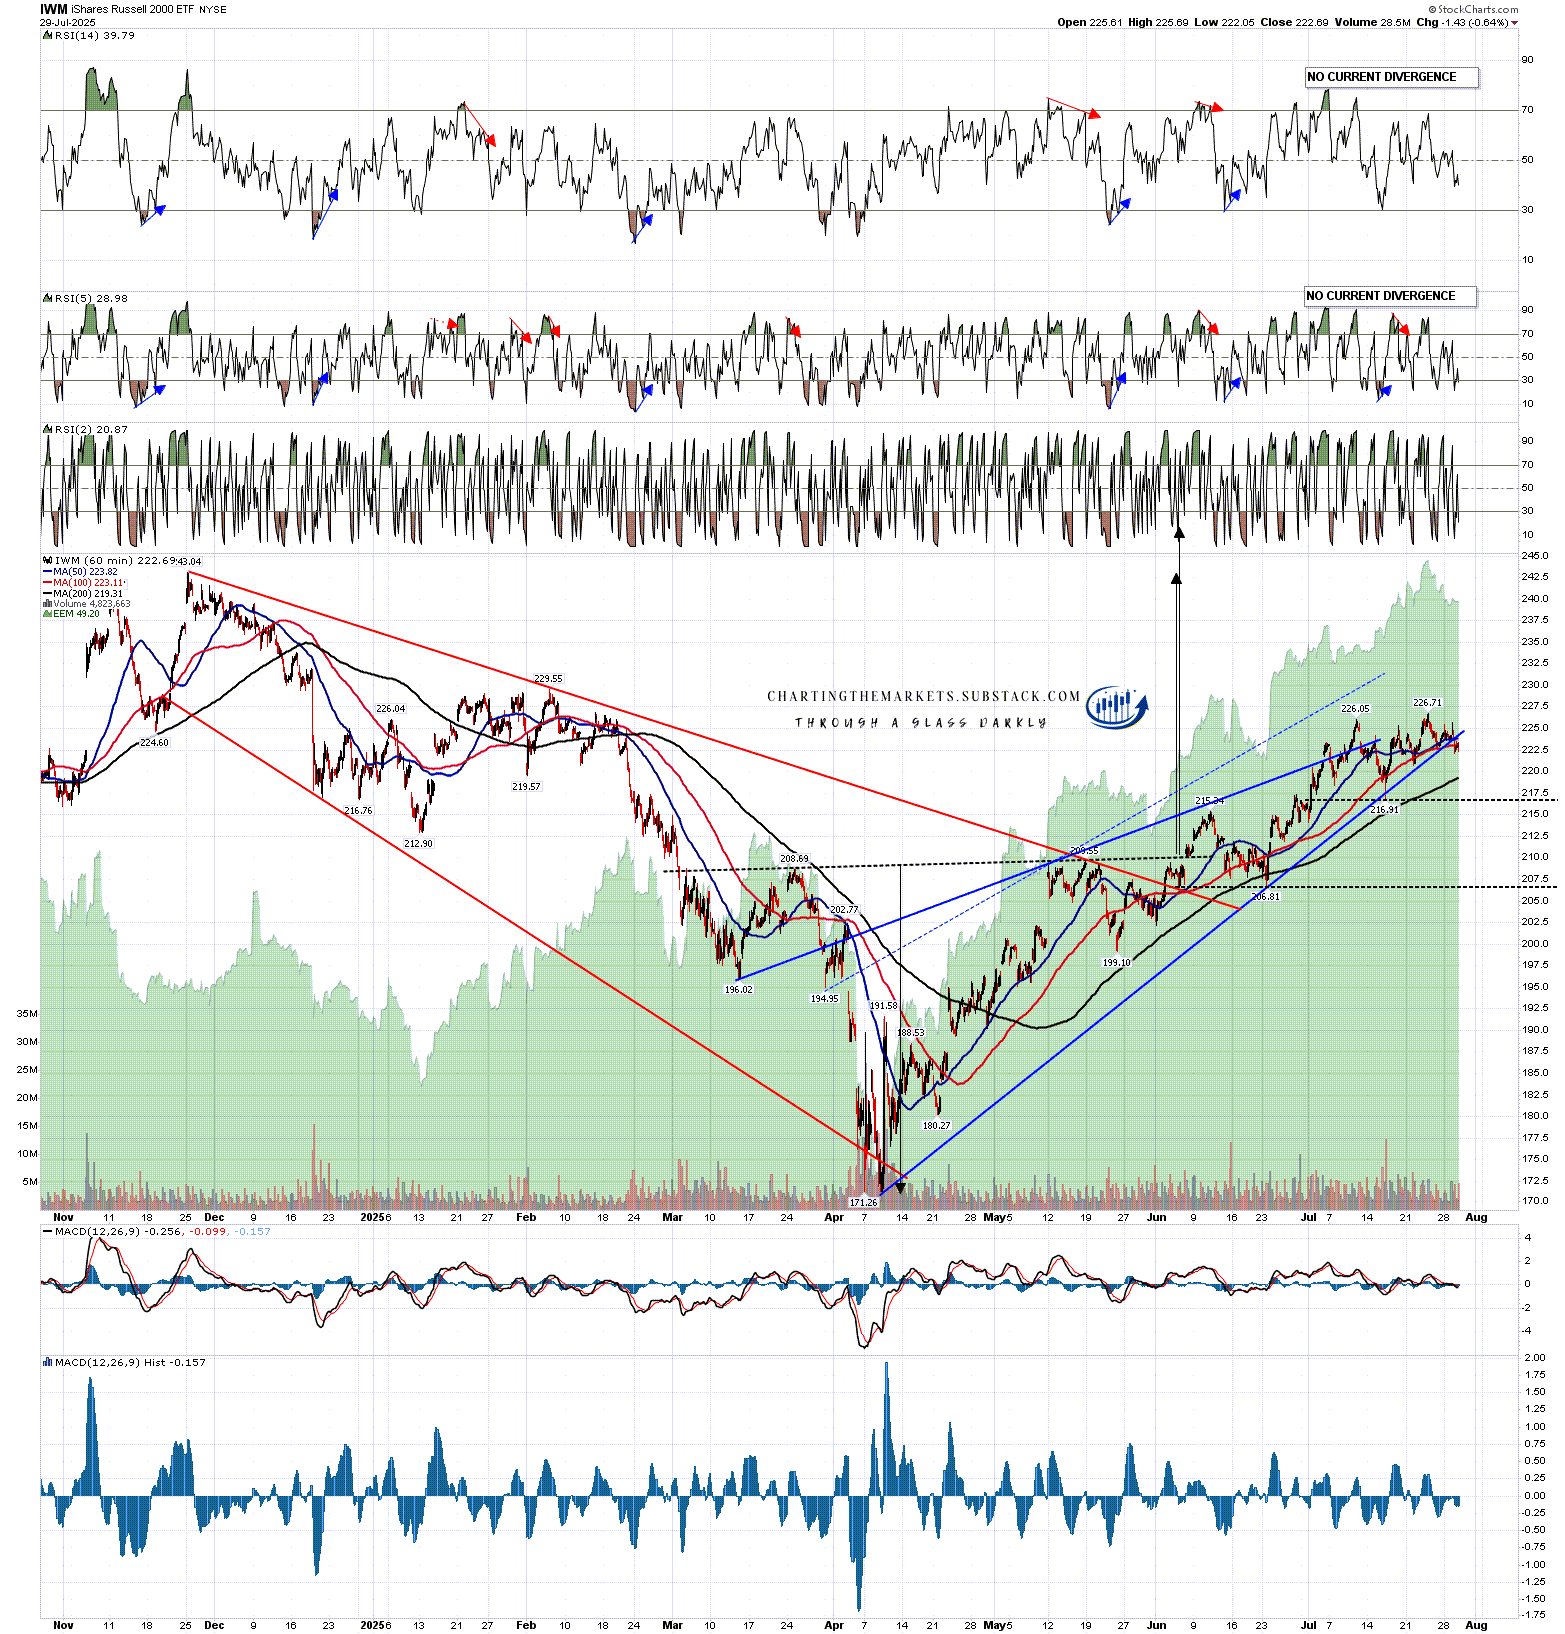
IWM has not done the same, but as is often the case, has been ploughing its own technical furrow. There the original rising wedge broke down slightly a few days ago and has retested the high setting up a high quality little double top.

IWM 60min chart:

What does this mean? It means that we are looking here at another inflection point where we are looking at a possible high forming for either a decent retracement or a full reversal of this trend from the April low. Subject to news I am leaning towards the retracement option.

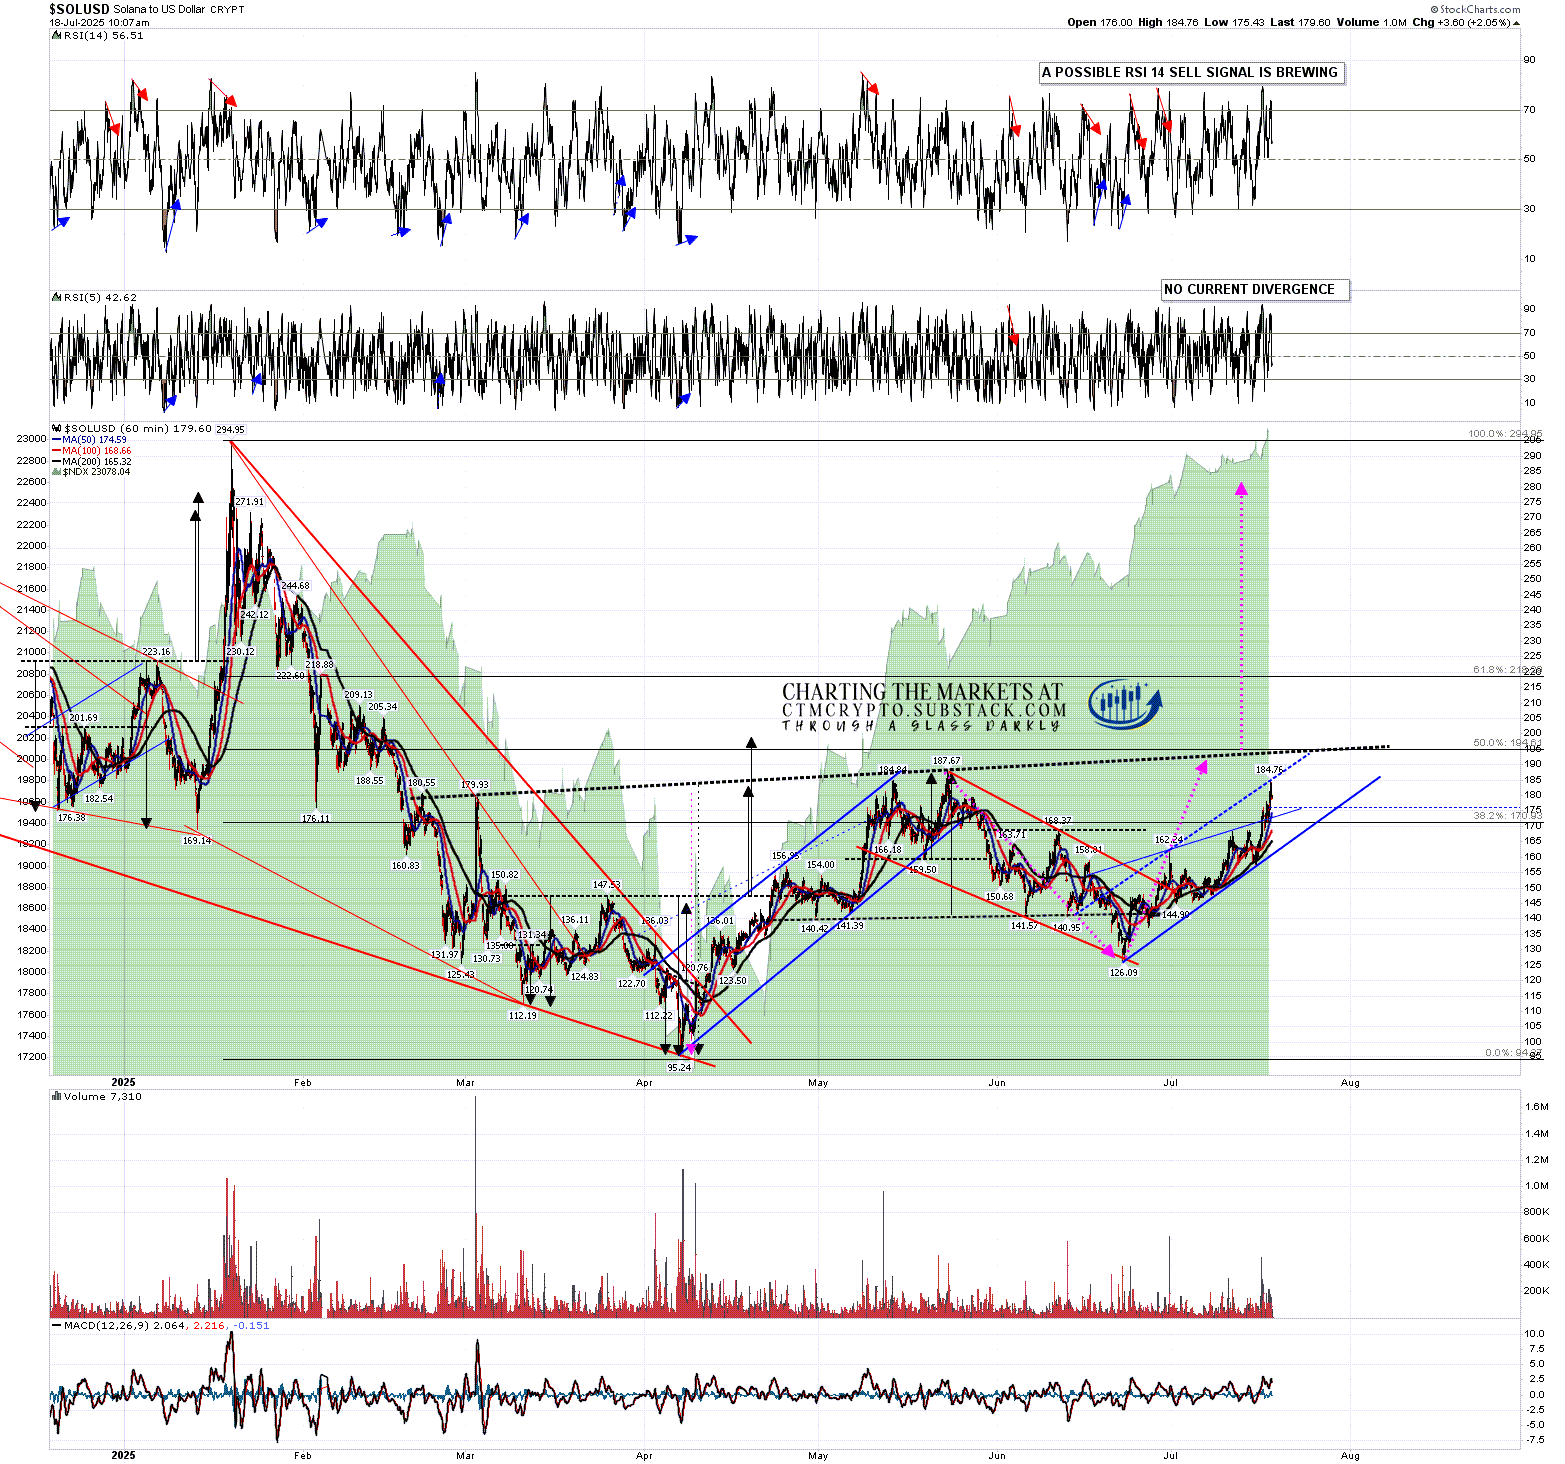
In terms of indicators there are hourly RSI 14 sell signals fixed and still waiting to deliver on both SPX and QQQ and, on the daily charts, there is a fixed RSI 5 sell signal on QQQ, a fixed weak RSI 14 sell signal on IWM as well as a fixed full RSI 5 sell signal, and a possible RSI 14 sell signal is brewing on DIA. That is a lot of negative divergence.

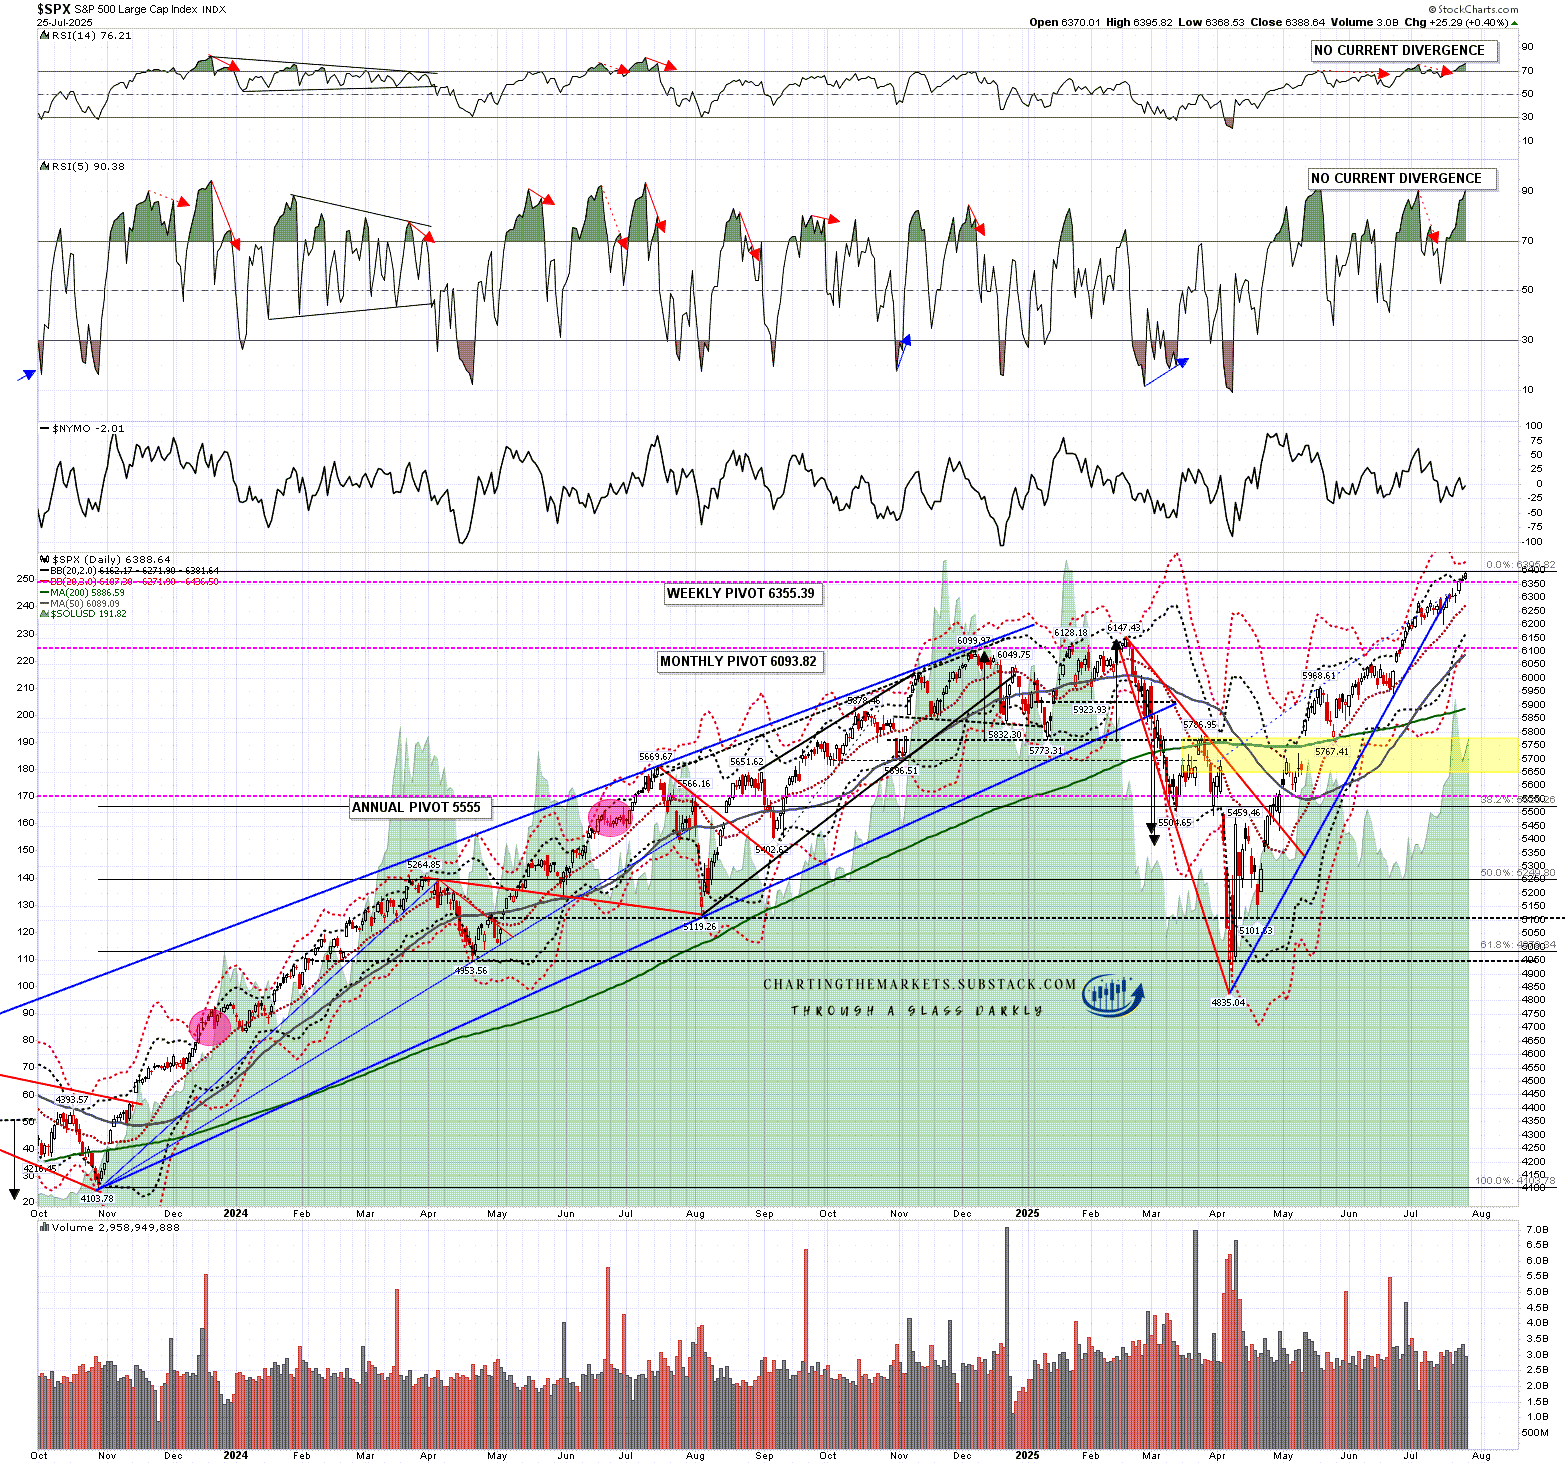
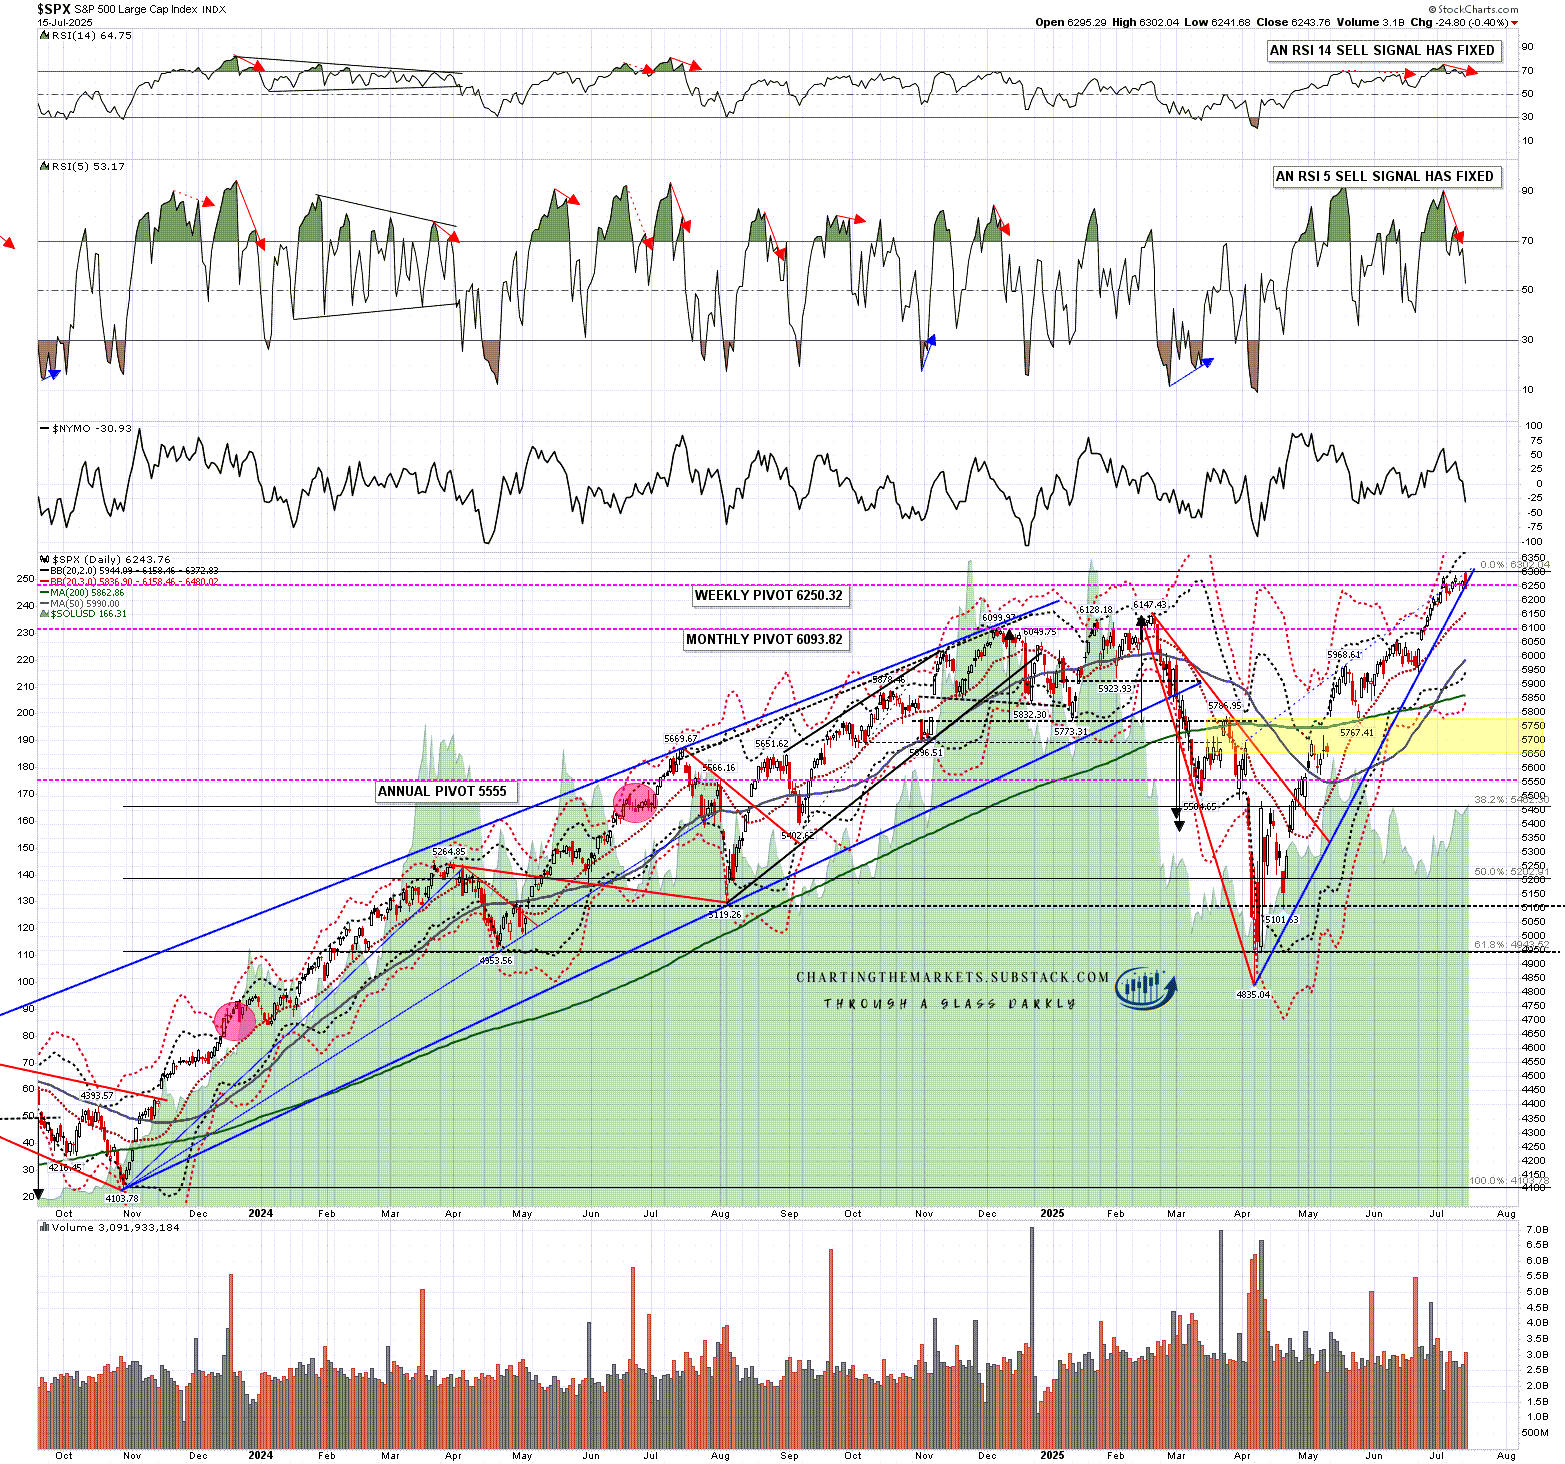
On SPX the sell signals were the same as on IWM until they both failed at the close last Friday. This regularly happens just before a reversal and that is possible here.

SPX daily chart:

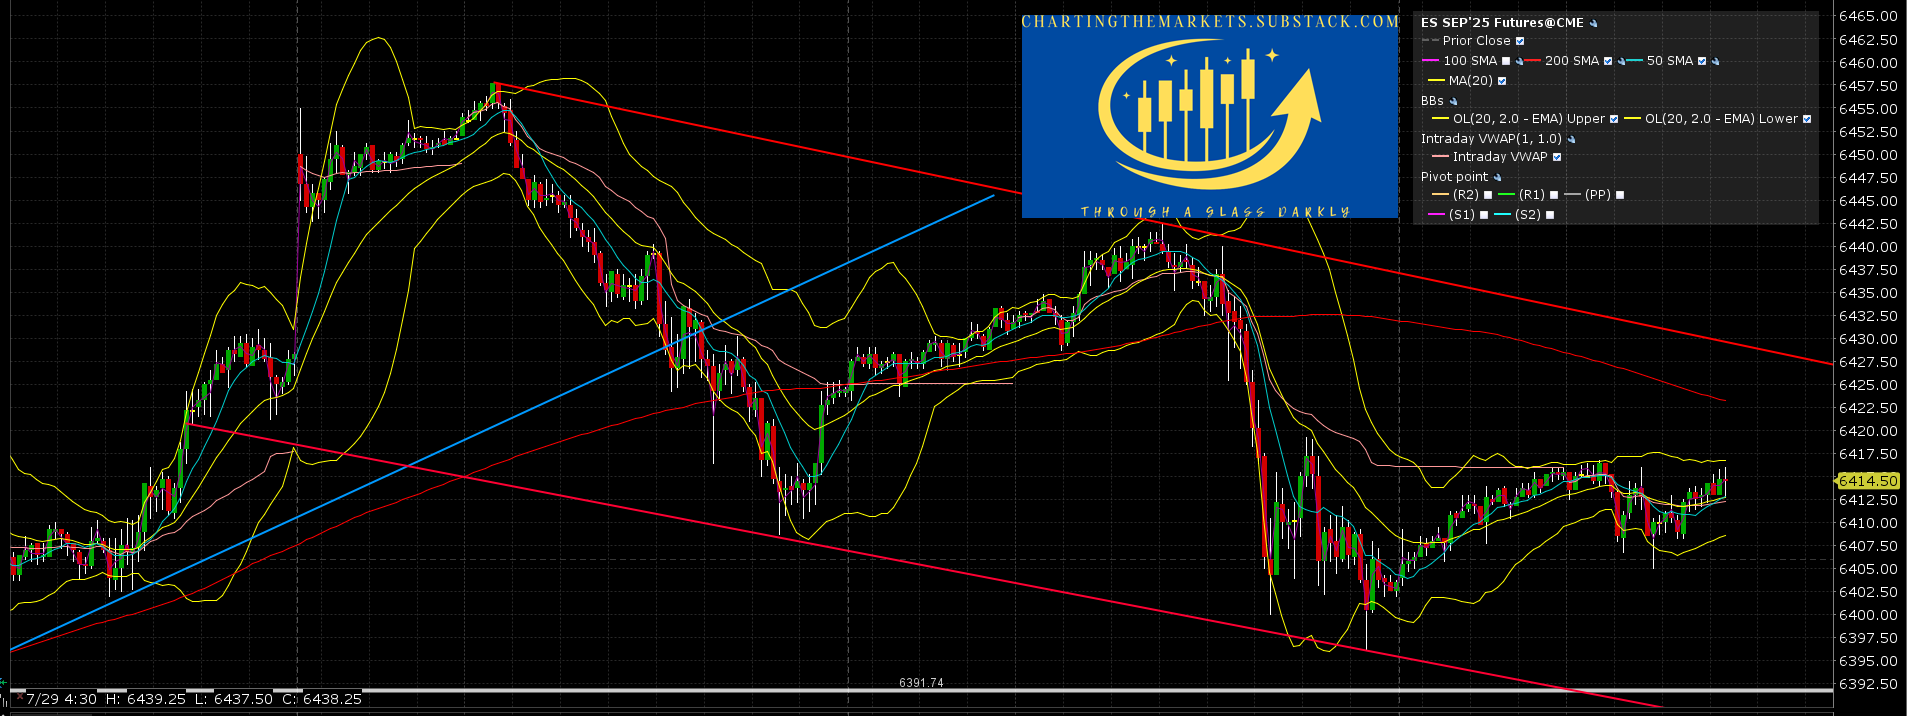
I think that it is more likely here though that we see another high retest shortly on SPX and that sets up new daily negative divergence on SPX and ES. A very promising looking bull flag setup has formed on the ES 15min chart over the last couple of days supporting that view.

ES Sep 15min chart:

This is a really nice setup for at least a short term high forming here and this would be a good time to see a retracement. There is a bullish leaning day today but after that the next bullish leaning day historically is on 15th August. There is also a lot of economic data coming through this week with second quarter GDP and ADP private payrolls today, PCE inflation tomorrow and the July jobs report on Friday which, despite being the first trading day of August, leans significantly bearish historically.

I don’t often get the opportunity to post beautiful chart setup posts like this but they are generally very well worth paying attention to. The last one I posted was the topping patterns that had formed on all four of the indices above in my post on 19th February this year and I’d note that those all played out. This inflection point may not deliver anything as large, but it is potentially very significant. I’m watching this setup form closely.

If you like my analysis and would like to see more, please take a free subscription at my chartingthemarkets substack, where I publish these posts first. I also do a premarket video every day on equity indices, bonds, currencies, energies, precious commodities and other commodities at 8.45am EST, but only for paying subscribers. Other places to find me are my twitter, and my Youtube channel.

Monday, 28 July 2025

A New Normal on Trade?

In my last post on Thursday 24th July I was talking about the inflection point forming here on equities and the two important possible triggers this week. The first of those was the trade deal being negotiated with the EU and that seems to have been agreed over the weekend, at a general level of 15%. This follows a similar agreement with Japan and means that trade deals in that kind of area have been agreed now with most of the largest US trading partners except China, Canada and Mexico, currently at higher levels.

This could be establishing a new normal on trade so I wanted to take a moment to review where this may be leaving us.

The chart below shows US tariff rates 1890-2025 and has tariff rates this year settling in the 14.5% area. Historically the closest equivalent is the increased tariffs imposed in the Fordney McCumber Act in 1922 that raised tariffs into the 15.2% area but didn’t greatly restrict trade in the 1920s, though it would be reasonable to expect that if these tariffs are sustained then imports into the US will decline in coming years, and exports from the US may well decline with them as foreign markets become somewhat more hostile to US exports in response:

In fiscal terms the impact of tariffs has been disregarded by the CBO as it is not based on any US legislation so far, but in 2024 the total value of US imported goods and services was about $4.1 trillion. An average 14.5% tariff level would yield about $595bn at the 2024 level of imports, so it would be reasonable to think that these tariffs should yield $500bn or more annually in tax revenue.

This does improve the fiscal situation in the US and while these tariffs are sustained, should likely significantly more than cancel out the negative fiscal impact of the ‘big beautiful bill’, without greatly improving the overall deficit and debt situation.

Tariffs are always paid by the importer of course so the tariffs will be paid by US importers and consumers, in effect a consumption tax, though the impact may be reduced somewhat by foreign companies eating some of the tariffs. This is the largest tax increase on US consumers in many years and will reduce their spending power, which will likely have a negative effect on economic growth.

In terms of inflation imported goods will be more expensive, though the impact on inflation will be moderated to an extent, perhaps a third, by foreign exporters and US importers also eating some of the tariffs at the expense of profits. The increase may also be a one-off increase that doesn’t feed through into future inflation though, while that increase is feeding through, the prospects for interest rate cuts will be reduced and the possibility of interest rate rises increased.

Overall though the impact, if tariffs settle down in this area, may be modest both for US debt (somewhat improved) and US growth (somewhat reduced). This reduces the probabilities for a major shock to the system for equity markets though US corporate profits will likely be reduced overall, something that we have already been seeing.

Moving onto the equity markets the daily close on Friday failed both of the fixed RSI 14 and RSI 5 sell signals on SPX. This is something often seen in a strongly trending markets and leans cautiously bullish.

SPX daily chart:

I would say though that while SPX and NDX may be trending higher here, both DIA and IWM have formed very decent looking possible double tops.

DIA daily chart:

The IWM chart is perhaps the most important here as a high quality IHS formed and broke up with a target at a retest of the all time high at 243.04. On a sustained break higher that would be the obvious target. On a hard fail here that broke the IHS right shoulder low at 199.10 however, the obvious next target would be a retest of the April low at 171.26.

IWM daily chart:

We still have an important legal ruling this week on the legality of Trump’s tariffs but whichever way that goes I wouldn’t expect much of a negative reaction on US markets. If they are ruled illegal that I think there are decent odds that the currently agreed tariffs could be resurrected in legislation implemented in the traditional way through Congress.

In my post on Tuesday 3rd June I was looking at a possible break up towards higher targets on SPX and NDX and if equities break up at this inflection point the obvious upside target on NDX would be the resistance trendline on the chart below, currently in the 24,500 area.

NDX weekly chart:

If equities break up at this inflection point the obvious upside target on SPX would be the resistance trendline on the chart below, currently in the 6500 area.

SPX weekly chart:

What would I like to see happen from here? Ideally I’d likely to see equities slowly grind up into the end of the year and form a larger high there. I’m thinking this trade deal with the EU might help deliver that. We’ll see.

I’ve been saying the following on all my posts so far this year:

As I have been since the start of 2025 I’m still leaning on the bigger picture towards a weak first half of 2025 and new all time highs later in the year, very possibly as a topping process for a much more significant high. One way or another I think we’ll be seeing lower soon and I’m not expecting this to be a good year for US equities, not least because both of the last two years have been banner years for US equities. A third straight year of these kinds of gains looks like a big stretch. I could of course however be mistaken. UPDATE 16th July 2025 - We may now be completing the initial strong decline and then the new all time highs I projected for this year, and making the more significant high I was projecting that process might deliver.

If you like my analysis and would like to see more, please take a free subscription at my chartingthemarkets substack, where I publish these posts first. I also do a premarket video every day on equity indices, bonds, currencies, energies, precious commodities and other commodities at 8.45am EST, but only for paying subscribers. Other places to find me are my twitter, and my Youtube channel.

Thursday, 24 July 2025

An Inflection Point Forms

In my last post on 16th July I was looking at a significant high that may be forming here on equities. There was some unfinished business that I was looking to finish on the upside and one of those was a high retest on DIA which we saw yesterday and there is now a daily RSI 14 sell signal brewing on DIA to go with the daily sell signals already fixed on SPX, QQQ and IWM.

I went through a more thorough list of the unfinished business both finished and remaining on my The Bigger Picture video yesterday night but in brief I was looking on my premarket videos over the last few days for high retests on DIA and Nikkei, which we saw yesterday, a full all time high retest on INDU, not quite seen yesterday but close, and high retests on DAX and ESTX50, both of which have formed bull flags which have broken up but not yet made target.

I have also been looking for a possible topping setup to form on Crypto, which I ran through on last night’s video. I also covered that in a post on Tuesday. That too is forming as expected.

Altogether I’m thinking that we reach this inflection point in the next few days, likely next week, and that may well coincide with the legal ruling on the legality on Trump’s tariffs that is currently scheduled for the end of July. At the inflection point equities should either deliver at least a strong retracement, as I was looking at last week, or a break up towards the higher targets on SPX and QQQ that I was looking at in my post on Tuesday 3rd June.

On the DIA daily chart the high has been retested and a daily RSI 14 sell signal is now brewing.

DIA daily chart:

DIA needs to go just a little higher to deliver the retest of the all time high on INDU, which was very close at yesterday’s highs.

INDU weekly chart:

A bull flag has formed and broken up on the DAX hourly chart. That should deliver another all time high retest there:

DAX daily chart:

If equities break up at this inflection point the obvious upside target on NDX would be the resistance trendline on the chart below, currently in the 24,500 area.

NDX weekly chart:

If equities break up at this inflection point the obvious upside target on SPX would be the resistance trendline on the chart below, currently in the 6500 area.

SPX weekly chart:

Trump has now made a deal on tariffs with Japan and appears to be close to another with the EU. If the tariffs are ruled illegal that would likely be positive for equities, if not then a deal with the EU would also likely be positive. I’m doubtful about the larger economic backdrop but either could deliver those higher targets. We’ll see.

I’ve been saying the following on all my posts so far this year:

As I have been since the start of 2025 I’m still leaning on the bigger picture towards a weak first half of 2025 and new all time highs later in the year, very possibly as a topping process for a much more significant high. One way or another I think we’ll be seeing lower soon and I’m not expecting this to be a good year for US equities, not least because both of the last two years have been banner years for US equities. A third straight year of these kinds of gains looks like a big stretch. I could of course however be mistaken. UPDATE 16th July 2025 - We may now be completing the initial strong decline and then the new all time highs I projected for this year, and making the more significant high I was projecting that process might deliver.

If you like my analysis and would like to see more, please take a free subscription at my chartingthemarkets substack, where I publish these posts first. I also do a premarket video every day on equity indices, bonds, currencies, energies, precious commodities and other commodities at 8.45am EST, but only for paying subscribers. Other places to find me are my twitter, and my Youtube channel.

Tuesday, 22 July 2025

The IHS on Solana Breaks Up

Back in my post on 11th April I called the likely start of a strong rally which we then saw.

Back in my post on 12th May I called for new all time highs on Bitcoin (BTCUSD) and laid out possible IHS scenarios on both Solana (SOLUSD) and Ethereum (ETHUSD), looking for ideal right shoulder lows on Solana in the 125.43 area and on Ethereum in the 2074.27 area. That hasn’t gone quite as I drew then but essentially both are still running that scenario.

Back in my post on 23rd June I called the likely lows on those right shoulders made on Solana at 126.09 and on Ethereum at 2113.65, and was looking for that IHS scenario on both to start to play out.

In my last post on 18th July I was looking at the IHS that had since broken up on Ethereum and the progress made towards the IHS neckline on Solana.

On my daily premarket videos I’ve been raising the possibility that the Solana IHS might fail hard after breaking up and, with that IHS having now broken up, I want to look at that possibility today.

First though we have seen Bitcoin consolidating in recent days as Ethereum and Solana have been powering higher. That’s not too surprising as the big declines on Ethereum and Solana this year also happened without much reaction on Bitcoin.

On the Bitcoin daily chart I’m seeing this as a bullish consolidation, which should likely deliver a retest of the all time high in due course. If seen now that would set possible RSI 14 and RSI 5 sell signals brewing. If Bitcoin goes a bit lower first then the retest would likely still set a possible RSI 14 sell signal brewing.

BTCUSD daily chart:

On the hourly chart there is a high quality rising wedge which has formed since the April low. The next obvious target within the wedge is rising wedge support, currently in the 107.5k area, but I would note that a common way to reach that target from here would be to retest the current all time high, setting up the second high of a small double top, and then break down from that double top towards a target (based on the current ATH) in the 108.3k area.

BTCUSD 60min chart:

Looking at the Ethereum daily chart, both RSI 14 and RSI 5 have reached levels higher than anything seen in the last three years. The IHS target is at a retest of the last 2025 high at 4109.05 and Ethereum has now come close enough to that target that I would be surprised if that target is not reached before this current wave up ends.

ETHUSD daily chart:

Looking at the hourly chart Ethereum has reached the obvious resistance trendline I showed in my post last week, and is so far finding resistance there. I am thinking we might see some bullish consolidation here that might then retest the short term high and set up some negative RSI divergence. I would also note that Ethereum could reach that IHS target at 4109.05 under that resistance trendline by mid-August.

ETHUSD 60min chart:

On the Solana daily chart RSI 14 and RSI 5 have now also both reached levels not seen in the last three years. The IHS on Solana has now also broken up with a target in the 283 area, but effectively with a target at a retest of the all time high at 294.95.

This is a good setup, with my concern being that US equities might top out before it has a chance to reach that target. There remains little evidence that Crypto can sustain a strong uptrend while equities are in a significant downtrend, though that may change when there is a serious bonds crisis in the US, which seems likely in the next year or two but less likely within the next few months.

If Solana isn’t going to make that IHS target, then the most obvious place for any IHS to fail is just after it breaks up, so I’m watching this area over 200 with great interest.

If we are going to see Solana fail in this area then ideally I’d be looking for some retracement here, then a retest of this high setting up possible daily RSI sell signals, and then a hard fail.

SOLUSD daily chart:

Is there any setup to see this possible topping sequence on Solana? Yes, though I wouldn’t be that surprised to see Solana break up through it.

On the Solana 15min chart a possible rising megaphone has formed since the June IHS right shoulder low at 126.09. The megaphone resistance trendline has been slightly overthrown at the current high and a possible small double top has set up which on a sustained break below double top support at 194.19 would have a target in the 183.29 area. Depending on where those days closed that could deliver the first move down in the sequence. I’m watching this with interest.

SOLUSD 15min chart:

I posted the following note at the end of my post on 13th Jan:

My preferred scenario here is that we see a bullish consolidation either now or soon on Crypto that takes a few months and sets up the next big leg up on Crypto into a possible bull market high in late 2025.

I wrote a comment on that in my last post:

We saw the consolidation and the new bull market highs on Bitcoin so far but my concern is that we have seen very little evidence that Crypto can deliver a bullish move while equities are going down, and I am increasingly leaning towards equities topping out here and then very possibly being in a downtrend for the rest of the year. The IHS target on Ethereum here looks doable while equity indices are topping out, but I’m becoming skeptical about seeing the same on Solana. We’ll see.

There is one thing I would add to this though. If Trump imposes heavy tariffs on big trading partners in coming weeks then equities are likely topping out here. On the other hand Trump might TACO again in the face of a negative market reaction, and there is also a key court hearing at the end of July that may rule that all the tariffs Trump has so far imposed or is proposing to impose may be illegal. Nothing is yet fixed and if the uptrend on equities can continue then the next obvious big high on Crypto would be in December.

Since I started doing daily videos on Crypto early last year I’ve got Crypto direction right most of the time and more so than any other analyst anywhere that I’m aware of. I’m a very good analyst and all three of these instruments are very classical chartist friendly. I’m not much of a marketer though, and the free Crypto substack I set up last August still has less than 200 readers. I’d like to increase that readership and invite any suggestions on how I could do that.

If you’d like to see more of these posts and the other Crypto videos and information I post, please subscribe for free to my Crypto substack. I also do a premarket video every day on Crypto at 9.05am EST. If you’d like to see those I post the links every morning on my twitter, and the videos are posted shortly afterwards on my Youtube channel.

I'm also to be found at Arion Partners, though as a student rather than as a teacher. I've been charting Crypto for some years now, but am learning to trade and invest in them directly, and Arion Partners are my guide around a space that might reasonably be compared to the Wild West in one of their rougher years.


Friday, 18 July 2025

Four Calls and a Question

Back in my post on 11th April I called the likely start of a strong rally which we then saw of course.

Back in my post on 12th May I called for new all time highs on Bitcoin (BTCUSD) and laid out possible IHS scenarios on both Solana (SOLUSD) and Ethereum (ETHUSD), looking for ideal right shoulder lows on Solana in the 125.43 area and on Ethereum in the 2074.27 area. That hasn’t gone quite as I drew then but essentially both are still running that scenario.

In my last post on 23rd Jun I called the likely lows on those right shoulders made on Solana at 126.09 and on Ethereum at 2113.65, and was looking for that IHS scenario on both to start to play out.

So where are we now? Well on Bitcoin we have seen all time highs as expected. On the daily chart there is no compelling upside target but I am wondering about the resistance trendline currently in the 135-40k area. That would be a compelling upside target if the last retracement had hit the corresponding rising support trendline but that was missed.

BTCUSD daily chart:

On the Bitcoin hourly chart a high quality rising wedge has formed from the April low so may be topping out for a retracement with the obvious target at wedge support, currently in the 106.5k area. If seen, a retest of the last ATH at 123.2k would likely set daily RSI 14 and RSI 5 sell signals brewing:

Ethereum needed to convert triple resistance at the 200dma, 50dma and daily middle band to support to open the upside and, after finally doing that in early July, has spiked up hard. The IHS broke up and Ethereum is now more than halfway to the target at a retest of the retest of the 4109.05 high.

ETHUSD daily chart:

On the Ethereum chart there is a possible trendline target currently in the 3760 area. That’s a decent match with the trendlines I have on Bitcoin and Solana so I am wondering whether that might be a short term resistance area. A possible hourly RSI 14 sell signal is brewing.

ETHUSD 60min chart:

Solana has the lower quality IHS and the weakest move off the lows but finally broke and converted the key 200dma to support earlier this week and is close to a retest of the May high at 187.67.

SOLUSD daily chart:

I drew in a possible shorter term rising megaphone earlier this week and that trendline was hit overnight so I’m wondering about a possible short term high forming in this area. A possible hourly RSI 14 sell signal is brewing.

SOLUSD 60min chart:

I posted the following note at the end of my post on 13th Jan:

My preferred scenario here is that we see a bullish consolidation either now or soon on Crypto that takes a few months and sets up the next big leg up on Crypto into a possible bull market high in late 2025.

We saw the consolidation and the new bull market highs on Bitcoin so far but my concern is that we have seen very little evidence that Crypto can deliver a bullish move while equities are going down, and I am increasingly leaning towards equities topping out here and then very possibly being in a downtrend for the rest of the year. The IHS target on Ethereum here looks doable while equity indices are topping out, but I’m becoming skeptical about seeing the same on Solana. We’ll see.

I have a question for everyone reading. I’ve referenced some very nice calls this year on this post, but since I started doing daily videos on Crypto early last year I’ve got Crypto direction right most of the time and more than any other analyst anywhere that I’m aware of. I’m a very good analyst and all three of these instruments are very classical chartist friendly. I’m not much of a marketer though, and the free Crypto substack I set up last August still only has just over 150 readers.

My question is how I should increase my readership, as it appears that just putting out high quality work is not enough? I am also wondering whether I should get a side gig writing for a big Crypto exchange or website. On my published work I don’t think I’d have much trouble getting hired and that would expose my work to a much larger audience. Suggestions very welcome.

If you’d like to see more of these posts and the other Crypto videos and information I post, please subscribe for free to my Crypto substack. I also do a premarket video every day on Crypto at 9.05am EST. If you’d like to see those I post the links every morning on my twitter, and the videos are posted shortly afterwards on my Youtube channel.

I'm also to be found at Arion Partners, though as a student rather than as a teacher. I've been charting Crypto for some years now, but am learning to trade and invest in them directly, and Arion Partners are my guide around a space that might reasonably be compared to the Wild West in one of their rougher years.


Wednesday, 16 July 2025

Tariffs and TACOs

Back on Tuesday 3rd June I laid out a possible bullish scenario in which I was looking for retests of the all time highs on SPX and NDX, with follow-on targets if both ran higher, a retest of the all time high on INDU, and a possible longer shot retest of the all time high on IWM based on a large IHS. Since then we have seen all three of those new all time highs on SPX, NDX and INDU, and the IHS on IWM has broken up hard and made it slightly less than halfway to the target at a retest of that all time high.

What we haven’t seen yet is the further extension to the possible trendline targets that I was looking at on SPX into the 6450-6500 area, or on NDX into the 24000-24500 area, or the new all time high on IWM of course, but I think this rally is likely now very close to at minimum to a steep retracement and may currently be making the highest highs that we will see in 2025.

Why’s that? Well tariffs have been making a big comeback in the last few days with a new 50% tariff on copper, and letters sent to Canada, Mexico, the EU, Japan and South Korea scheduling tariffs over 30% to start on August 1st. This is dashing previous hopes that the Trump administration might just leave tariffs at a basic rate of 10% with a few other higher tariffs on steel, aluminium, vehicles and so on. Not to put too fine a point on it there is little doubt historically that both tariffs and uncertainty are bad for economic growth and, if sustained, the return of the tariffs drama is not likely to be good for the US economy.

These could all be negotiated away or delayed before August 1st of course but I think that is looking less likely because Trump is aware of the TACO meme, and after the April tariff pause and his embarrassing showing negotiating with Putin so far this year, may be feeling that his ability to be tough in a negotiation needs to be demonstrated, and additionally because he’s very keen for everyone to be interested in anything other than the Epstein Files, and likely that will remain the case for a while.

The pattern and divergence setups here across the US indices and many top US stocks are also signalling that a significant high is likely close and that could be either a very significant high leading to lower lows for 2025 or at minimum deliver a stronger retracement than we have seen since the April low.

The rising wedge on SPX from the April low is a beauty, and started to break down slightly yesterday. This break down likely puts SPX into a topping process. An hourly RSI 14 sell signal has fixed which I am expecting to reach target, though we could see another high retest first:

SPX 60min chart:

On the daily chart RSI 14 and RSI 5 sell signals fixed yesterday, so on the next retracement I’d be looking ideally for a retracement low in the 5750 or 5500 areas, and if a larger topping pattern forms via either of those, then we might well see a full retracement back into the April low at 4835.04. I would note that the April low is also possible double top support that on a strong break would look for a target in the 3400-3500 area.

SPX daily chart:

On the Qs the rising wedge is also of very high quality, overthrew slightly at the high and is starting to break down. On the daily chart (not shown) an RSI 5 sell signal has already fixed and a weak RSI 14 sell signal is brewing. This also looks very bearish. An hourly RSI 14 sell signal has fixed which I am expecting to reach target, though we could see another high retest first.

QQQ 60min chart:

The rising wedges from the April low aren’t as nice on DIA and IWM but are still decent quality. The wedge on DIA has overthrown bearishly but DIA is the only one of these four US indices not currently showing daily negative divergence. That could be fixed with another high retest which would likely set both RSI 14 and RSI 5 sell signals brewing on the daily chart.

In the shorter term an hourly RSI 14 sell signal has fixed and reached the possible near miss target yesterday.

DIA 60min chart:

Daily RSI 14 and RSI 5 sell signals fixed on the IWM chart a few days ago and IWM has been the weakest index since. In my view that seems likely to continue as IWM is the most vulnerable to higher interest rates and inflation, both of which have become more likely with the recent passing of Trump’s tax and spending bill and the return of tariffs.

This also calls into serious question the centrepiece of the bullish case on equities here, which is the big IHS on IWM that I was writing about in my post on Tuesday 3rd June. If this IHS fails then the next obvious target would be a return to the April lows.

IWM daily chart:

Subject to how the tariff situation develops my working assumption is now that all the US indices may well be topping out for 2025 and that we will likely soon see at least a strong retracement on all of these, ideally retracing 50% or so of the move up from the April low. If tariffs are coming back in a big way then I think the April lows could be broken hard in the next few months.

I’ll be doing another post this week looking at the big topping patterns that may be forming here on all four of these US equity indices that could now start to play out and would note that looking at big US stocks across the indices, I am seeing patterns and divergences as negative or worse than I am seeing on these indices. I’m planning to post a selection of those over the next few days as well.

I’ve been saying the following on all my posts so far this year:

As I have been since the start of 2025 I’m still leaning on the bigger picture towards a weak first half of 2025 and new all time highs later in the year, very possibly as a topping process for a much more significant high. One way or another I think we’ll be seeing lower soon and I’m not expecting this to be a good year for US equities, not least because both of the last two years have been banner years for US equities. A third straight year of these kinds of gains looks like a big stretch. I could of course however be mistaken. UPDATE 16th July 2025 - We may now be completing the initial strong decline and then the new all time highs I projected for this year, and making the more significant high I was projecting that process might deliver.

If you like my analysis and would like to see more, please take a free subscription at my chartingthemarkets substack, where I publish these posts first. I also do a premarket video every day on equity indices, bonds, currencies, energies, precious commodities and other commodities at 8.45am EST, but only for paying subscribers. Other places to find me are my twitter, and my Youtube channel.